
Tag: price spike
Market Update June 2024
The Wholesale Electricity Market
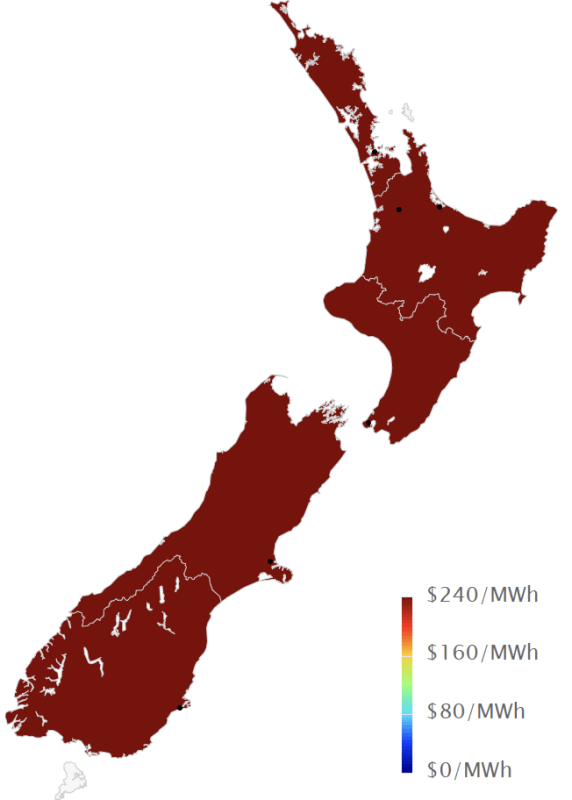
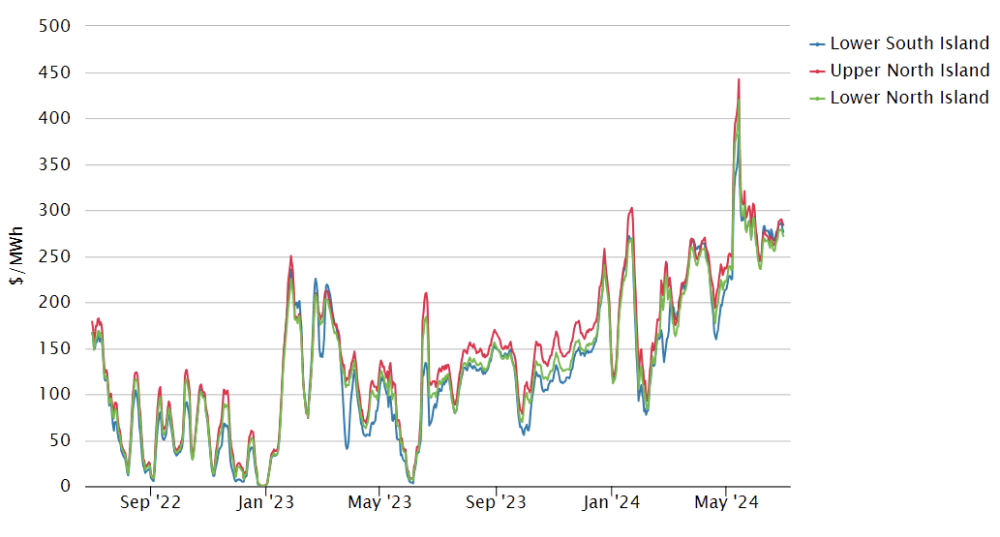
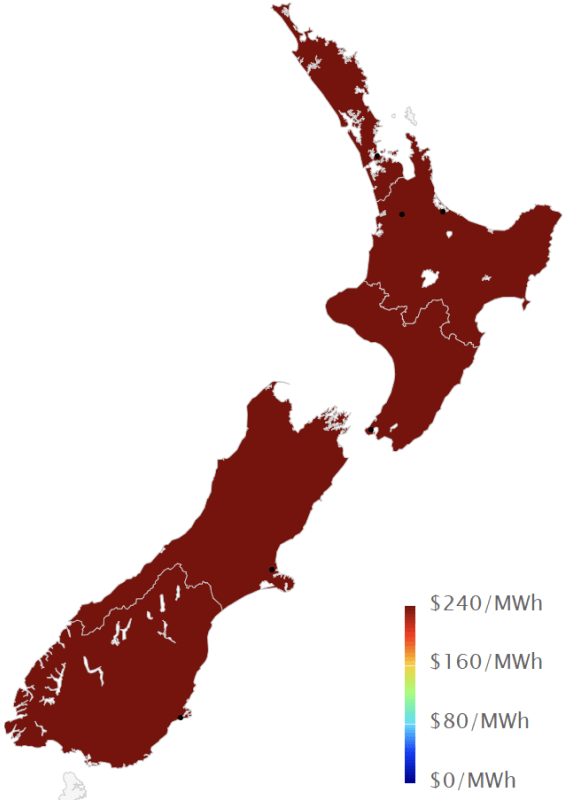
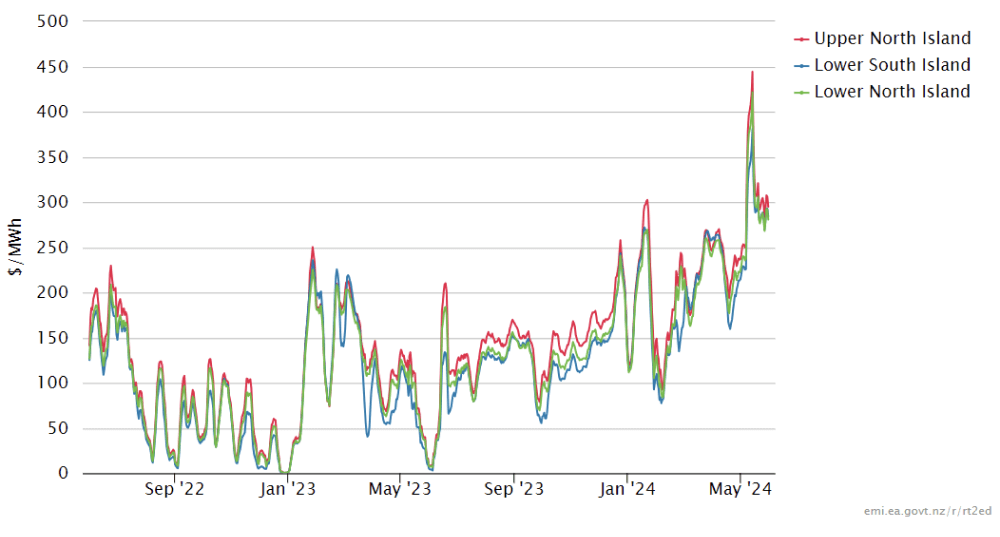
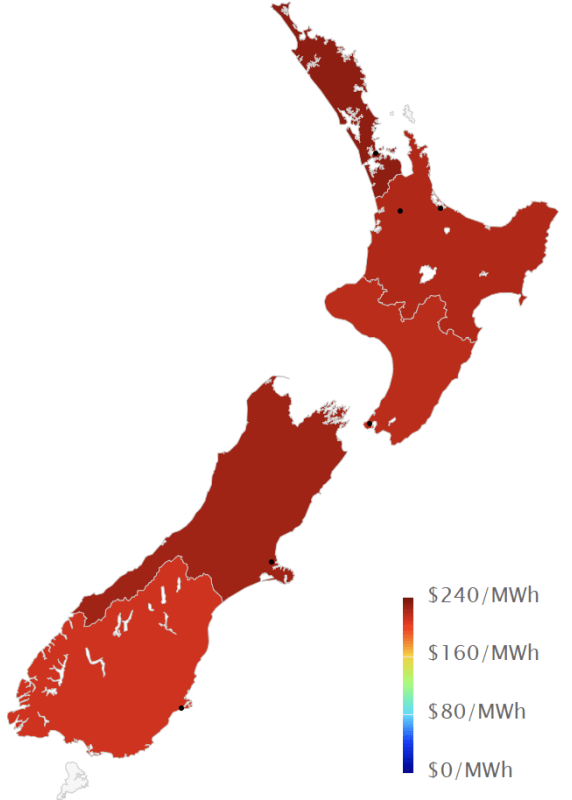
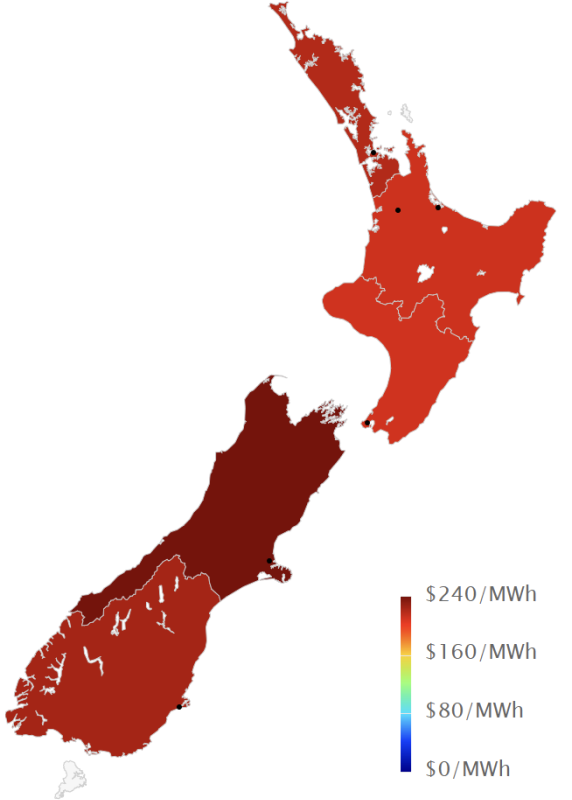
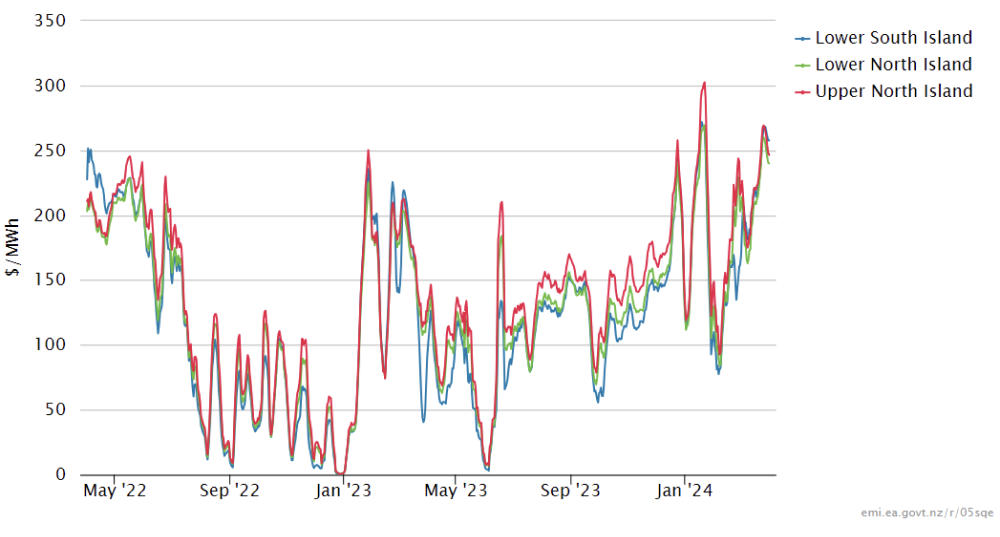
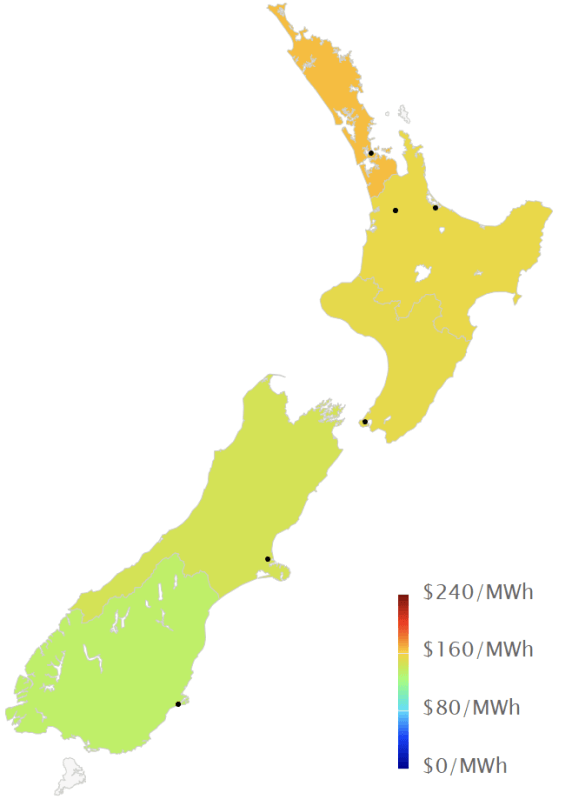
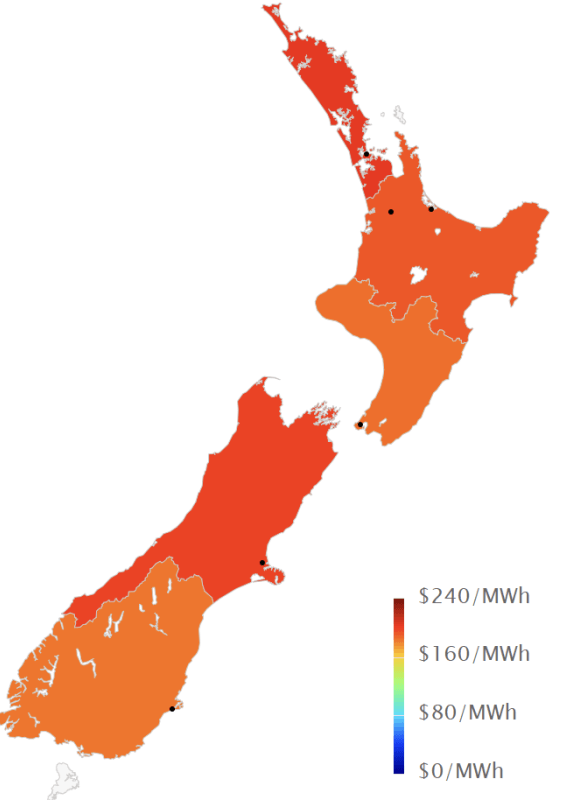
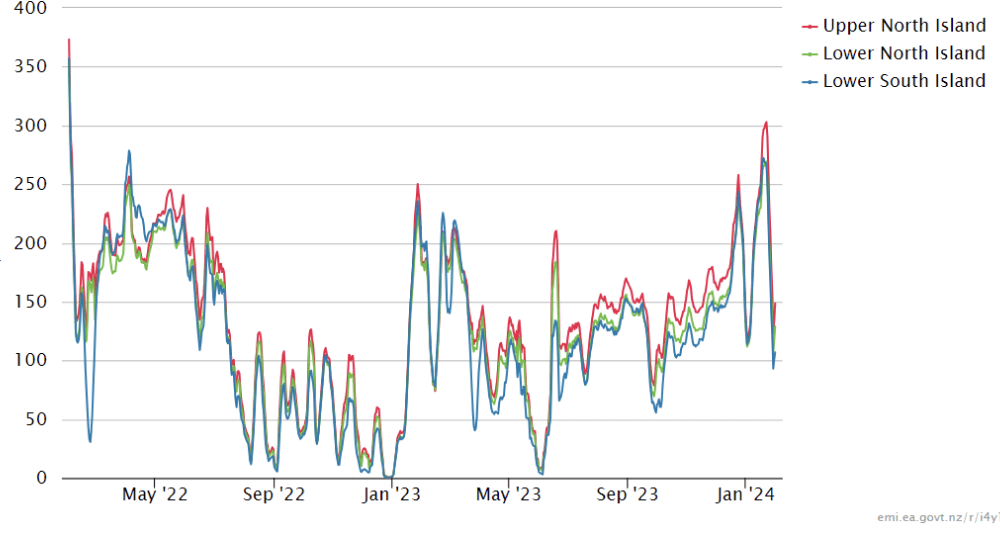
Spot prices in the wholesale electricity decreased in June but remained at very high levels. Average spot prices ranged from $248 in the central North Island (down from $301 in May), up to $286 in the upper South Island (down from $320).
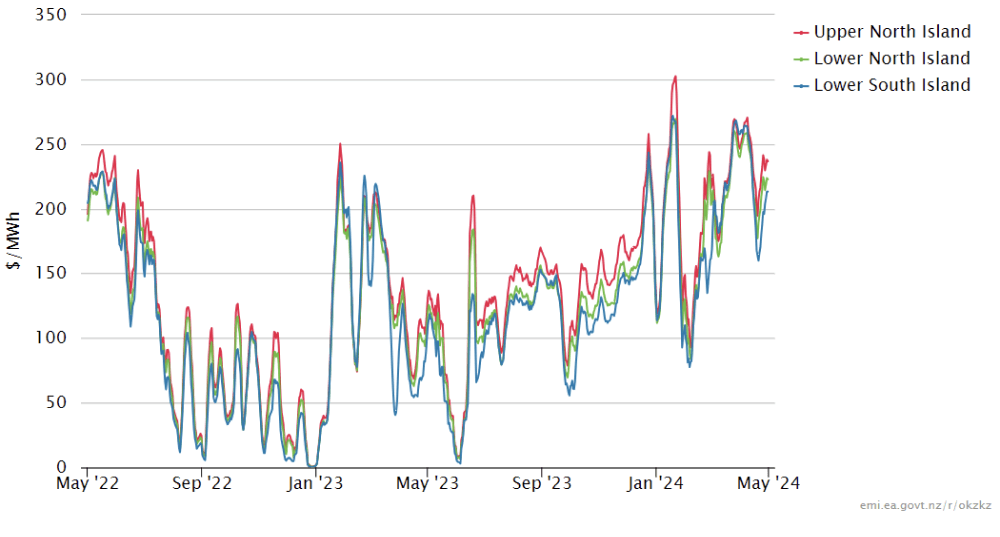
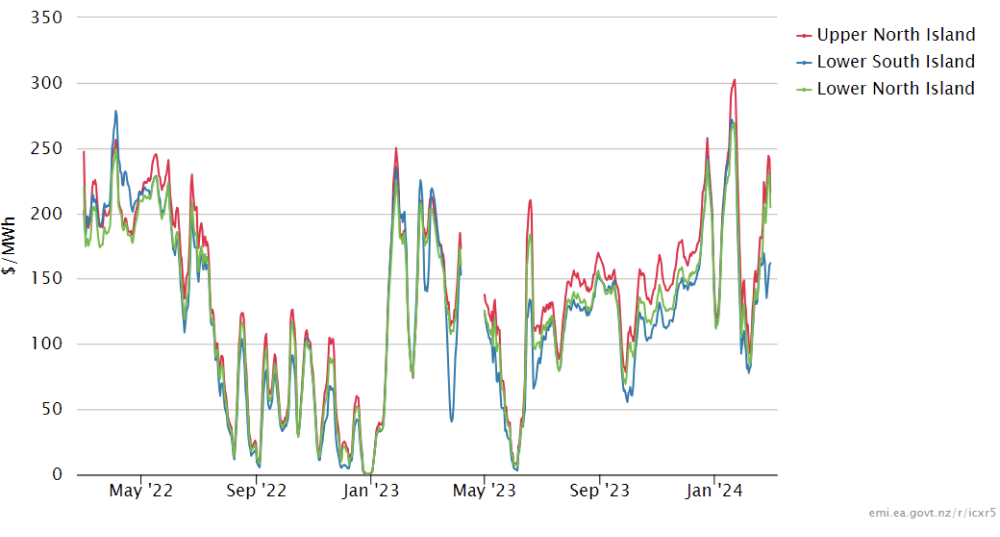
The following chart shows average weekly spot prices over the last 2 years.
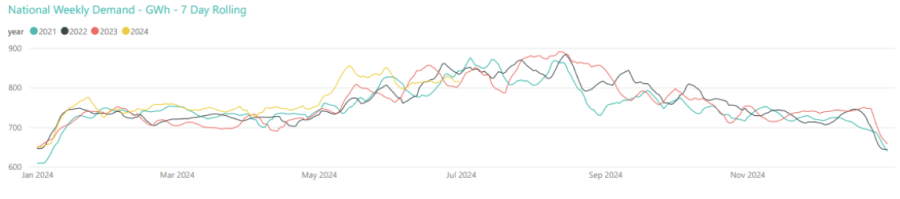
Electricity Demand
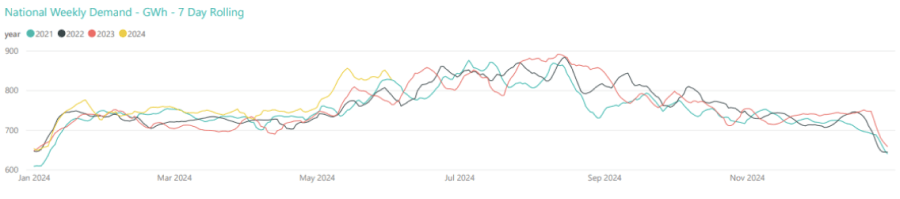
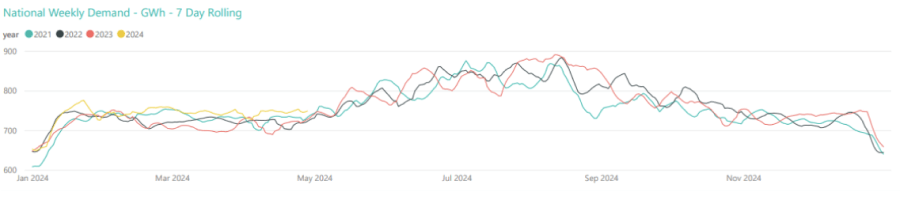
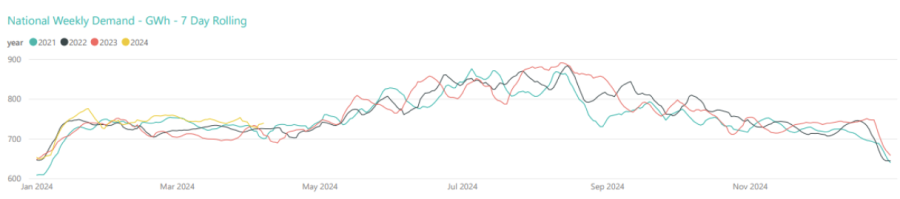
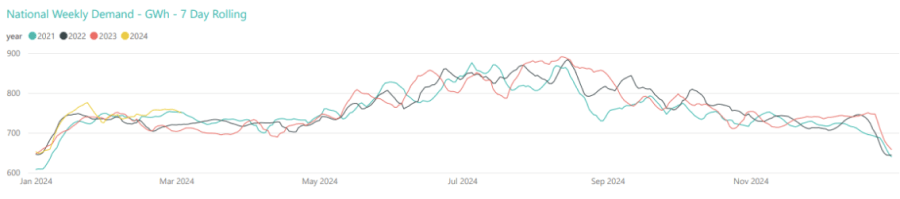
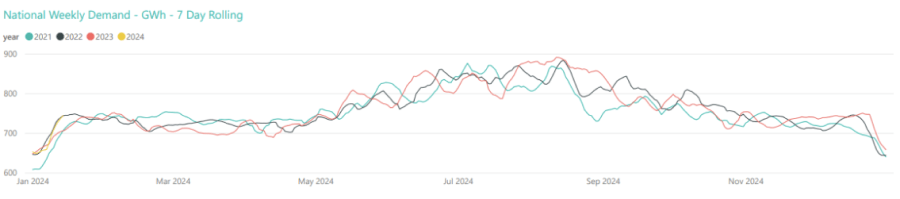
After several months of being higher than expected, electricity demand through June came back to the levels seen in winter months in recent years as shown below.
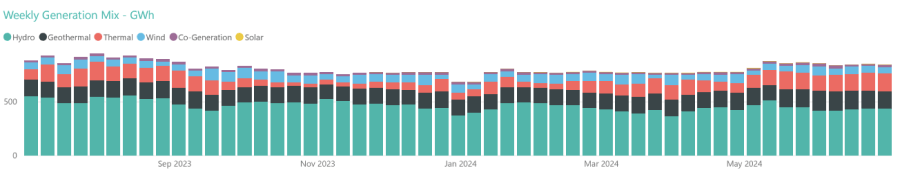
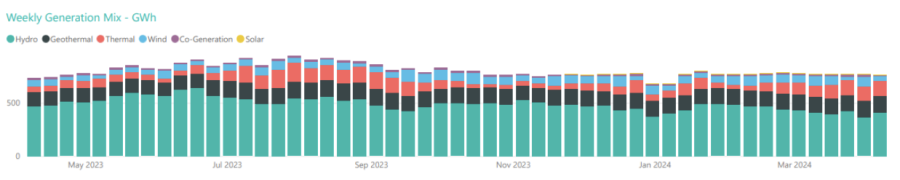
Electricity Generation Mix
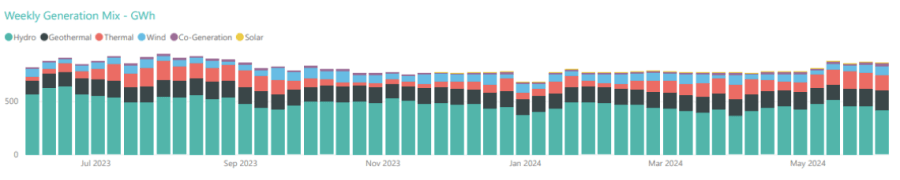
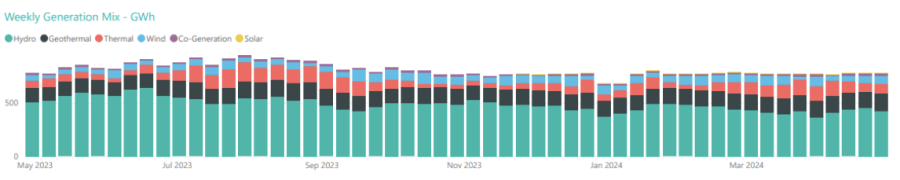
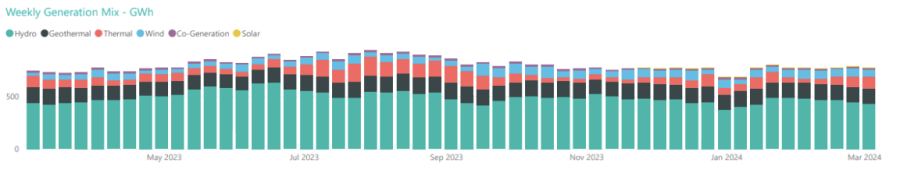
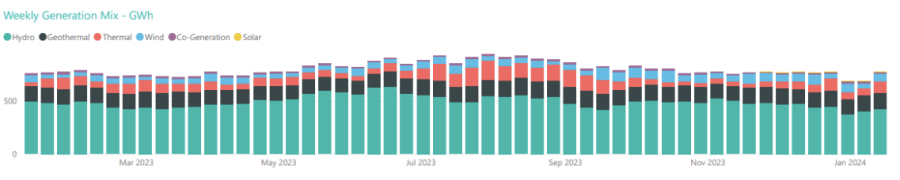
Through June the generation mix remained reasonably constant as shown below, with hydro being conserved as much as possible given the level of demand.
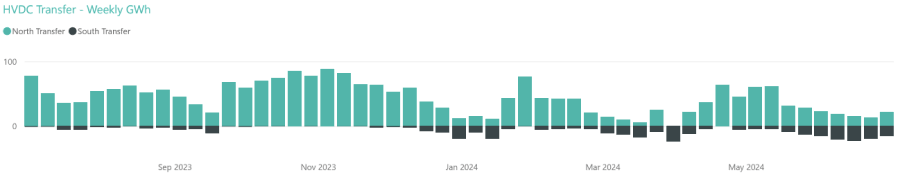
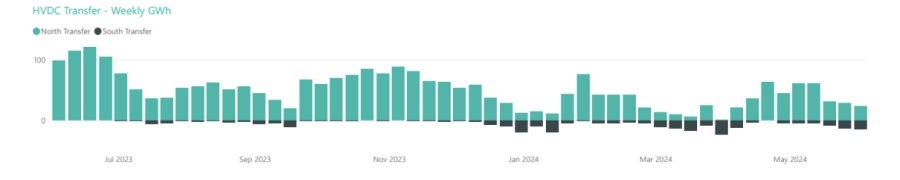
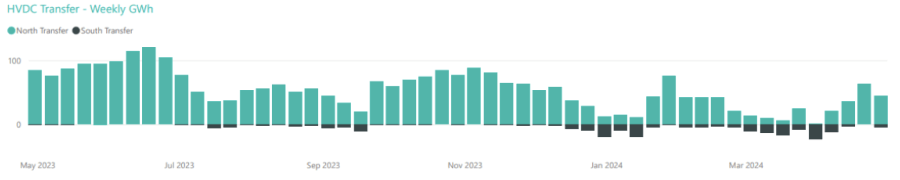
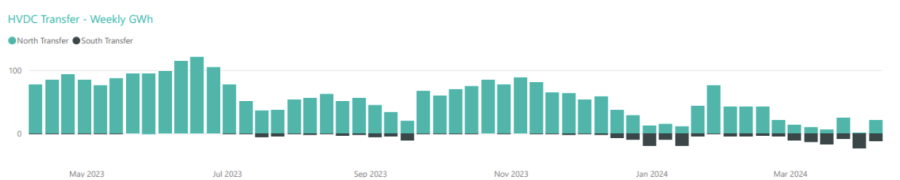
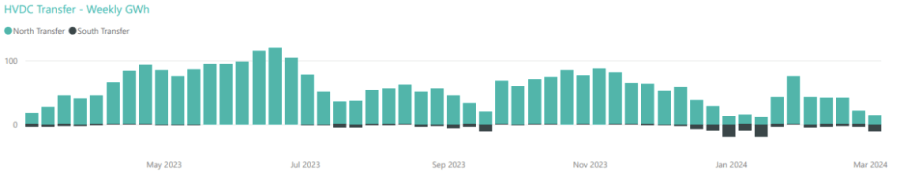
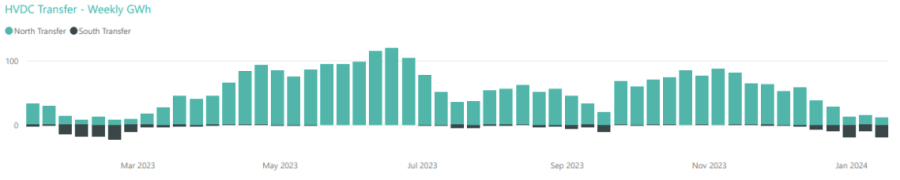
HVDC Transfer
Power transfers on the HVDC link connecting the North and South Islands are important both in showing relative hydro positions and the reliance on thermal power to meet demand. High northward flow tends to indicate a good SI hydro position, whereas the reverse indicates a heavy reliance on thermal power to make up for hydro shortages.
June saw further attempts to conserve South Island storage by reducing northward transfer and increasing southward transfer.
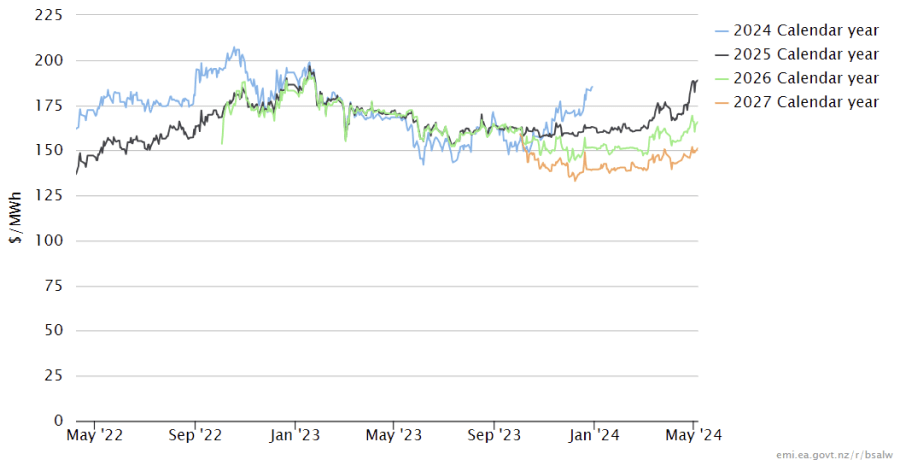
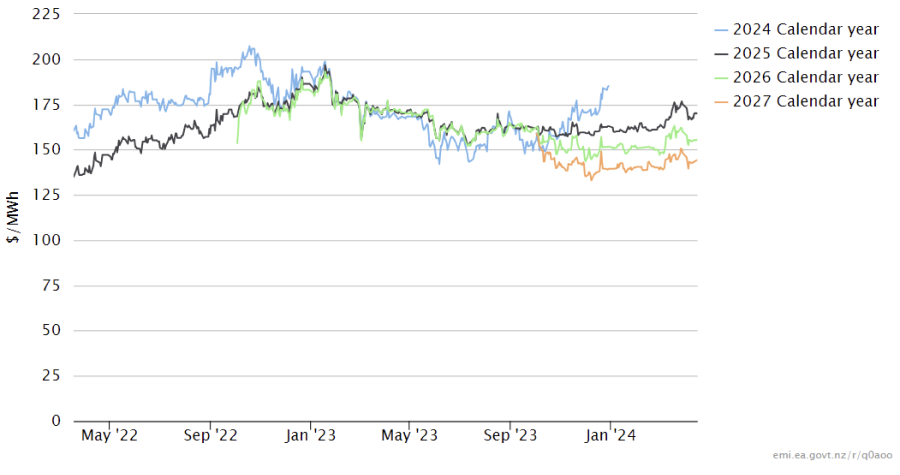
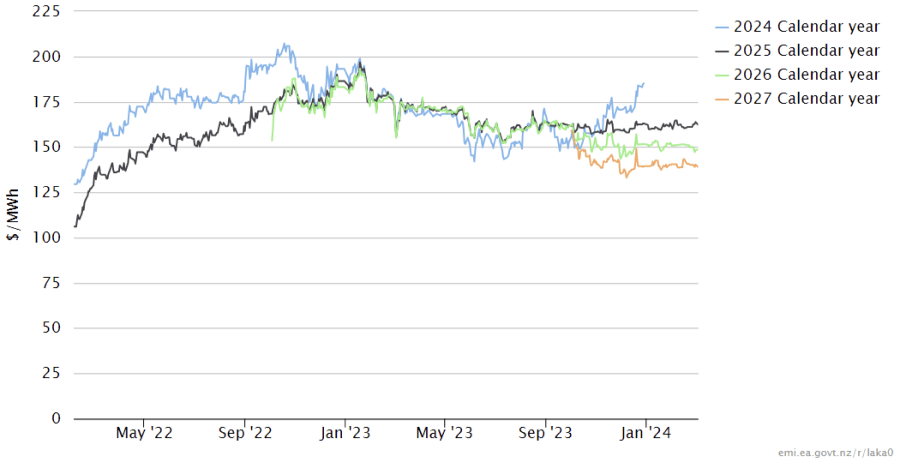
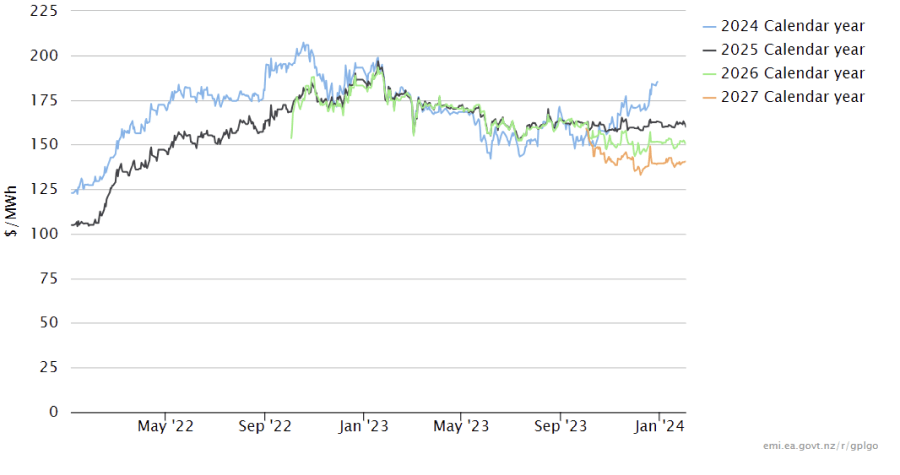
The Electricity Futures Market
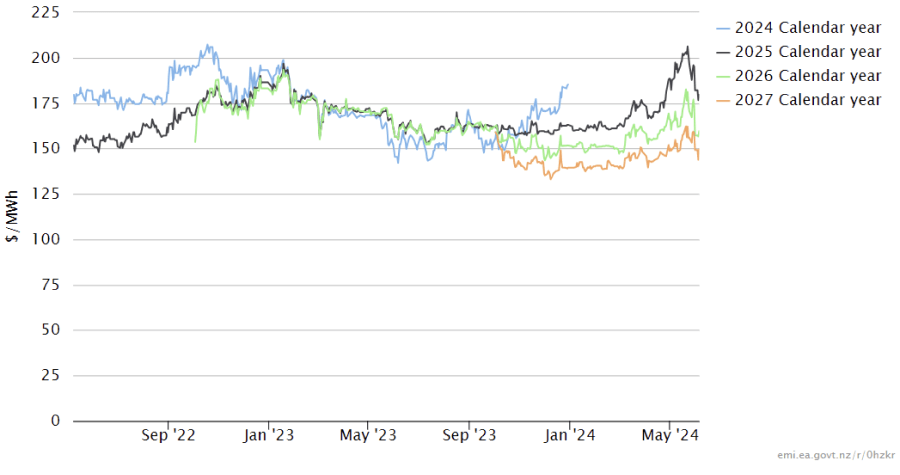
The Futures Market provides an indication of where market participants see the spot market moving in the future. They are based on actual trades between participants looking to hedge their positions (as both buyers and sellers) into the future against potential spot market volatility. They are also a useful proxy for the direction of retail contracts.
The following graph shows Futures pricing for CY 2024, 2025, 2026 and 2027 at Otahuhu (Auckland) for the last 2 years.
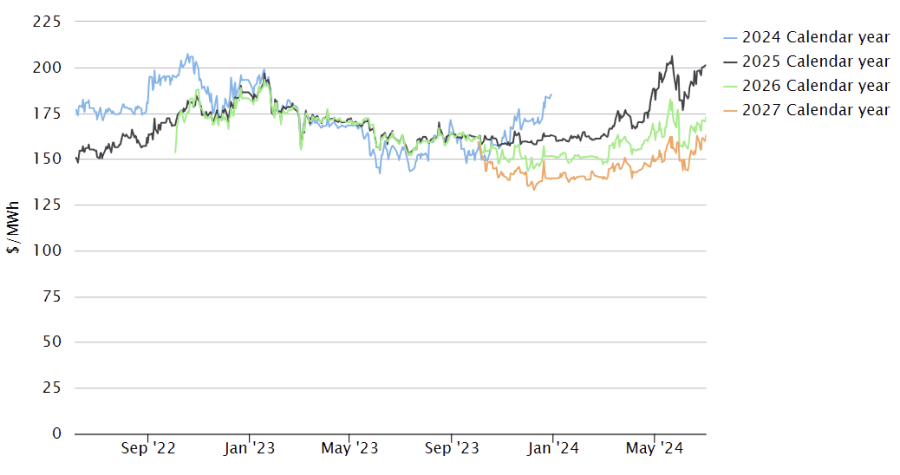
Note that $100/MWh equates to 10c/kWh.
Forward prices were up in June for all future years. CY 2025 ended the month up 10% at $200. CY 2026 price was up 9% at $171 while CY 2027 closed up 8% at $161/MWh.
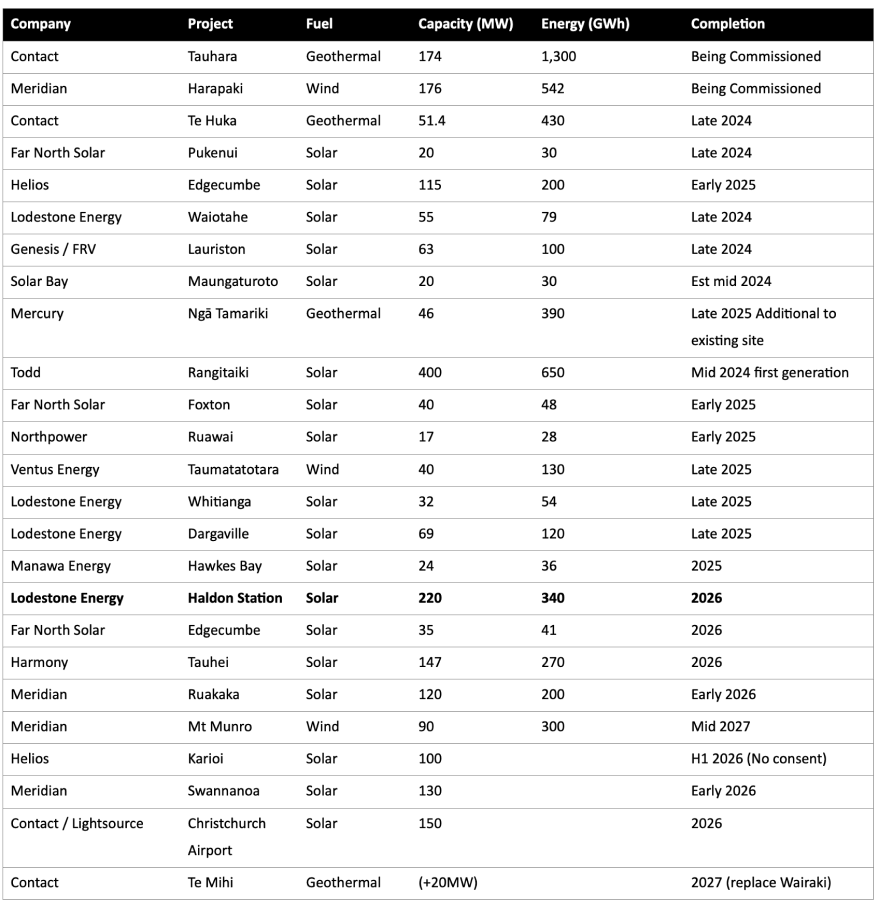
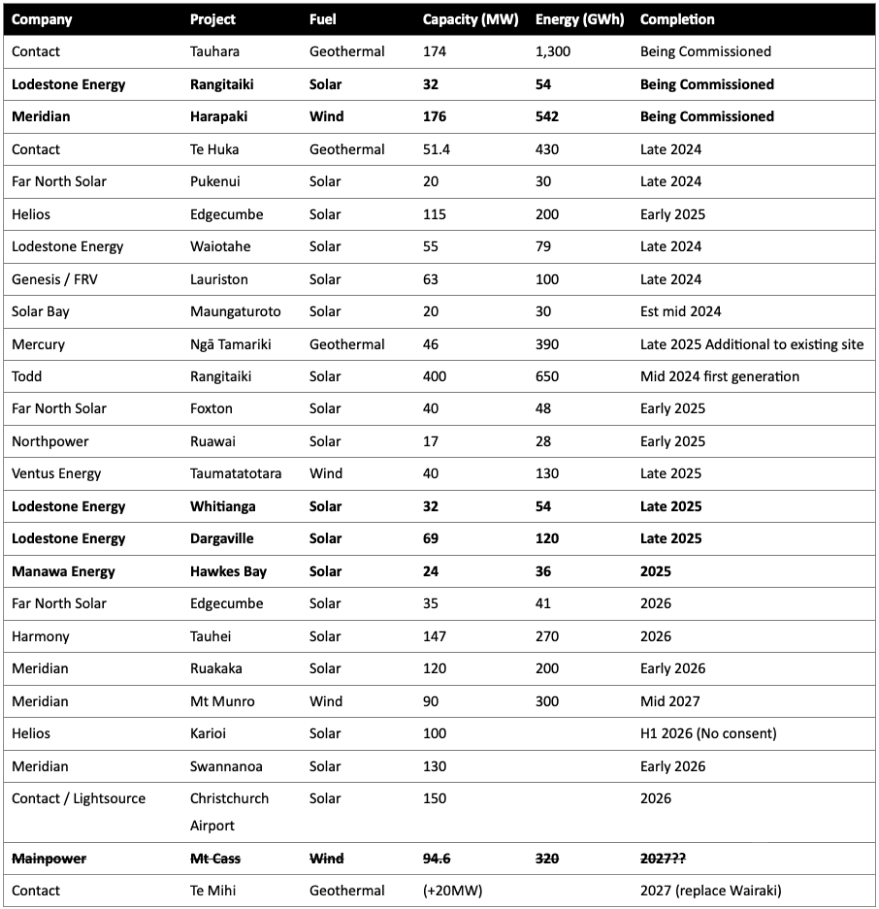
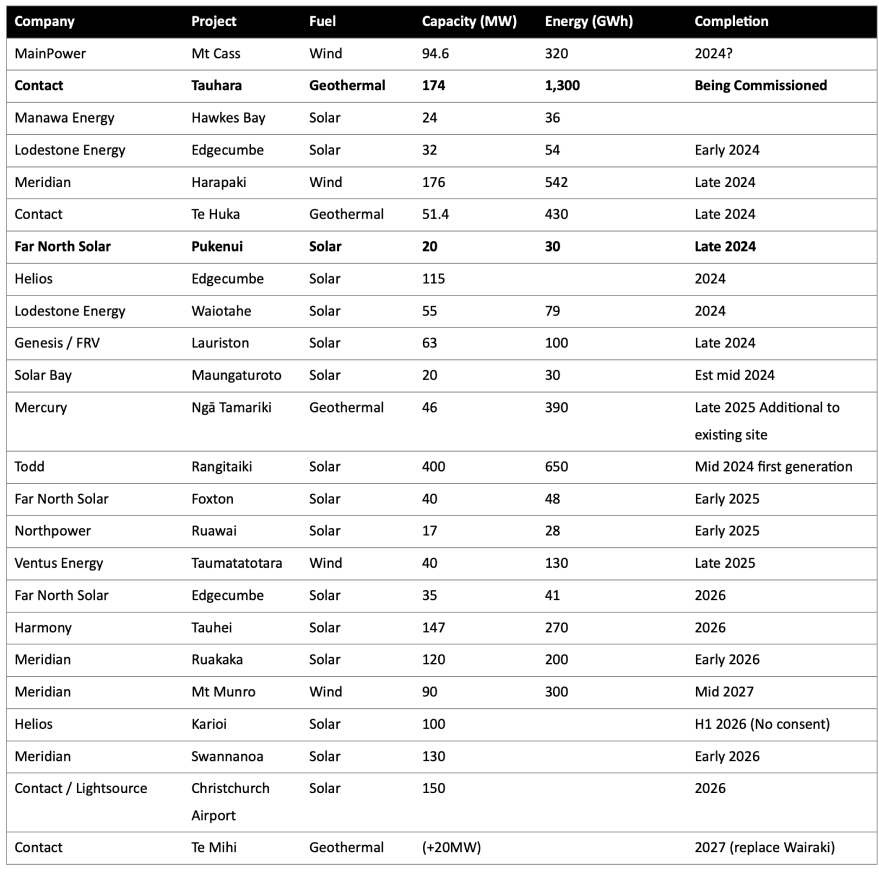
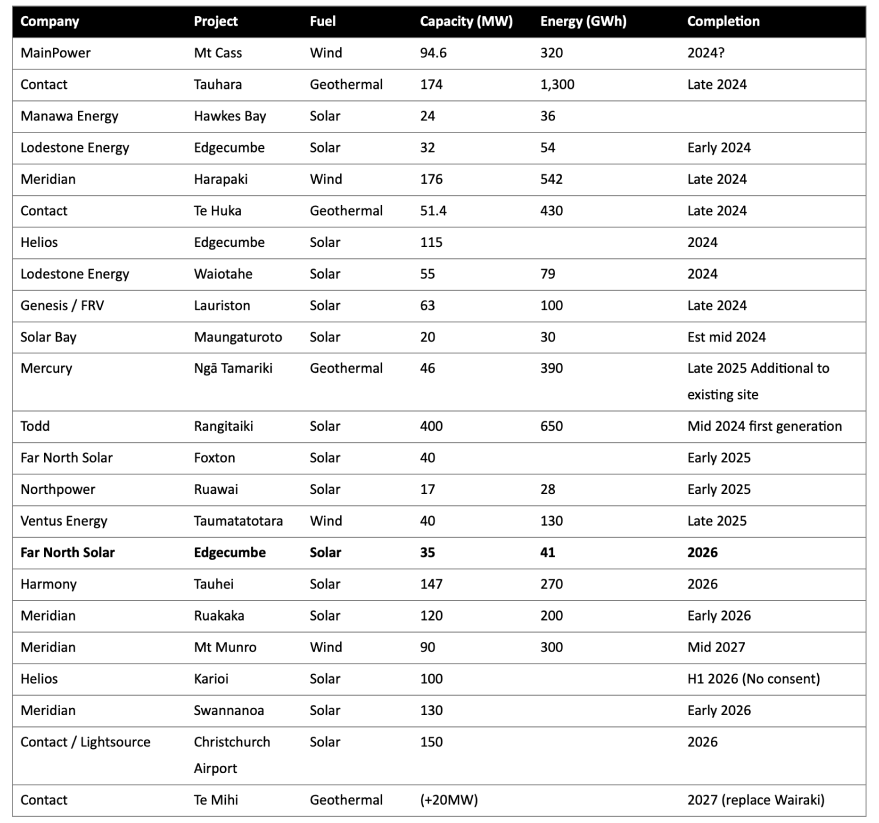
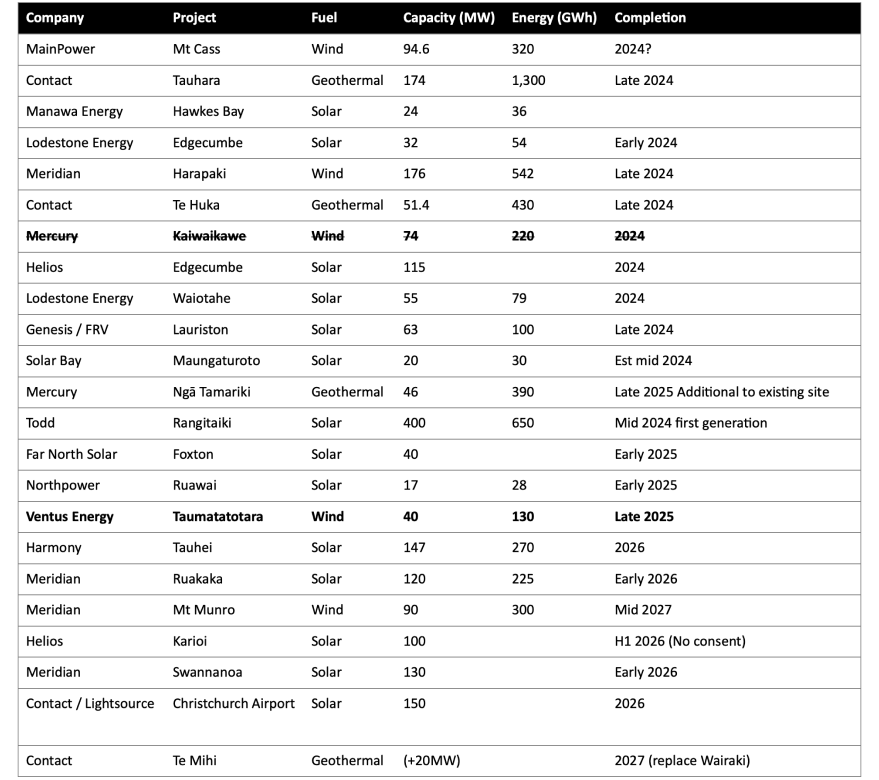
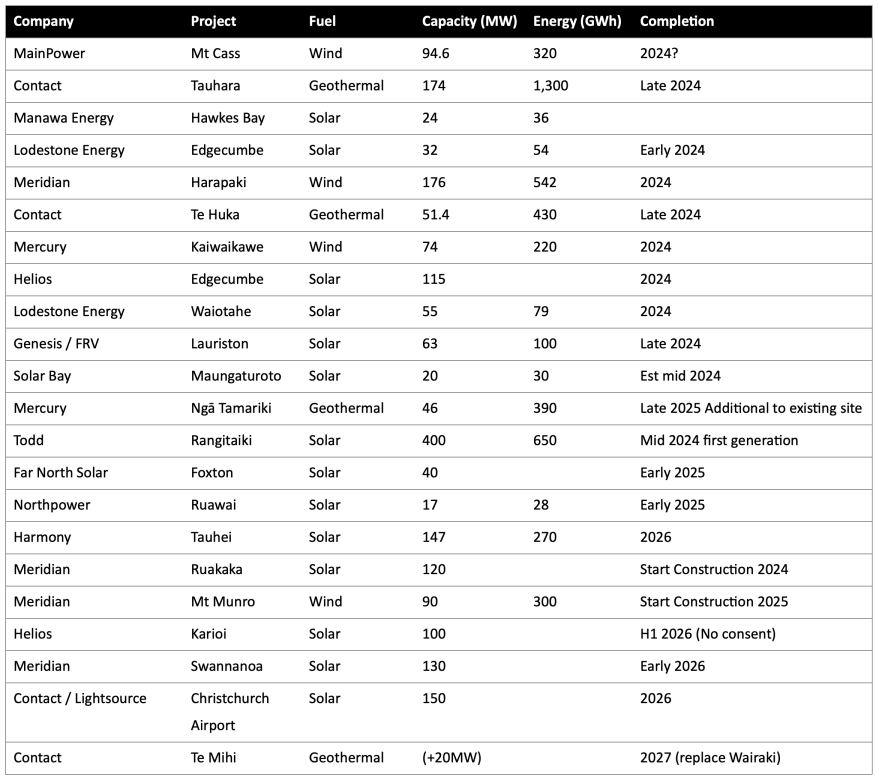
Known new generation projects are shown below (additions / removals / changes highlighted in bold).
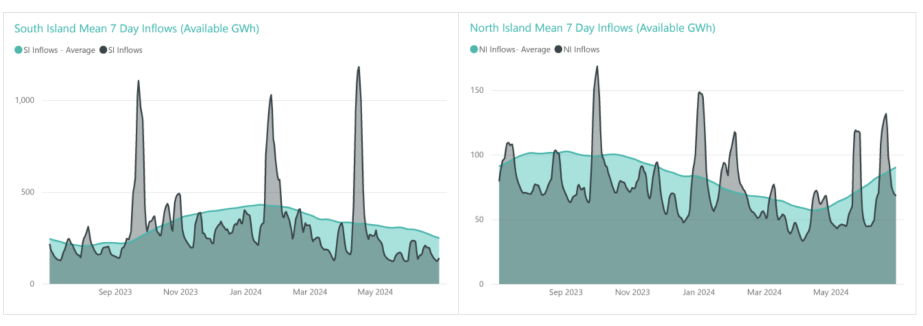
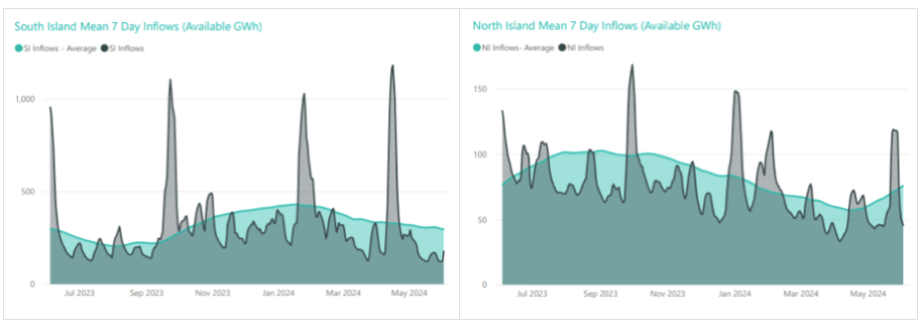
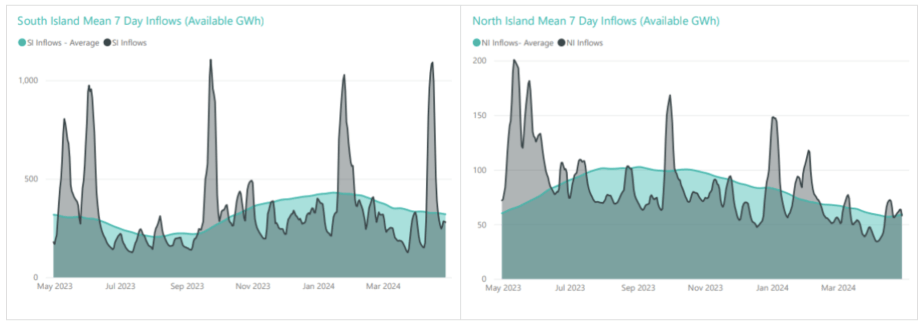
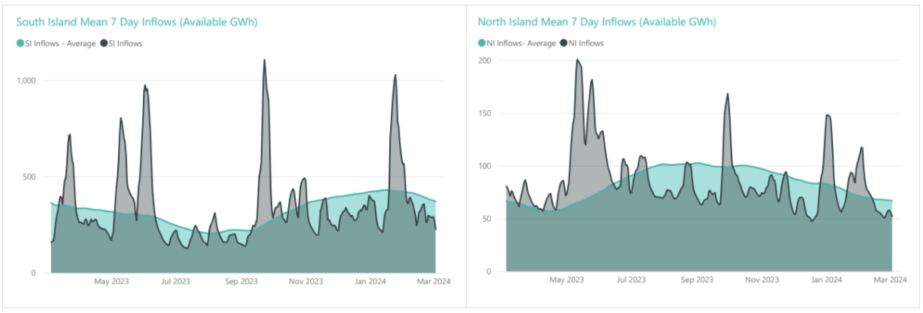
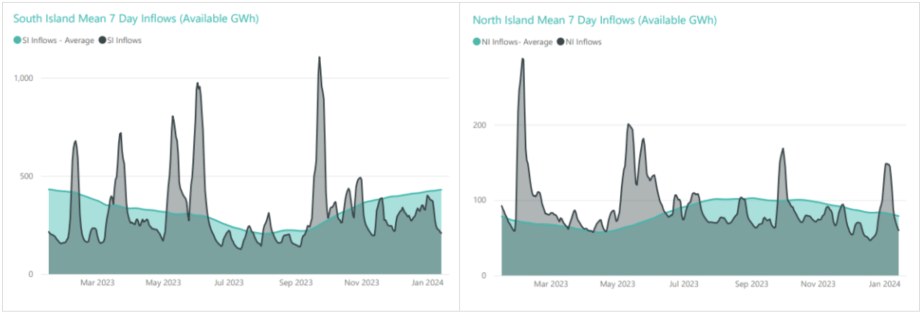
Hydro Storage
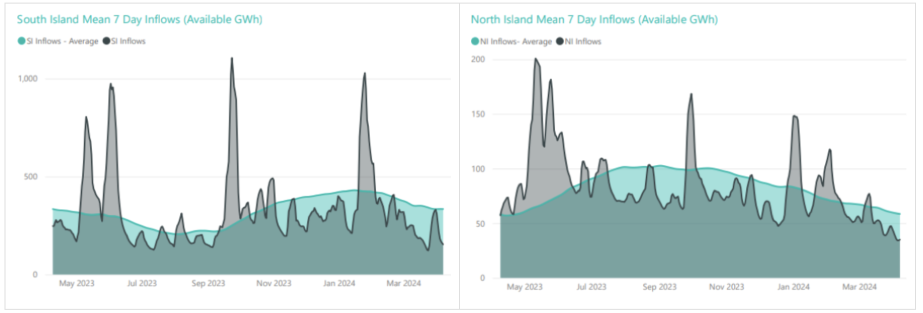
Inflows were very low again in the South Island during June. The North Island had below average inflows at the start of the month, however they picked up later to almost end up at average levels for the month.
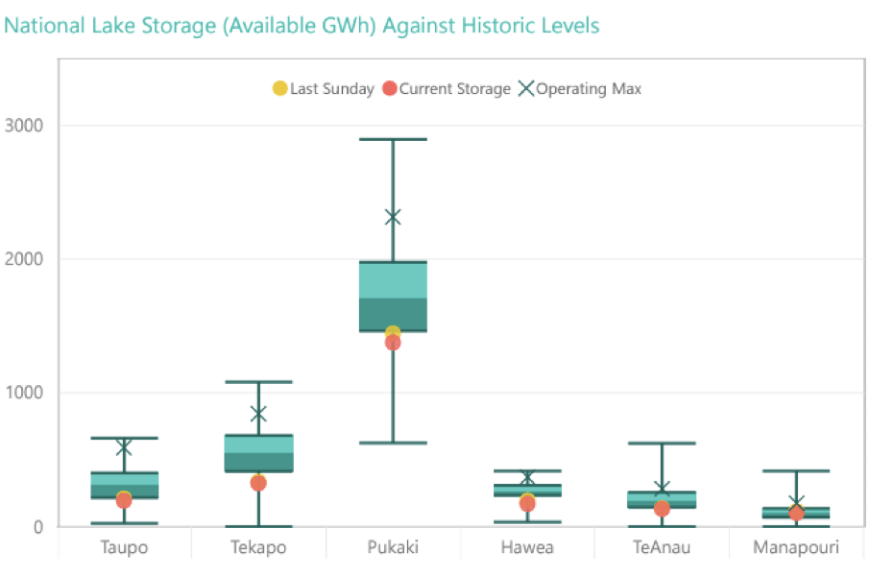
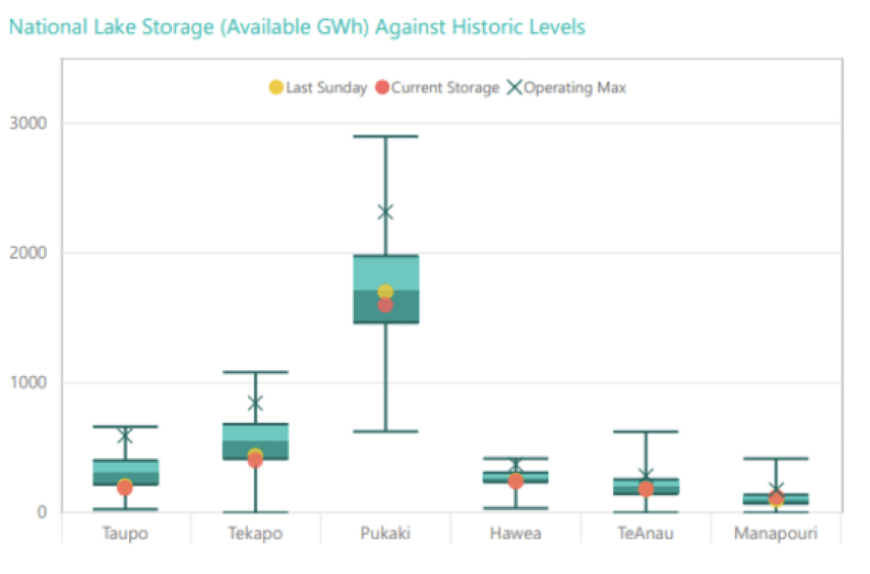
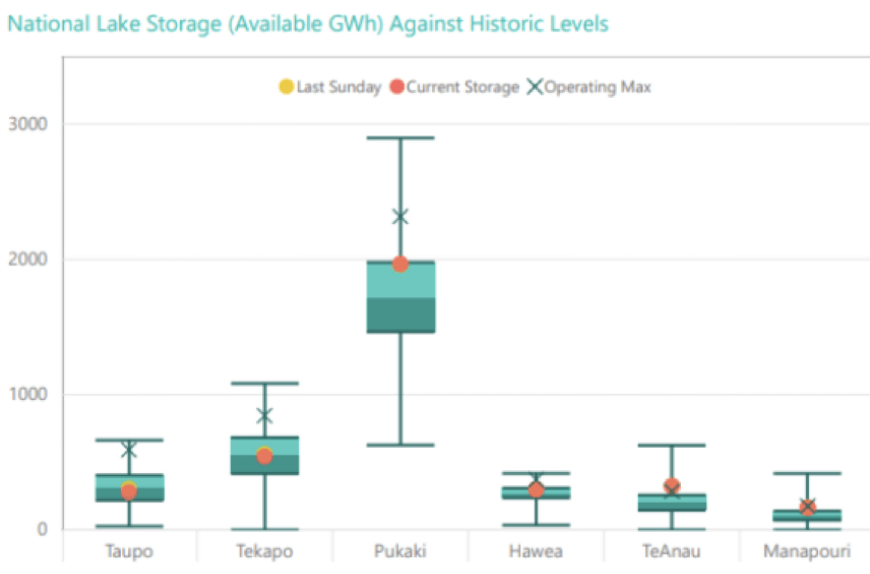
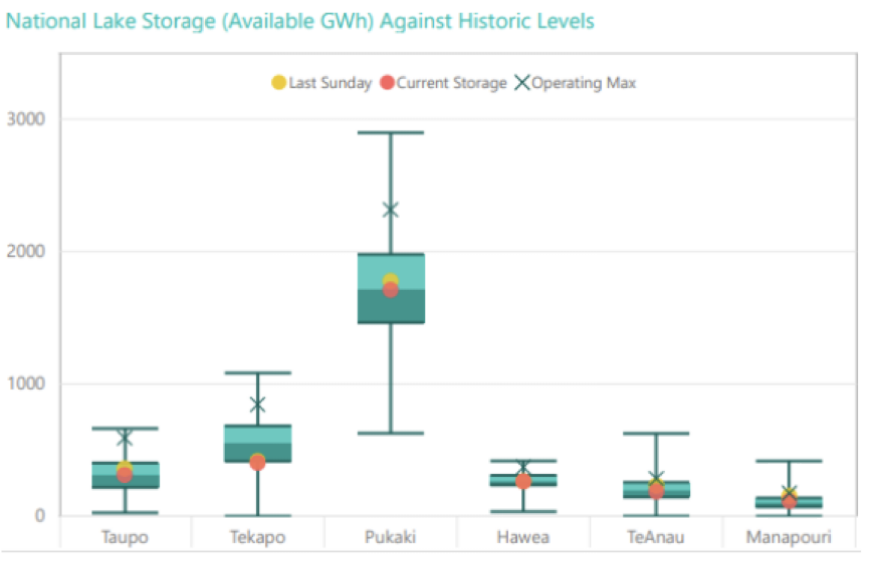
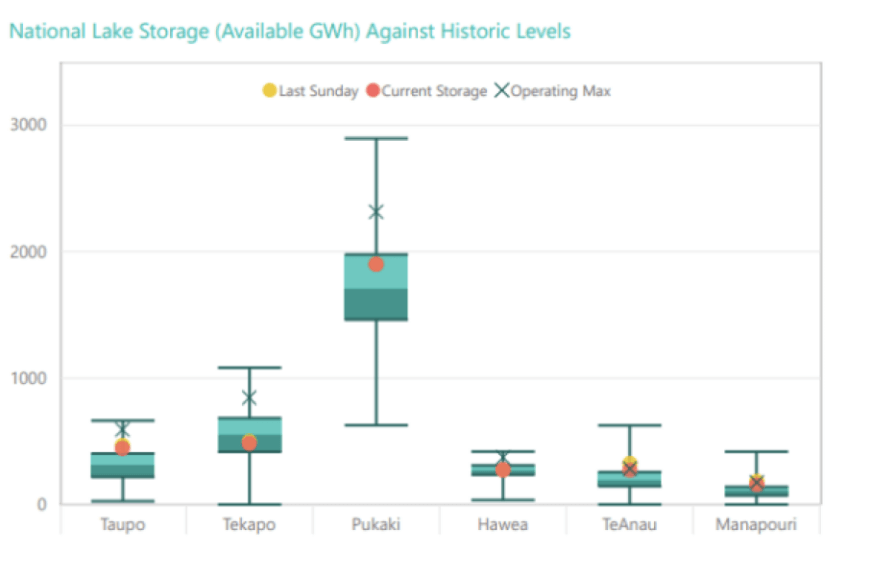
Very low inflows resulted in energy storage levels continuing to fall through June, though at a reduced rate compared to May. NZ storage ended the month at 2,182GWh or 48% full, down 419GWh. The following chart shows the latest breakdown of storage across the main hydro catchments.
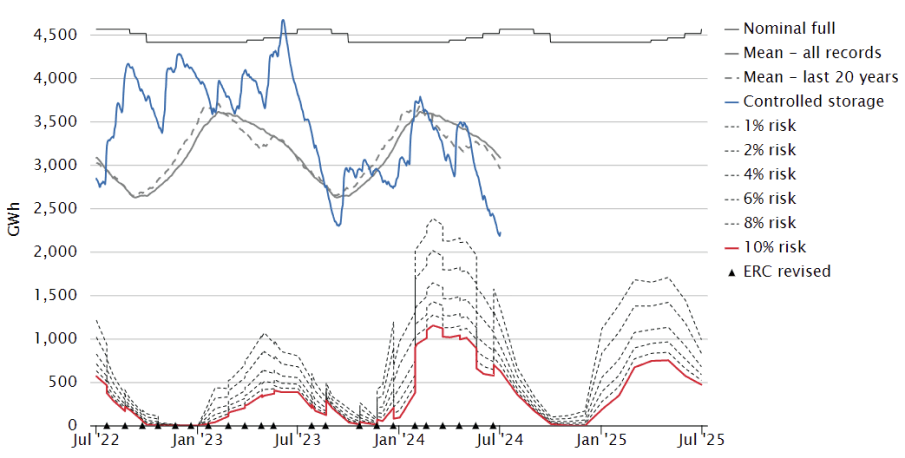
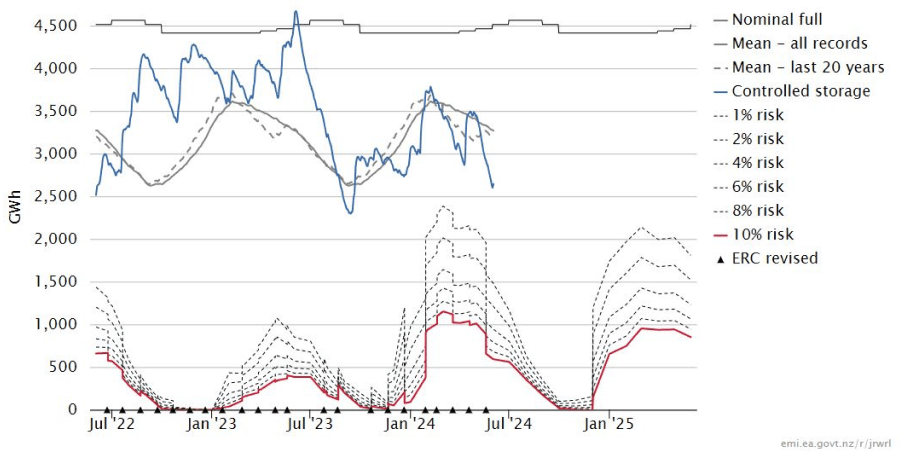
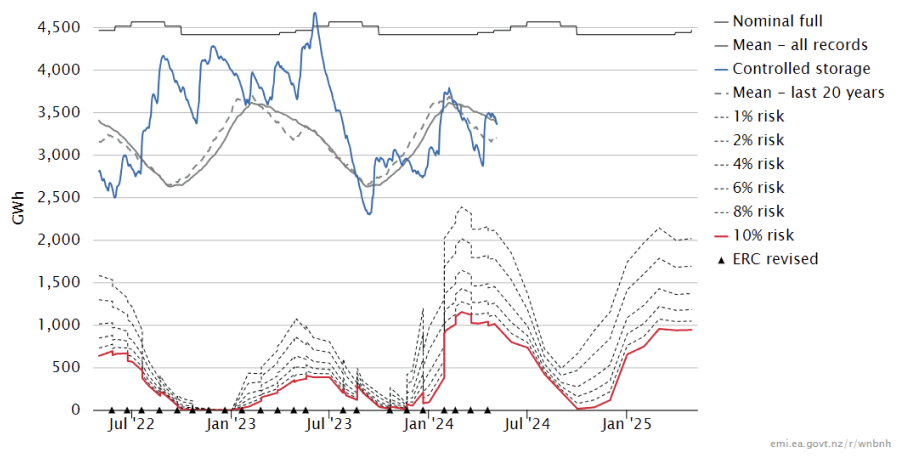
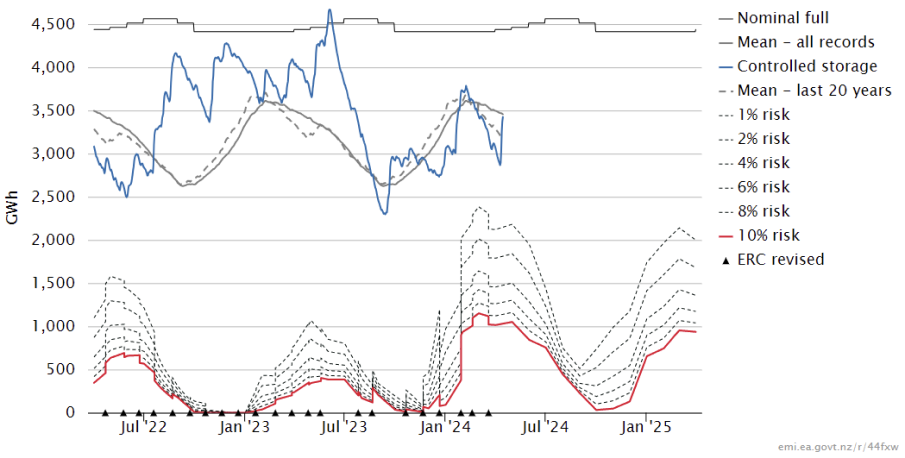
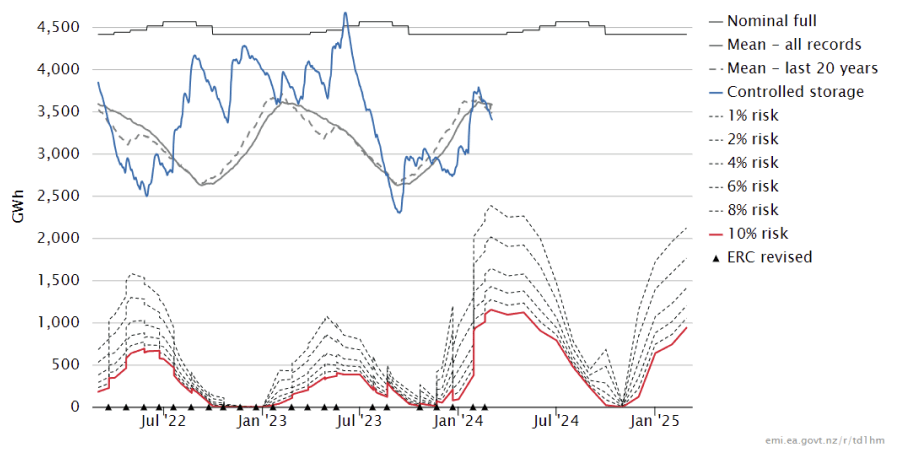
Security of supply risks increased further in June with storage levels decreasing. This is shown in the following risk curves.
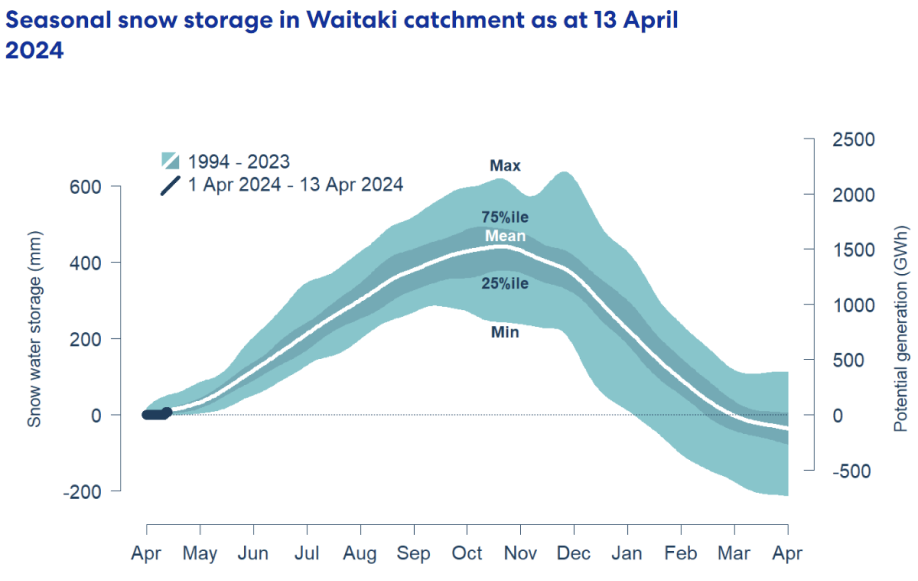
Snowpack
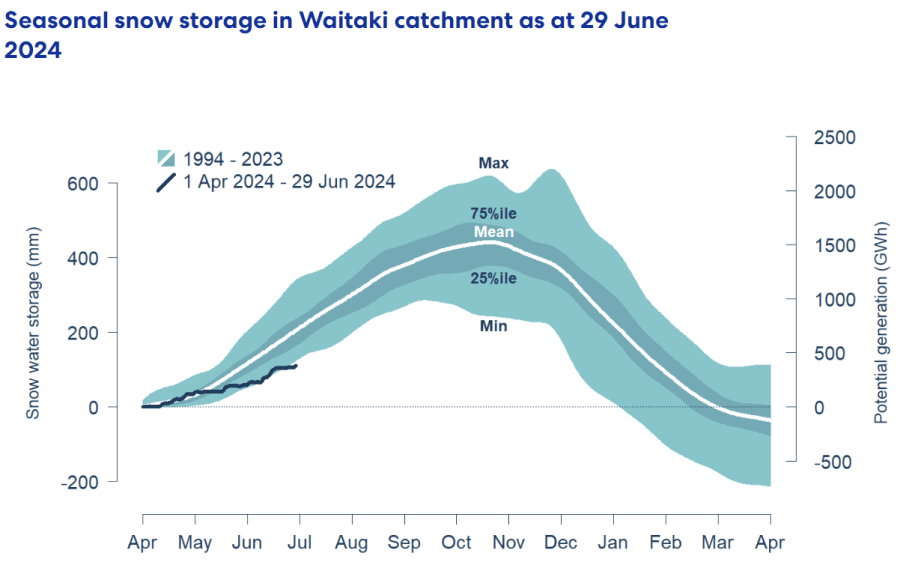
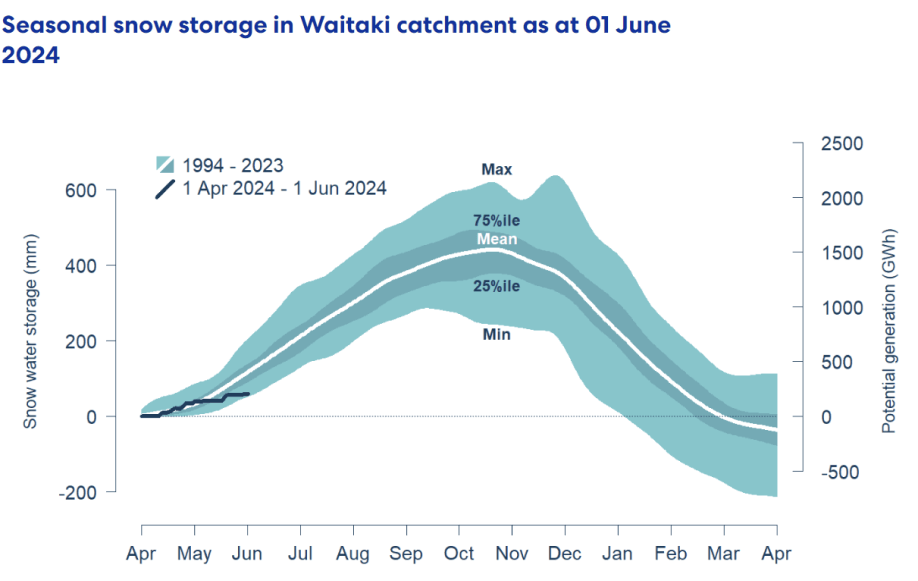
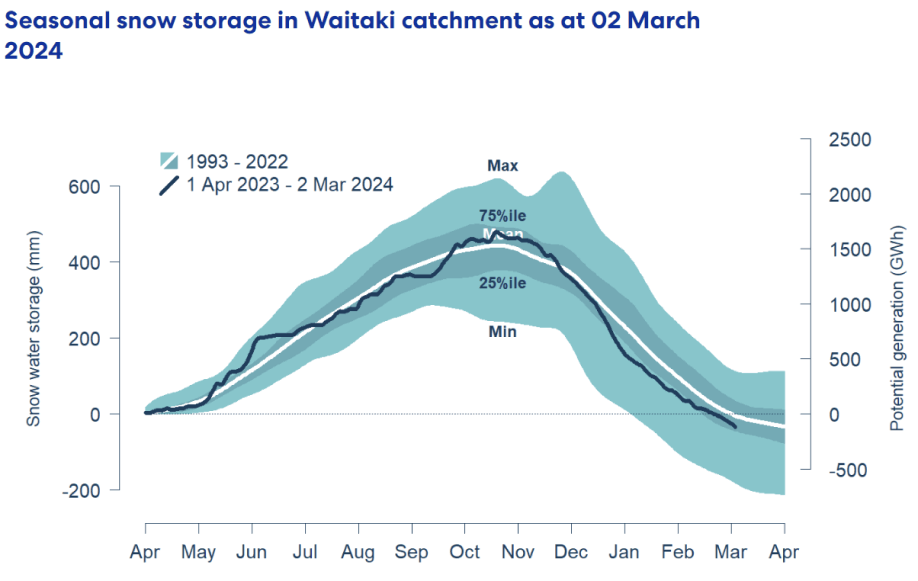
Snowpack is an important way that hydro energy is stored over the winter months and released as hydro inflows in the spring. The following graph shows that the snowpack in the important Waitaki catchment is currently close to the minimum levels seen in the last 30 years for this time of year.
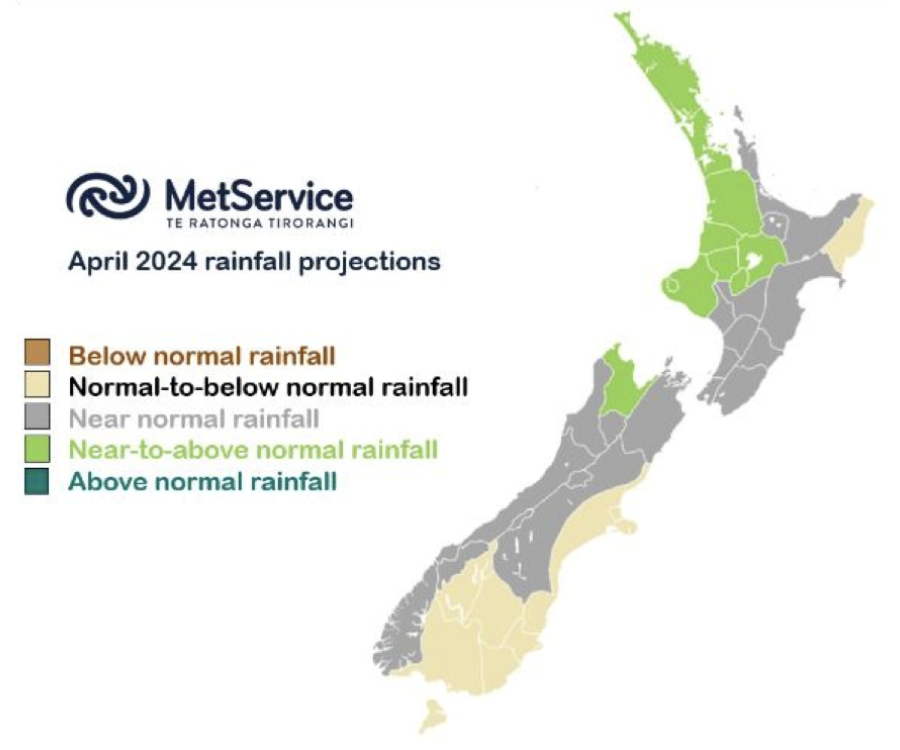
Climate outlook overview (from the MetService)
Climate Drivers — June was a good reminder that winter can throw up all sorts of weather maps, especially when large scale climate drivers, like the El Niño Southern Oscillation (ENSO) are firmly in neutral territory. ENSO will remain neutral through the winter months and the most useful climate drivers to monitor over coming months will be those closer to home, including the Southern Annular Mode (SAM).
SAM is measure of how far north or south a belt of strong westerlies sits in the Southern Ocean. When strongly positive, the storms tend to run further south – through the Southern Ocean as high pressures are favoured around New Zealand. When SAM is strongly negative high pressure sits well to the south with lower-than-normal pressure around the Chatham Islands and enhanced westerlies across New Zealand. SAM is an important tool for medium range forecasting in New Zealand and you can find more information here; https://blog.metservice.com/Southern-Annular-Mode.
SAM has taken a bit of a nosedive over recent days, and this has helped inject cold air over NZ to start the month. Cool airmasses are likely to hang around with SAM remaining largely negative over the first week of the month, before a strong and prolonged positive phase is forecast through week two towards mid-month, hinting at a spell of settled and dry weather nationally. Expect SAM to be increasingly volatile later this month, with fast-moving weather patterns and changeable weather redeveloping.
Sea surface temperatures around and south of New Zealand remain just below average overall, despite a slight warming since May. There remains a heightened chance of La Niña developing this spring, with flow on effects possible as we approach the summer months.
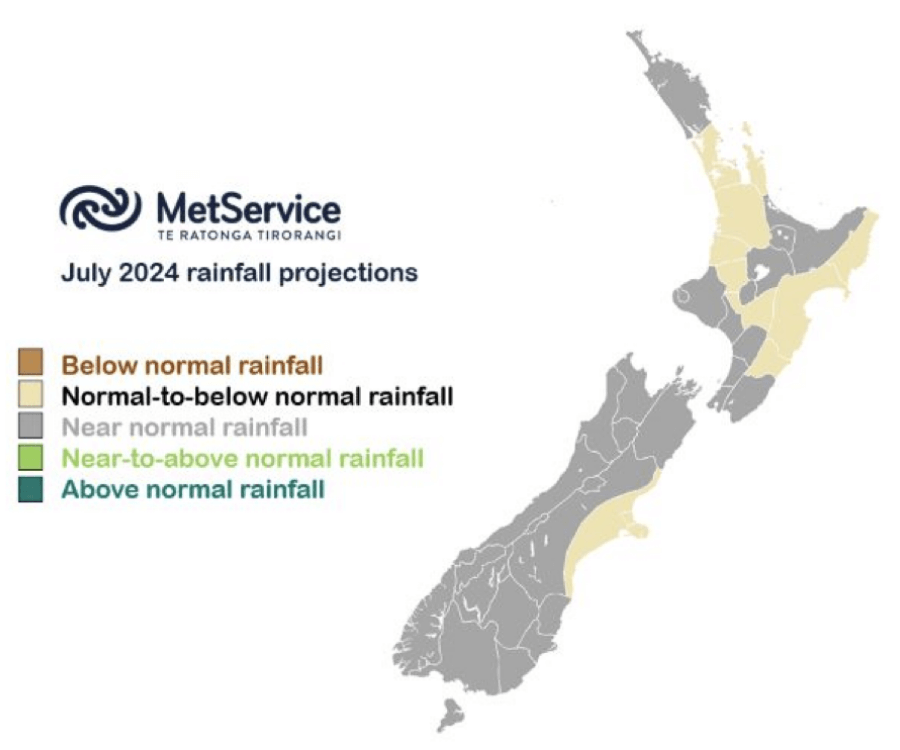
July 2024 Outlook — uly started off with a very mobile Southern Ocean low (thank you negative SAM) crossing the country and a burst of heavy rain for all, followed by cold south-westerly showers. The lower South Island also saw snow to low levels as cold air flooded in. Despite the mild June, this event has really helped kick ski resorts into gear with many of the South Island ski fields seeing 30-60cm of fresh snow as this system moved through and now looking in fantastic shape for the start of the school holidays next week.
Cold and sometimes brisk southerly quarter winds remain on the cards for most of the country into early next week, beginning Monday 8th, as high pressure near Tasmania extends a dominant ridge north-eastward across the Tasman Sea. Whilst we might see the odd shower at times in this flow, there will be plenty of fine, dry, sunny afternoons and crisp, frosty mornings, but watch out for sharp winds in exposed windward and mountainous areas. As we move into the start of calving season, farmers should keep one eye on those minimum temperatures, with some of the coldest weather we have seen this year likely by the end of this week and widespread rural frosts forecast.
This high-pressure cell will become centred over New Zealand itself early next week, then only gradually drift eastward towards mid-month. These cold, winter highs can often be quite slow to move away and should offer up a prolonged spell of dry, settled weather nationwide. However, different weather hazards can present themselves in these set-ups including widespread frosts, icy roads, cold daytime temperatures, thick valley fogs and persistent low cloud. Despite the lack of forecast rain, it will pay to check in with your latest forecast at metservice.com.
As we head towards mid-month, weather models gradually move this high pressure away from our shores, with a weather system brewing in the Tasman Sea and a return of milder N-NW winds across the country. Expect a more unsettled window to develop as this Tasman system moves in, with northern and western facing portions of NZ most at risk of seeing heavy rain as it moves in. This feature might bring a few days of inclement weather, but don’t expect it to stall for weeks on end to the west of the country like we saw in June. Indeed, through the second half of July, expect the weather maps to change regularly as low pressure systems and fronts move through much more quickly than last month. Expect temperatures to bounce around through the second half of July too, with some very mild spells followed by sharp cold snaps.
So, despite a cold and dry opening salvo this July, a much more unsettled outlook from mid-month means overall we may end up fairly close to July averages for monthly rainfall and temperatures right across the country, albeit with some drier anomalies favoured for Canterbury and central parts of North Island.
The Wholesale Gas Market
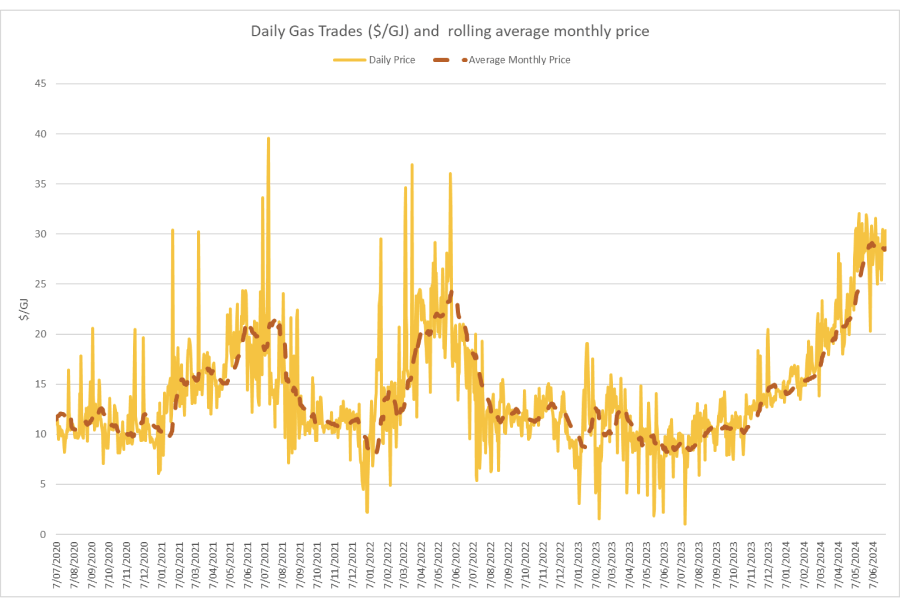
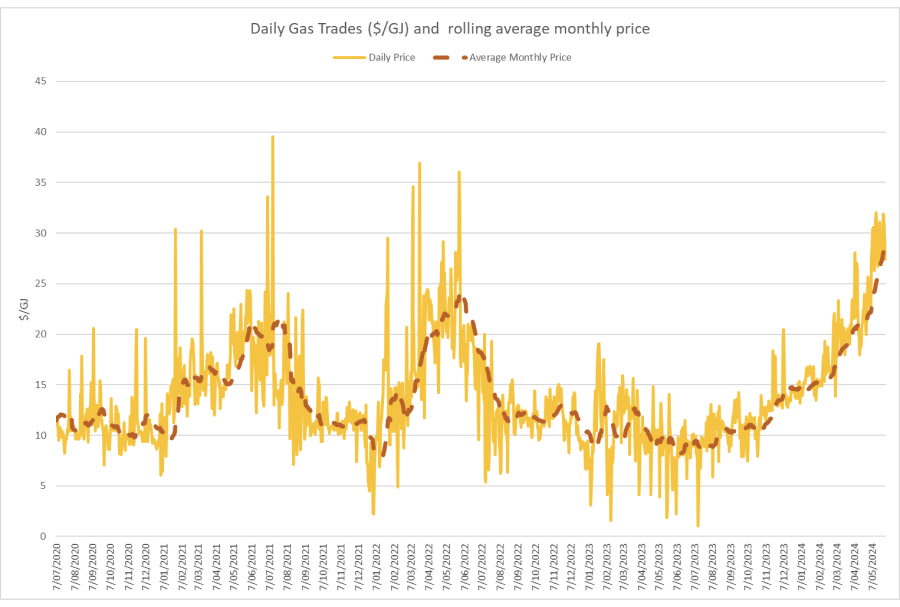
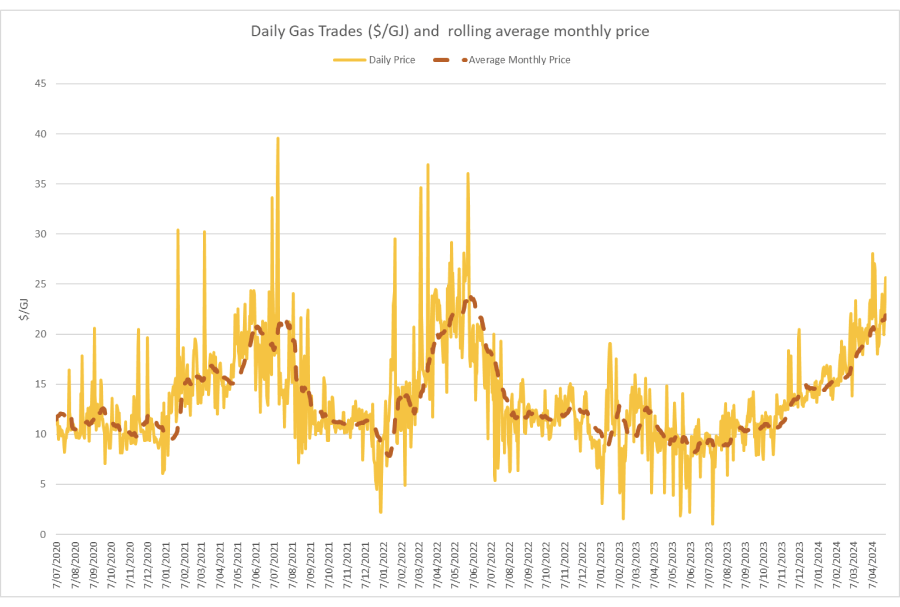
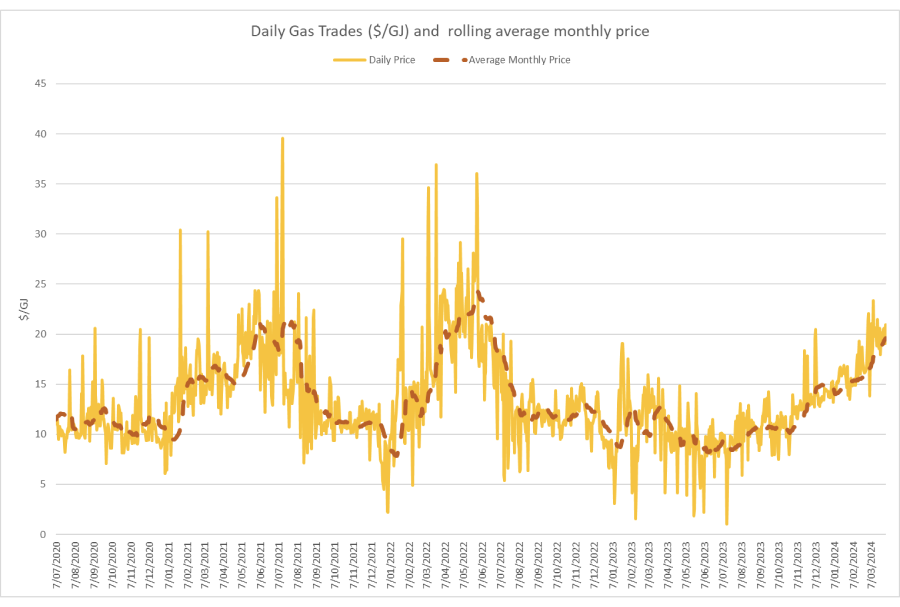
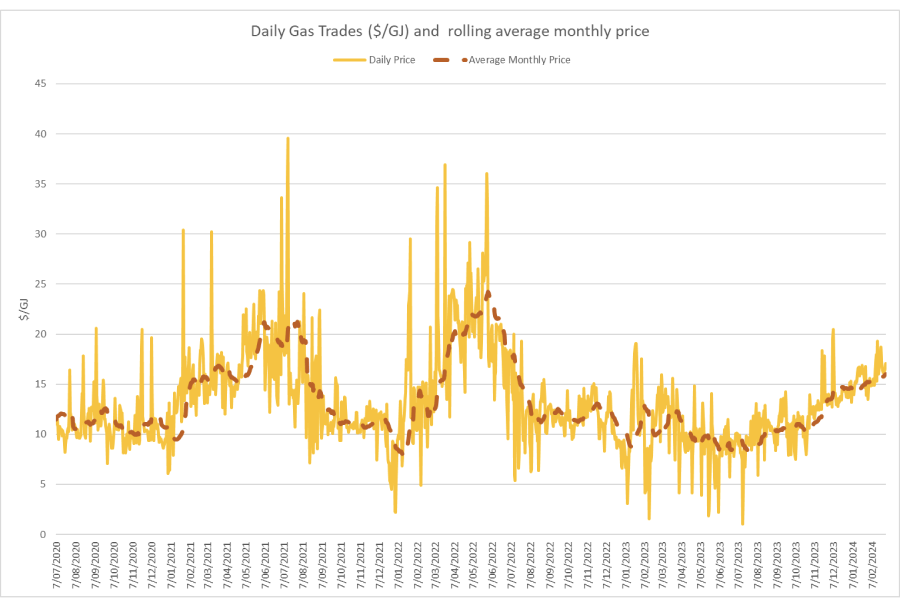
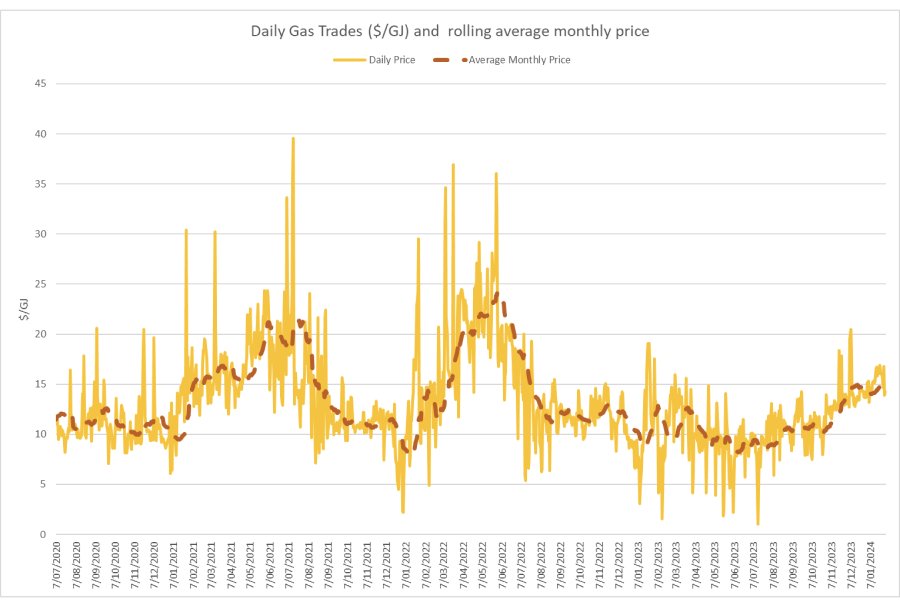
Spot gas prices remained at the very high levels seen in May, averaging $28.6/GJ for June. Wholesale prices are 227% higher than they were at the same time last year.
We have seen signs that gas retailers are refusing to offer contracts to end users even where they are the incumbent retailer. Some tenders are getting no offers at all from retailers.
The Government has set up a body, the Gas Security Response Group, to “coordinate a response to reports of an increasingly tight gas supply from the GIC and the broader gas sector. It will verify gas supply and demand and identify actions to address the situation.” It will be interesting to see what they come up with, however it is difficult to see what they can do in the short term apart from reducing supply to some large gas users to free up supply for others.
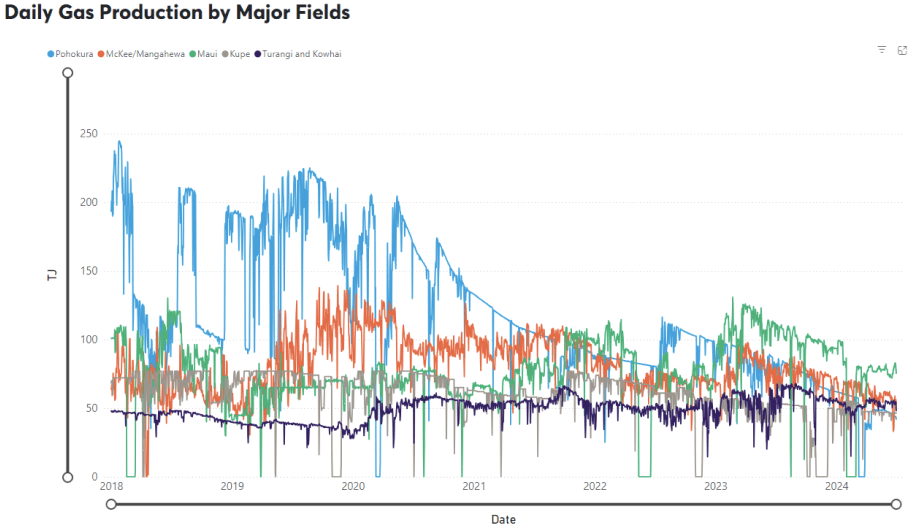
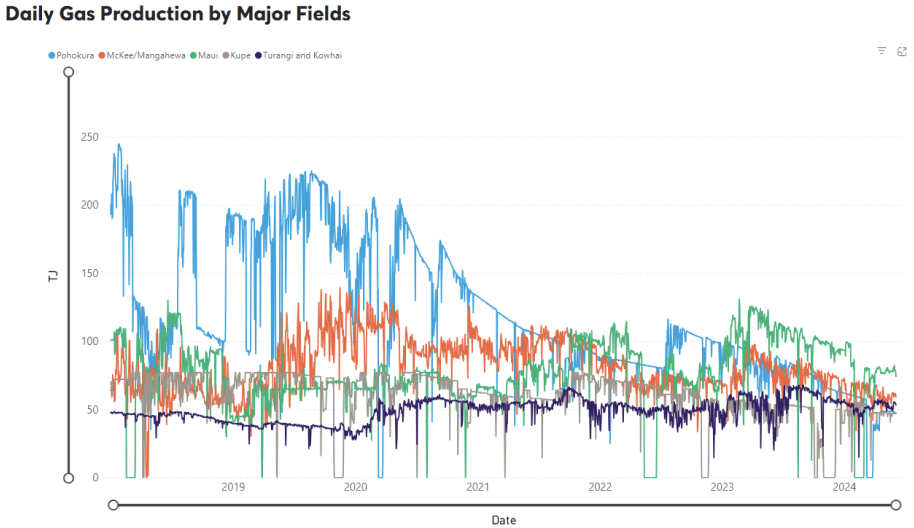
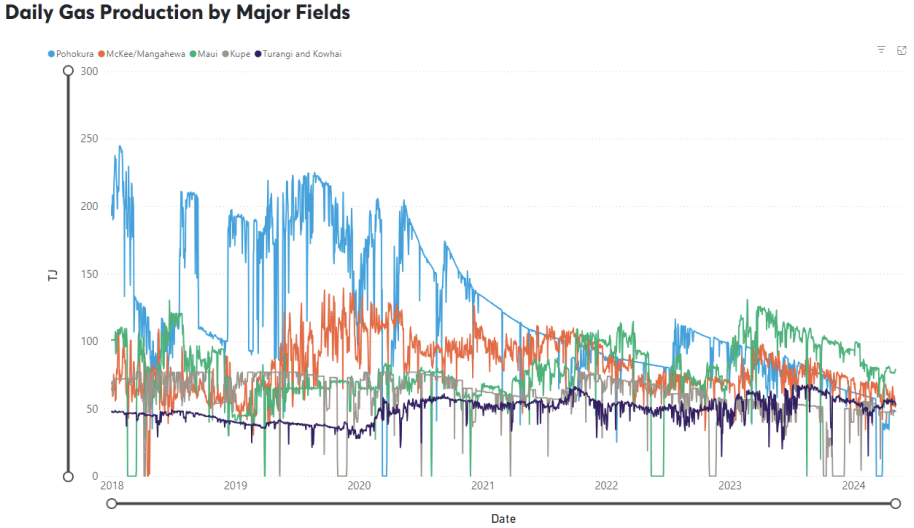
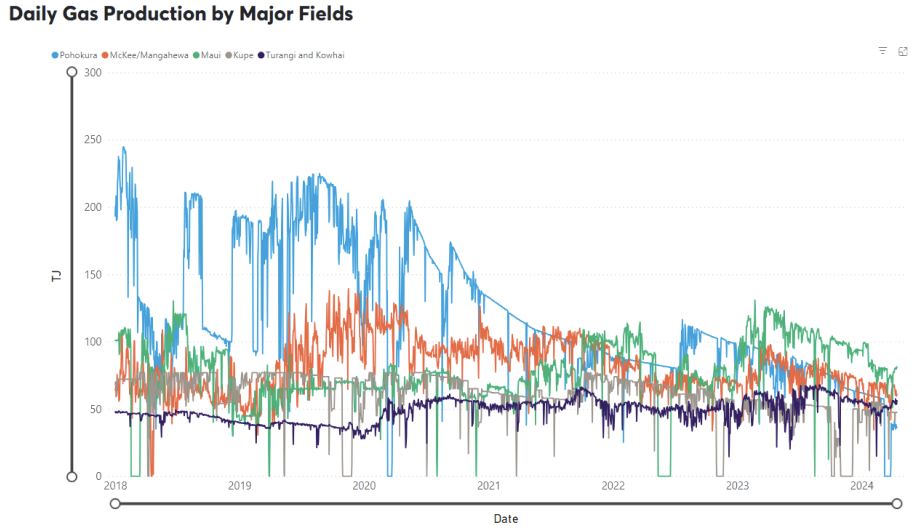
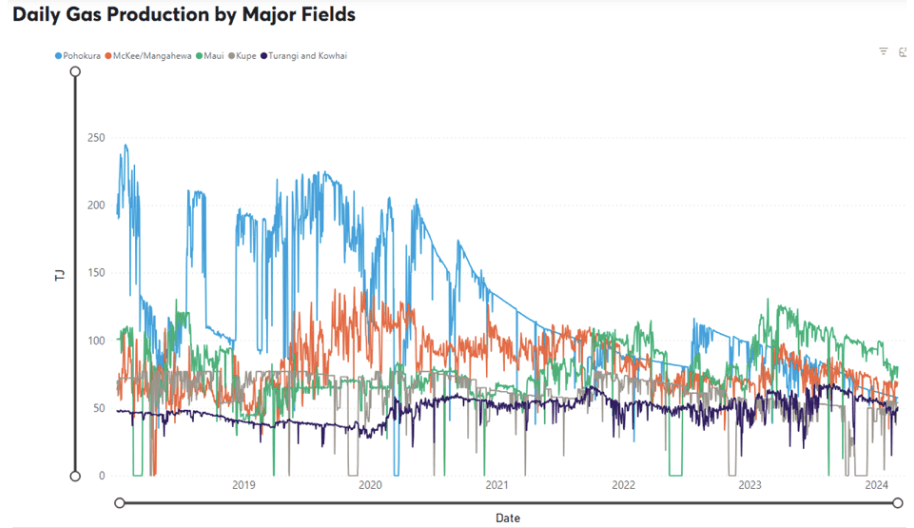
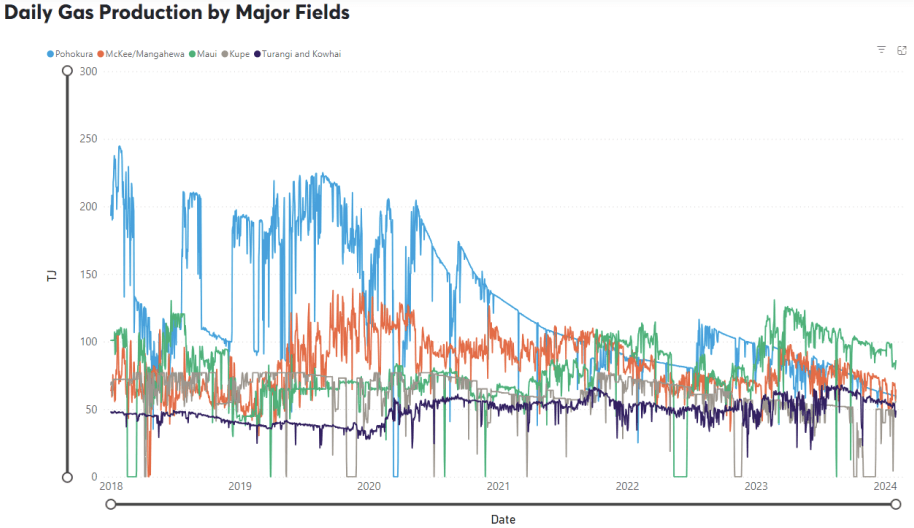
On the supply side all fields showed a continuation of a gradual decline in production from already low levels. Pohokura started the month producing around 48TJ/day, reducing to 42TJ by the end of the month. Maui averaged around 76.5TJ/day – down 2.5%. McKee / Mangahewa averaged 55TJ per day, down from 60 in May. Kupe also dropped slightly from 47TJ per day down to 46.5.
The following graph shows production levels from major fields over the last 6 years.
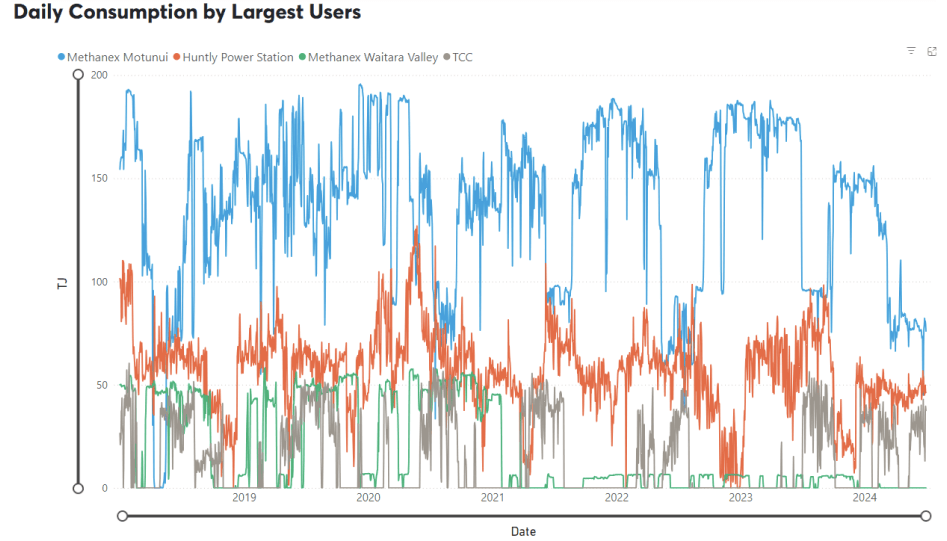
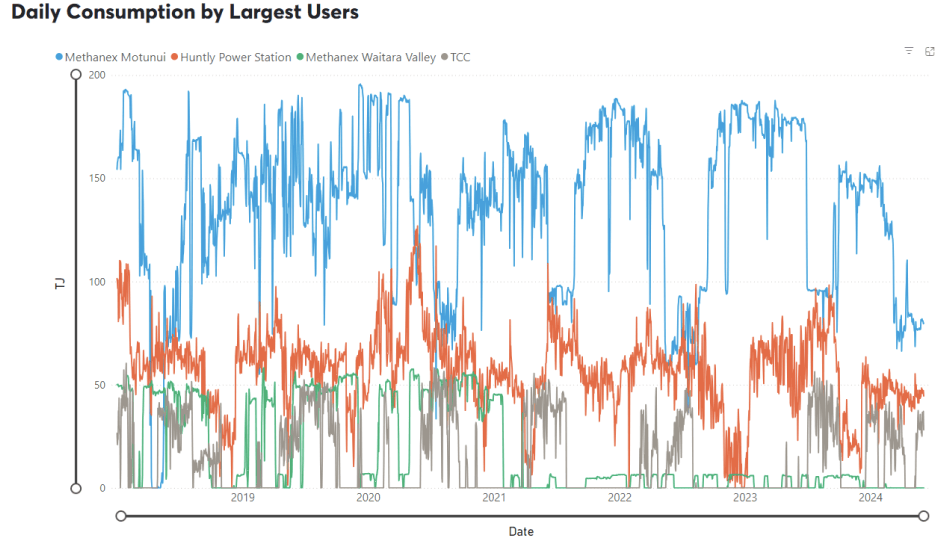
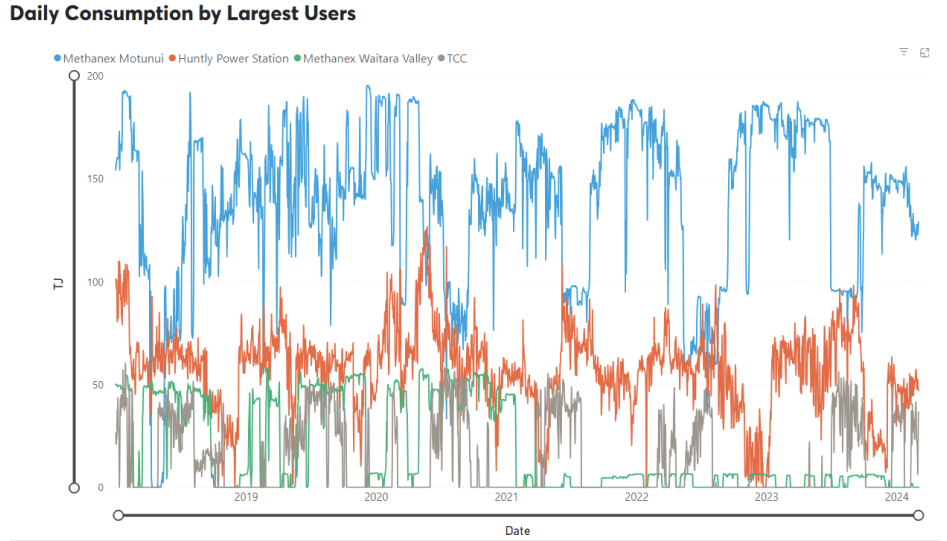
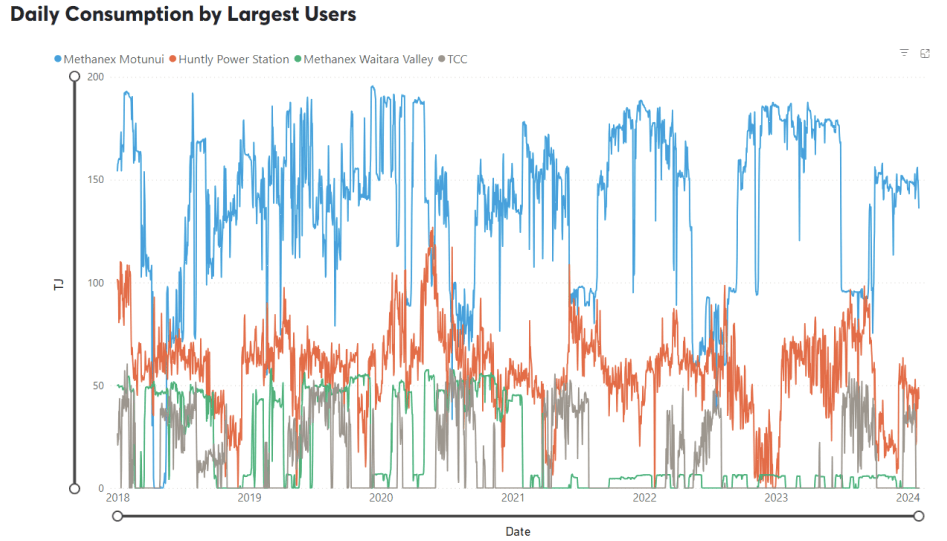
On the demand side, Methanex Motonui’s usage remained at the lower levels experienced in recent months providing the buffer for the reduced supply. Usage averaged close to 75TJ/day through June – down from 80TJ/day in May. Huntly power station increased marginally, averaging 48TJ/day, while TCC ran all month, averaging close to 30TJ per day.
The following graph shows trends in the major gas users over the last 6 years.
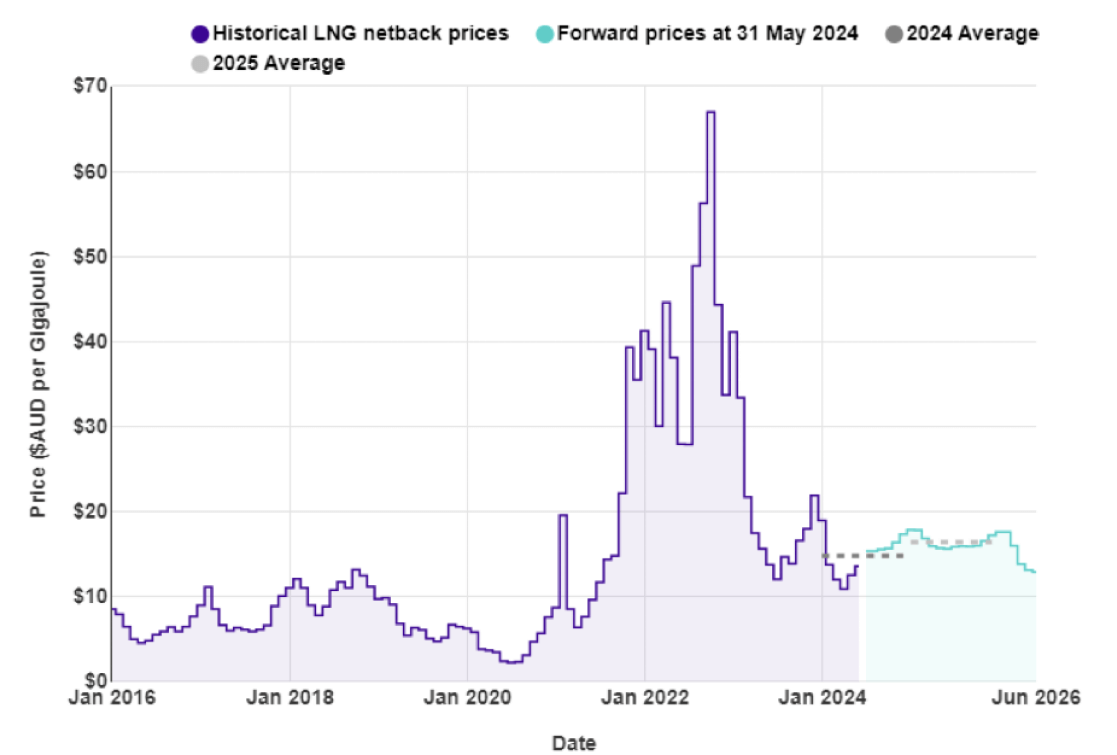
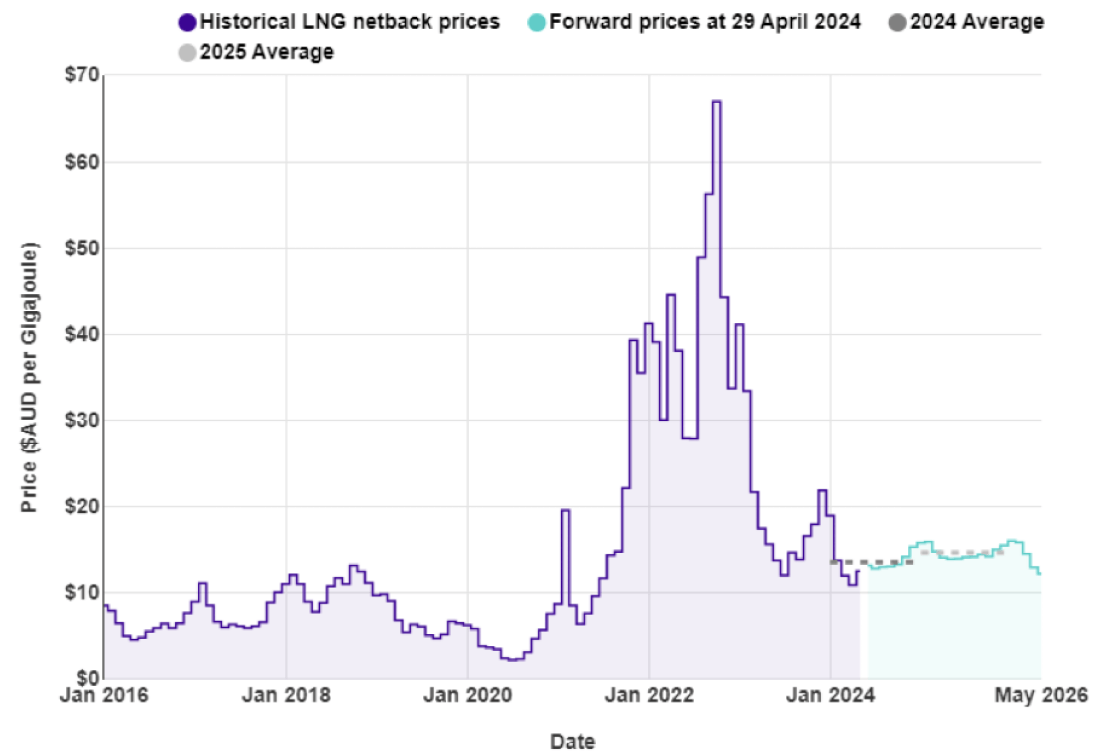
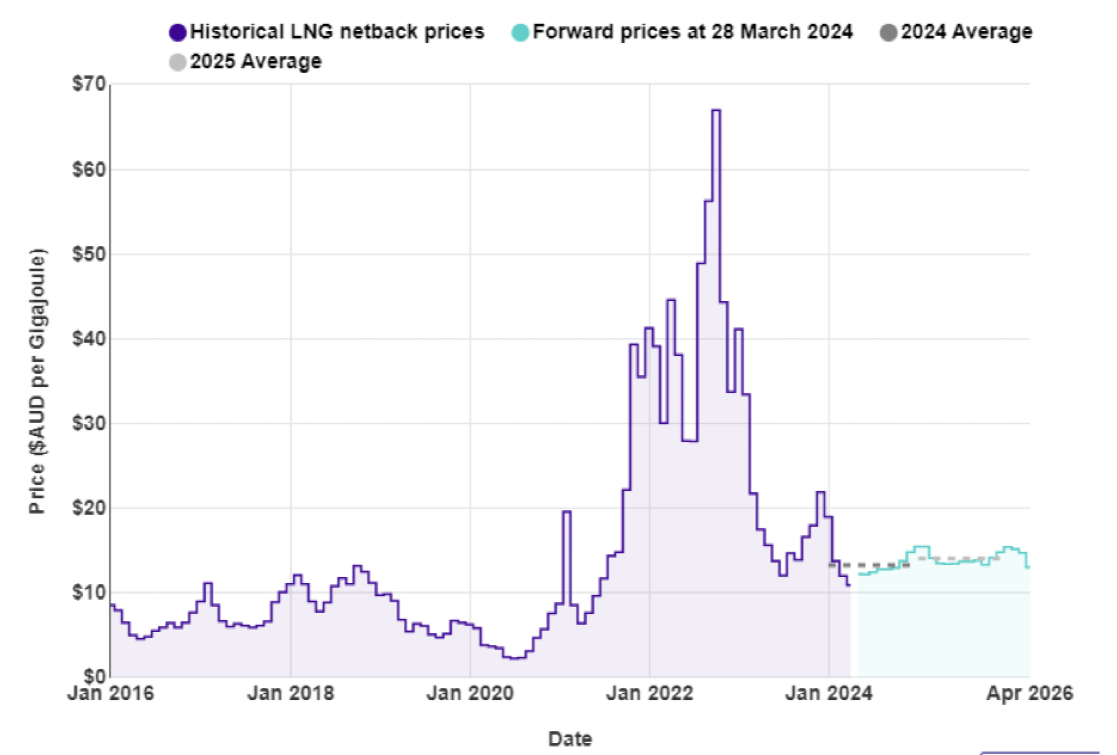
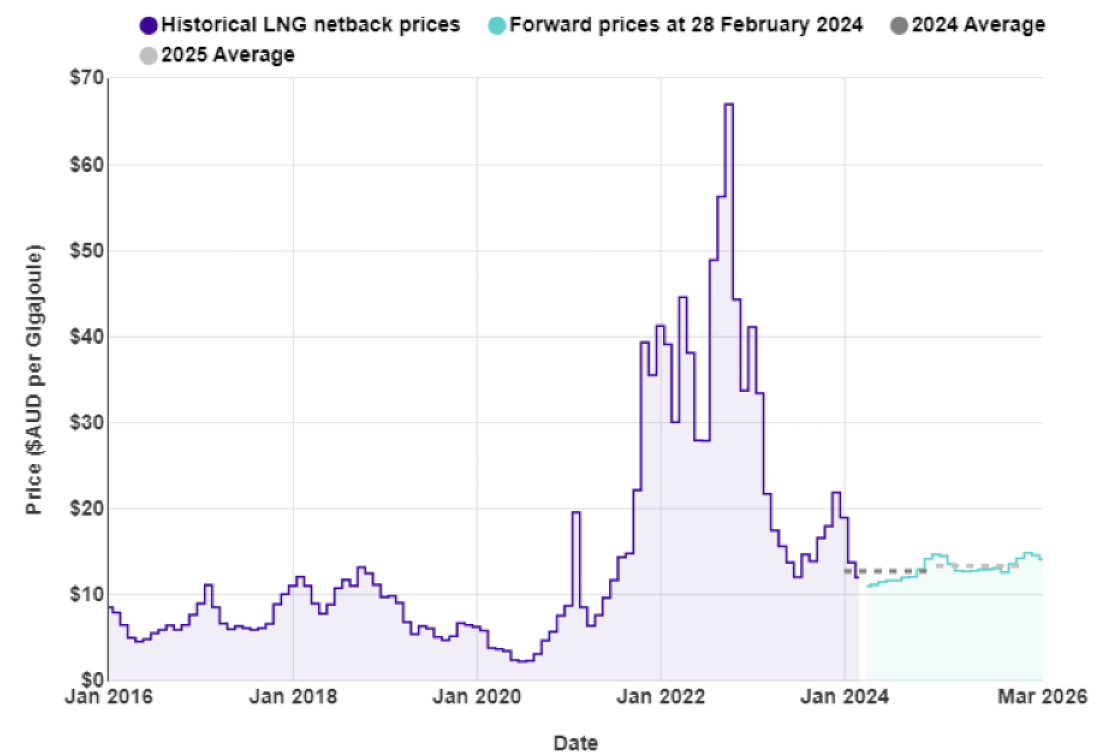
Internationally, LNG netback prices ended the month at $15.56/GJ – up 14% from last month. Forecast prices for 2024 increased to $14.95 – up 1% compared to May. Forecast prices for 2025 were also up marginally at $16.57/GJ.
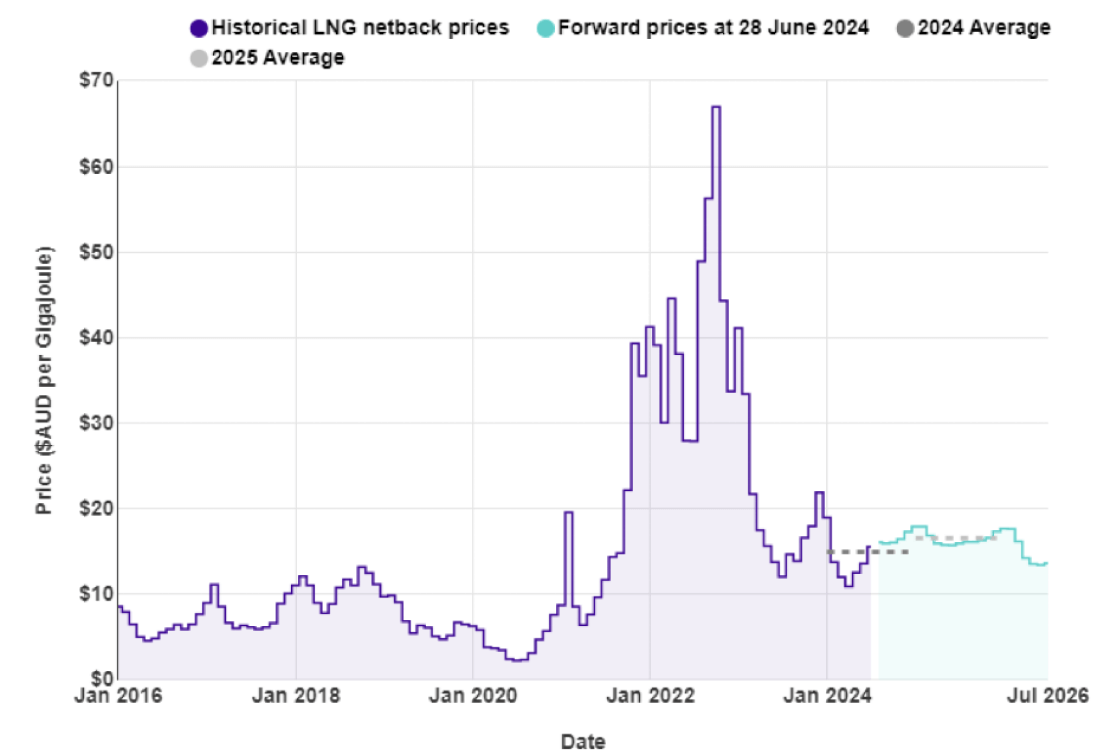
New Zealand does not have an LNG export market, so our domestic prices are not directly linked to global prices.
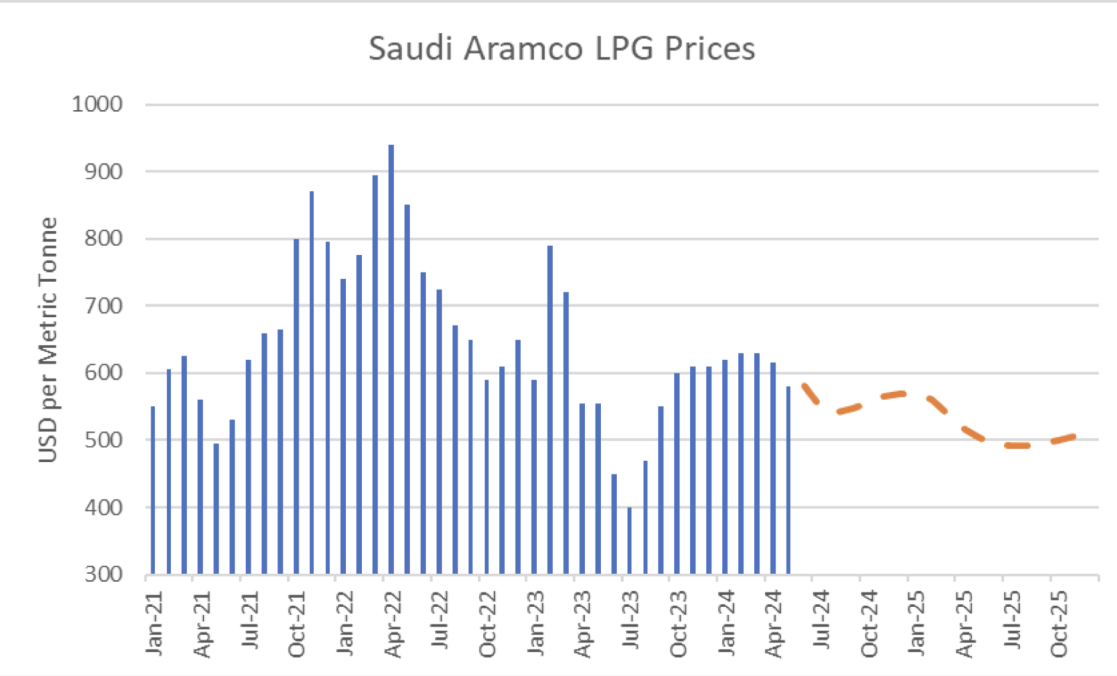
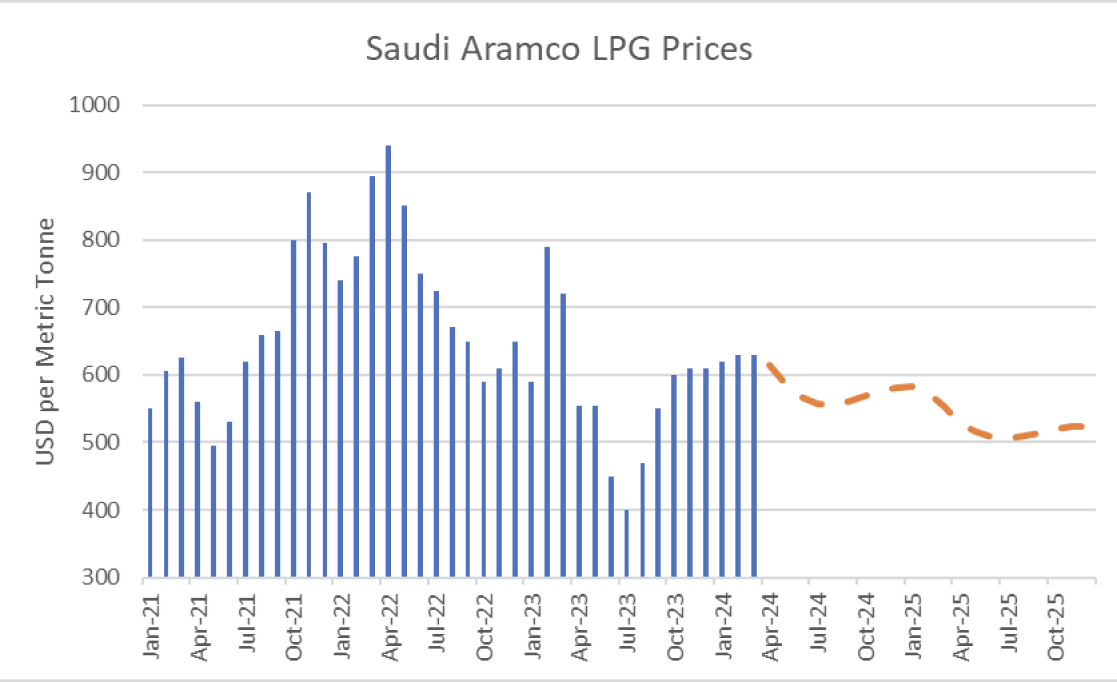
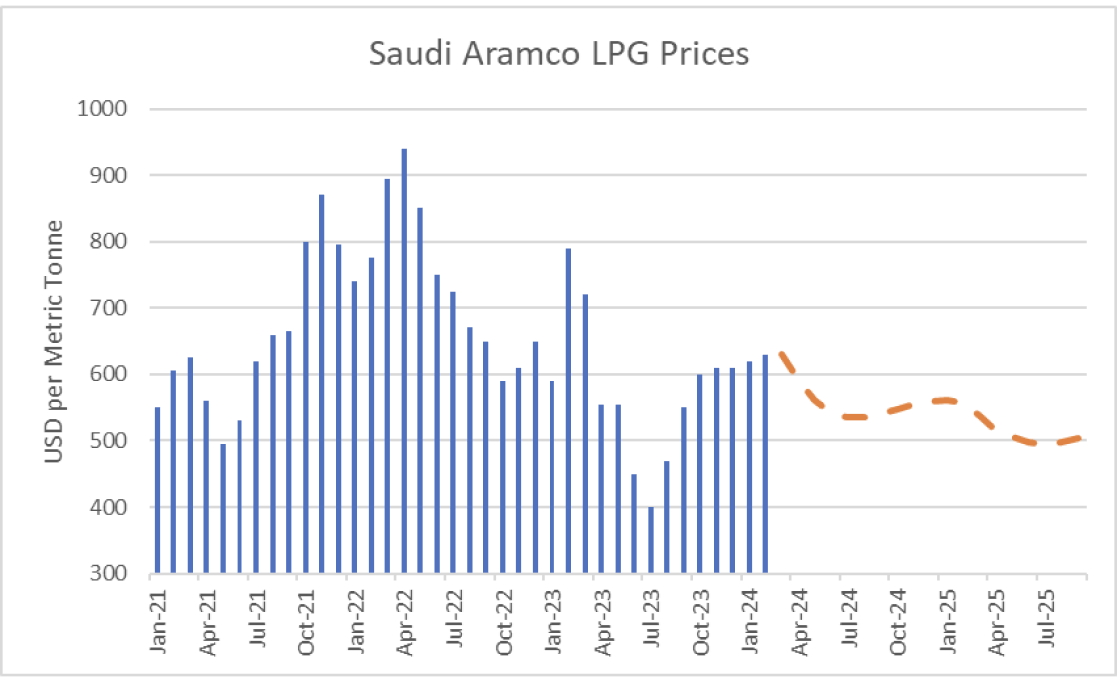
LPG is an important fuel for many large energy users, particularly in areas where reticulated natural gas is not available. The contract price of LPG is typically set by international benchmarks such as the Saudi Aramco LPG – normally quoted in US$ per metric tonne.
The following graph shows the Saudi Aramco LPG pricing for the last 3 years as well as forecast pricing for the year ahead. There has been a significant increase in futures pricing over the last month.
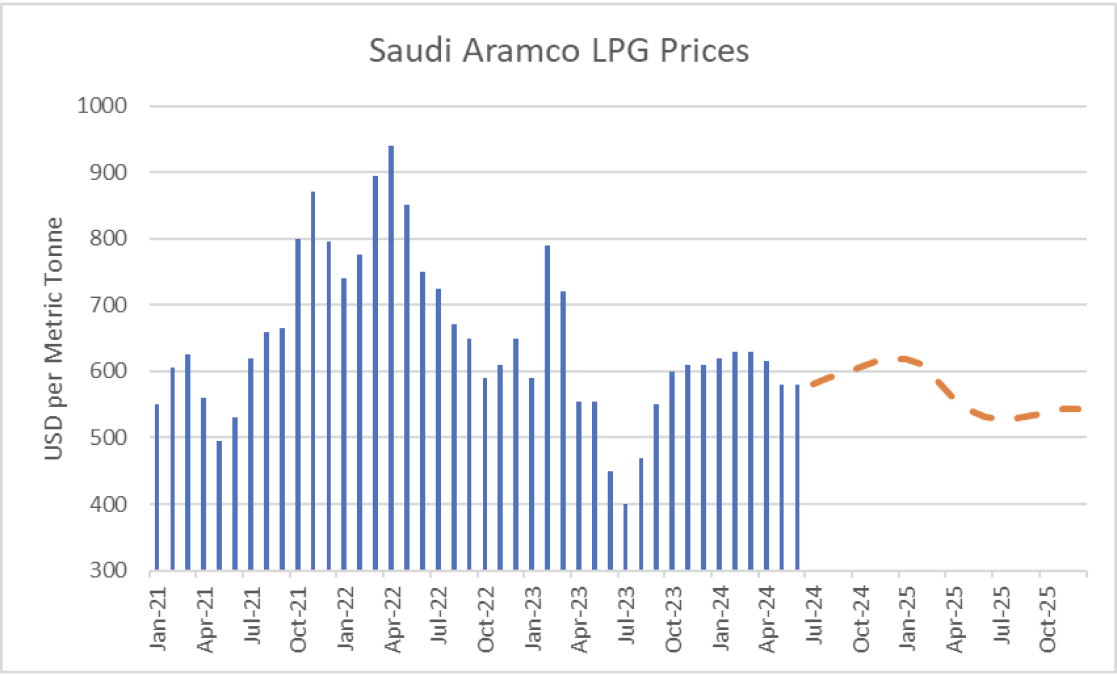
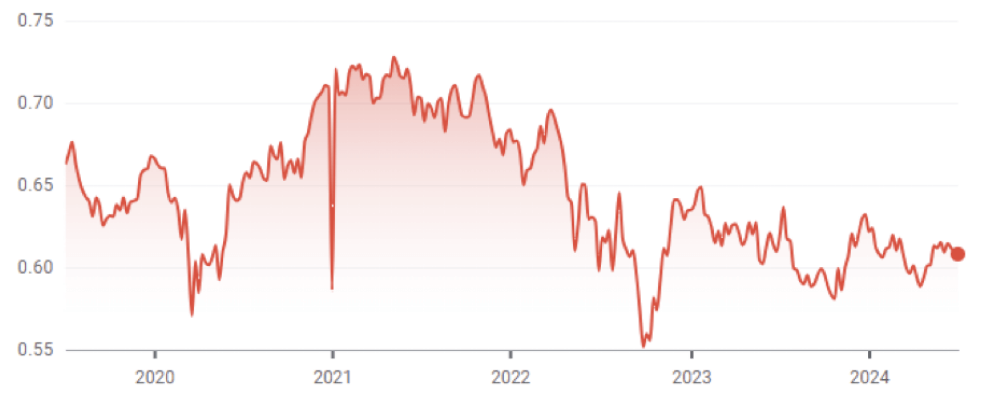
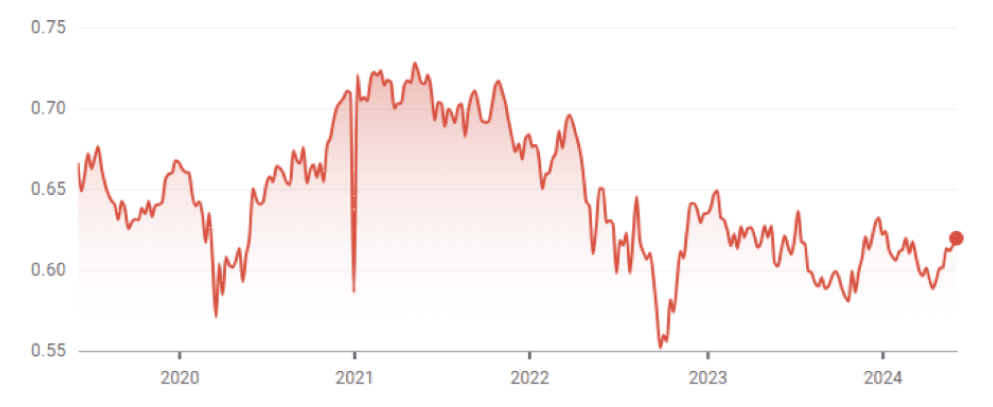
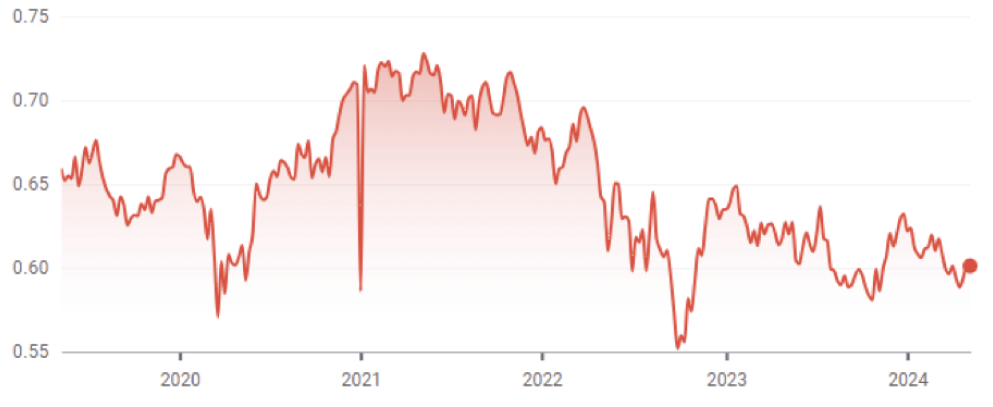
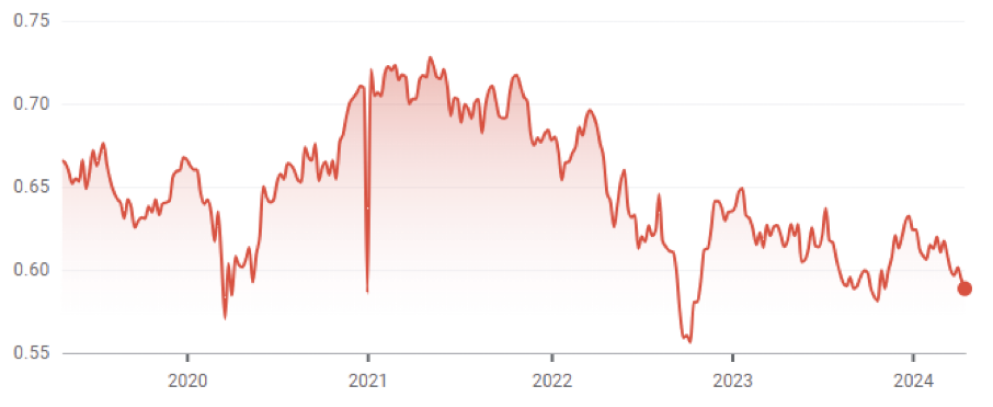
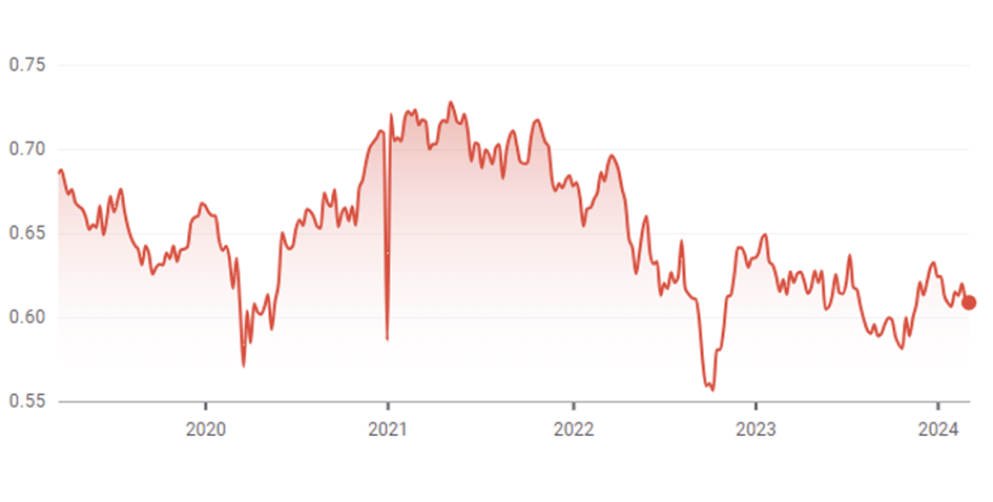
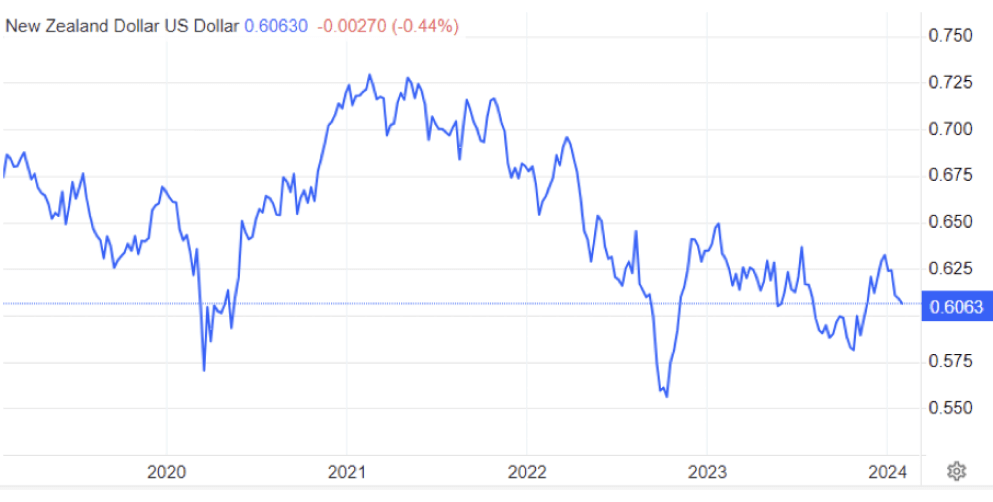
The other main contributing factor to LPG prices in New Zealand is the exchange rate against the USD. As shown below this has been falling over the last few years adding to domestic LPG prices.
The Coal Market
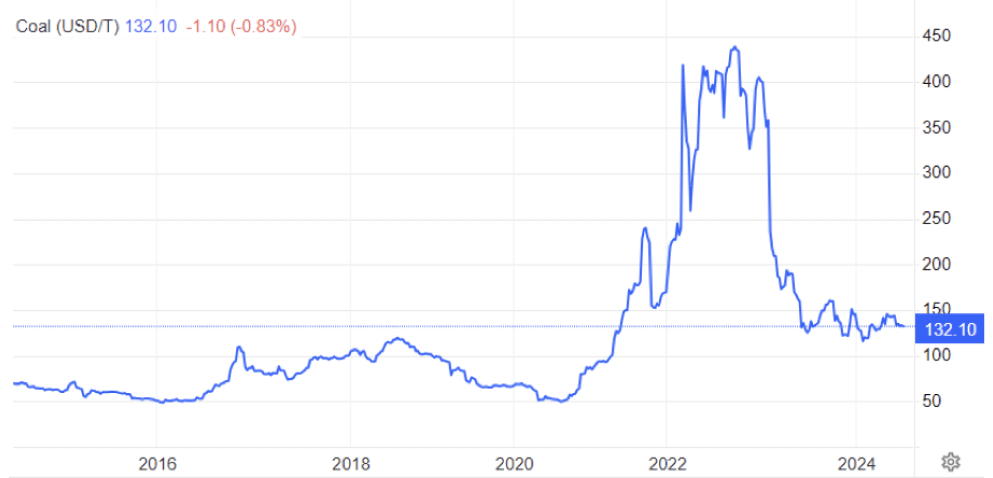
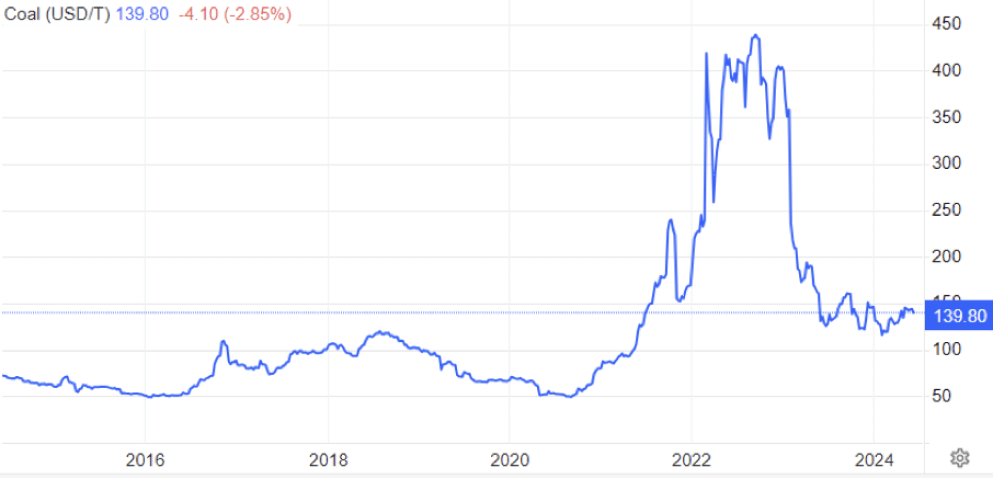
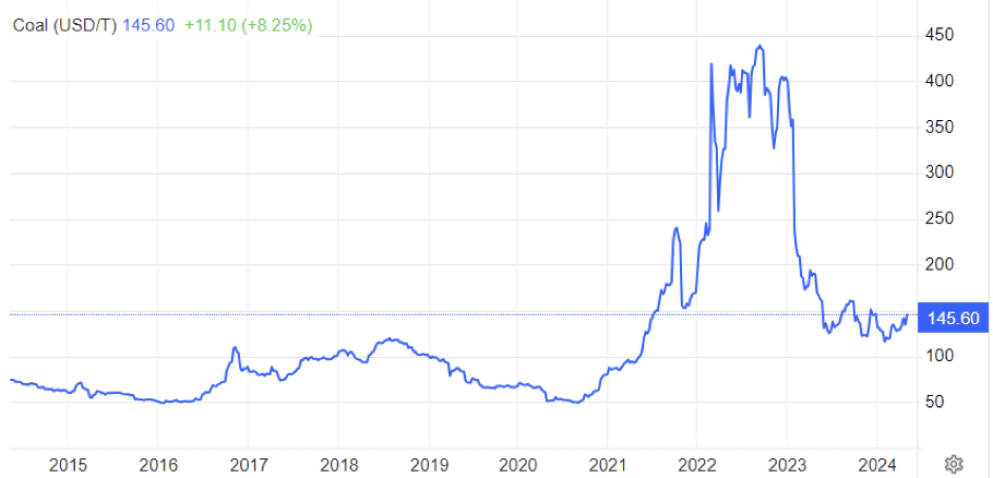
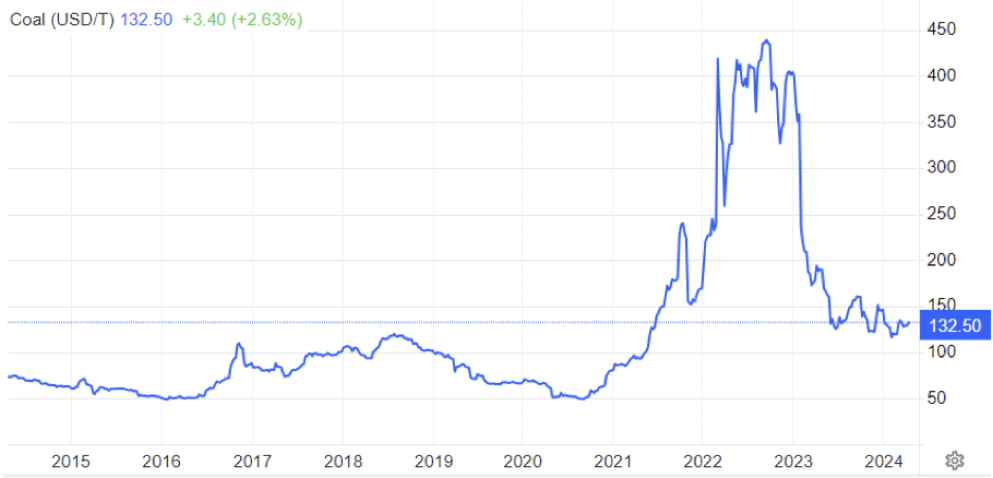
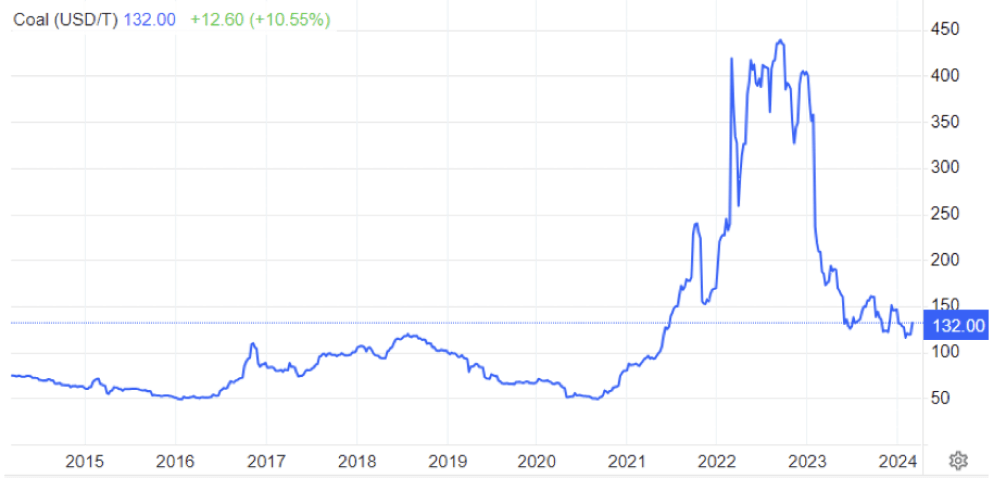
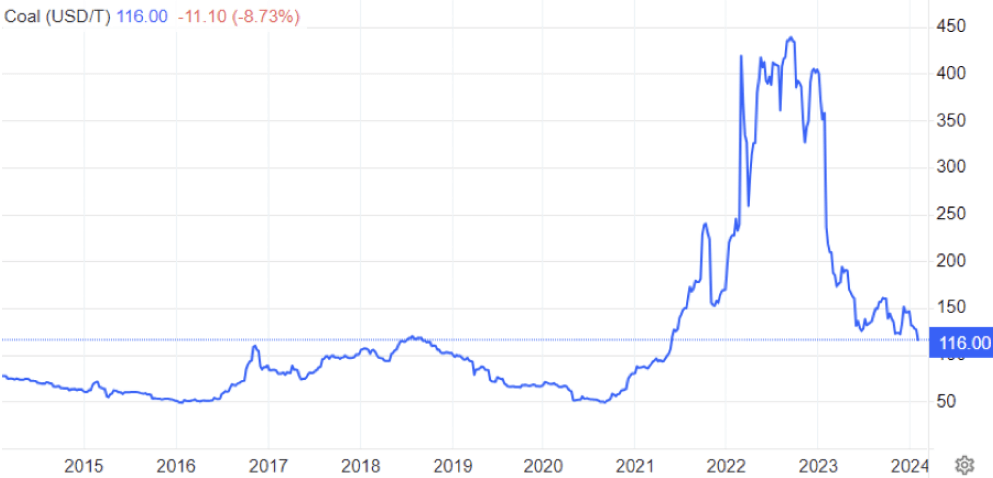
The global energy crisis has been as much about coal as it has gas. The war in the Ukraine has driven energy prices, including coal, up. Prices in June were down, ending the month at US$132/T – an 8% decrease on the May close. These prices are finally returning to levels close to what we expect to see as shown in the following graph of prices over the last 10 years.
Like gas, the price of coal can flow through and have an impact on the electricity market. In April, Genesis reported that coal stockpiles had been reducing over the last couple of years. The Huntly coal stockpile held 624,000 tonnes as at 31 March 2024, down from 731,000 tonnes at 31 December 2023, 859,000 tonnes at 30 September 2023, and 968,000 tonnes a year earlier.
Carbon Pricing
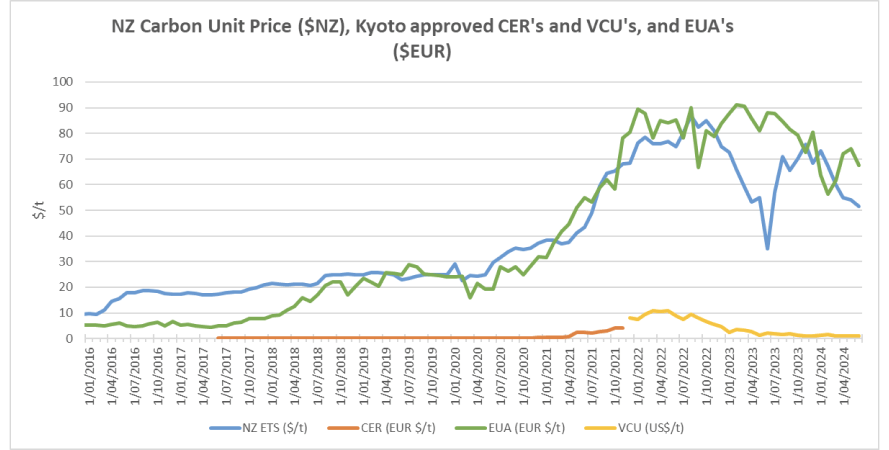
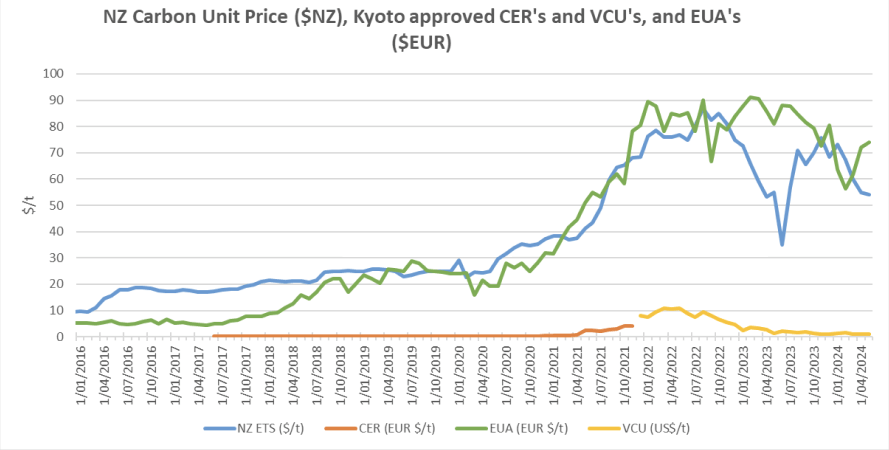
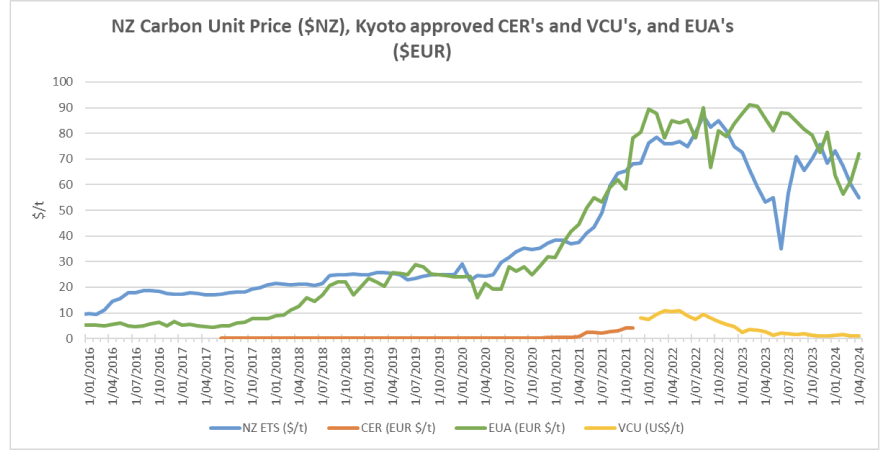
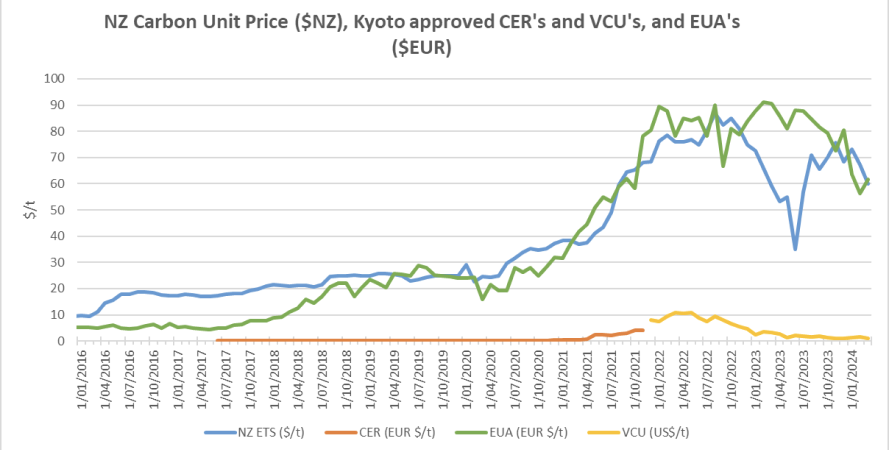
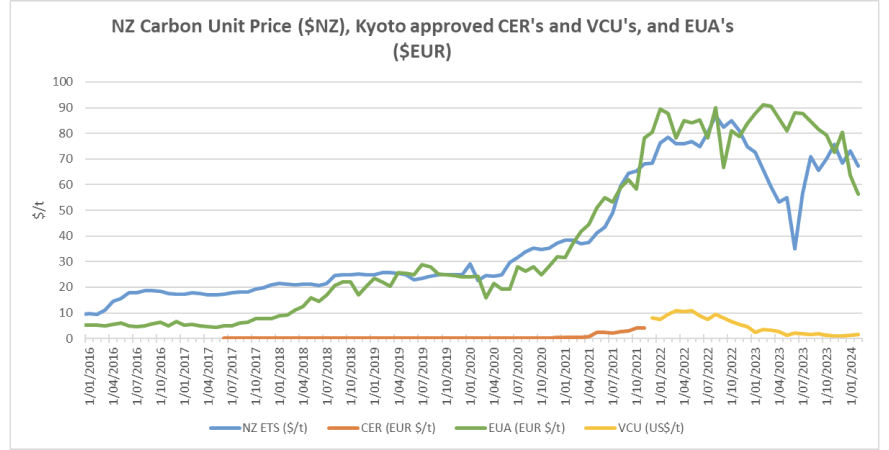
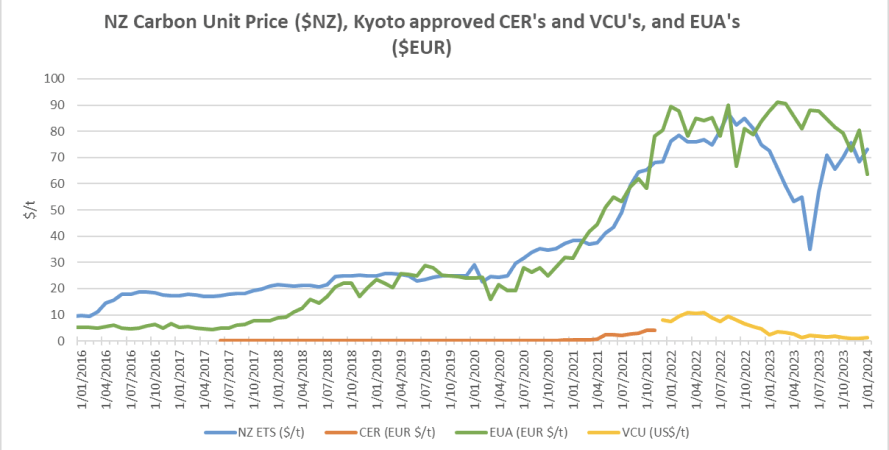
NZ has had an Emissions Trading Scheme (ETS) in place since 2008. It has been subsequently reviewed by several governments and is now an “uncapped” price scheme closely linked to international schemes. However, there are “upper and lower guard-rails” set up to prevent wild swings in carbon price that act as minimum and maximum prices. These increased in December 2023 to $173 and $64 respectively. Carbon prices decreased a further 4% in June to $51.6.
As the carbon price rises, the cost of coal, gas or other fossil fuels used in process heat applications will naturally also rise. Electricity prices are also affected by a rising carbon price. Electricity prices are set by the marginal producing unit – in NZ this is currently typically coal or gas or hydro generators, with the latter valuing the cost of its water against the former. An increase in carbon price can lead to an increase in electricity prices in the short to medium term (as the marginal units set the price). A carbon price of $50/t is estimated to currently add about $25/MWh (or ~2.5c/kWh) to electricity prices. In the long term the impact should reduce as money is invested in more low-cost renewables and there is less reliance on gas and coal fired generation.
EU Carbon Permits decreased in June to 67.5 Euro/tonne – down 9%.
About this Report
This energy market summary report provides information on wholesale price trends within the NZ Electricity Market.
Please note that all electricity prices are presented as a $ per MWh price and all carbon prices as a $ per unit price.
All spot prices are published by the Electricity Authority. Futures contract prices are sourced from ASX.
Further information can be found at the locations noted below.
- Transpower publishes a range of detailed information which can be found here: https://www.transpower.co.nz/power-system-live-data
- The Electricity Authority publishes a range of detailed information which can be found here: https://www.emi.ea.govt.nz/
- Weather and Climate data – The MetService publishes a range of weather-related information which can be found here: https://www.metservice.com/
Disclaimer
This document has been prepared for information and explanatory purposes only and is not intended to be relied upon by any person. This document does not form part of any existing or future contract or agreement between us. We make no representation, assurance, or guarantee as to the accuracy of the information provided. To the maximum extent permitted by law, none of Smart Power Ltd, its related companies, directors, employees or agents accepts any liability for any loss arising from the use of this document or its contents or otherwise arising out or, or in connection with it. You must not provide this document or any information contained in it to any third party without our prior consent.
About Smart Power
Smart Power is a full-service Energy Management consultancy. Apart from Energy Procurement, Smart Power can also provide:
- Technical Advice on how to reduce your energy use/emissions
- Sustainability Reporting
- Invoice Management services.
We also offer boutique energy and water billing service for landlords/property developers.
Contact us at https://smartpower1.wpenginepowered.com/contact/ or ring one of our offices to talk to one of our experienced staff about how we can assist you with achieving your energy goals.
© Copyright, 2024. Smart Power Ltd
Market Update May 2024
The Wholesale Electricity Market
Spot prices in the wholesale electricity increased again in May from their already very high levels. Average spot prices ranged from $285 in the lower South Island (up from $211 in March), up to $312 in the upper South Island (up from $230).
The following chart shows average weekly spot prices over the last 2 years. The high peak in the middle of the month is greater than any time in the last 10 years (on a rolling 7-day basis).
Electricity Demand
Electricity demand through May remained above levels seen in recent years as shown below. There also appears to be an early seasonal increase due to cooler weather, with May being the coldest in NZ since 2009.
Electricity Generation Mix
Through May the increased demand was largely picked up by thermal generation. An increase in wind and geothermal generation also allowed hydro generation to back off.
HVDC Transfer
Power transfers on the HVDC link connecting the North and South Islands are important both in showing relative hydro positions and the reliance on thermal power to meet demand. High northward flow tends to indicate a good SI hydro position, whereas the reverse indicates a heavy reliance on thermal power to make up for hydro shortages.
May saw attempts to conserve South Island storage by reducing northward transfer and increasing southward transfer.
The Electricity Futures Market
The Futures Market provides an indication of where market participants see the spot market moving in the future. They are based on actual trades between participants looking to hedge their positions (as both buyers and sellers) into the future against potential spot market volatility. They are also a useful proxy for the direction of retail contracts.
The following graph shows Futures pricing for CY 2024, 2025, 2026 and 2027 at Otahuhu (Auckland) for the last 2 years.
Note that $100/MWh equates to 10c/kWh.
Forward prices were down in May for all future years except CY 2027. CY 2025 ended the month down 3% at $182. CY 2026 price was down 5% at $157 while CY 2027 closed up marginally at $149/MWh (+0.3%).
From a demand perspective, at the end of May it was announced that 20-year electricity supply contracts had been signed with New Zealand Aluminium Smelters, providing certainty to the market that the largest load in NZ will remain after the current contracts expire this year. This should now provide the confidence to get a large number of muted projects committed, and hopefully see some longer term electricity price reductions.
Known new generation projects are shown below (additions / removals / changes highlighted in bold).
Hydro Storage
Inflows were very low in the South Island during May – reported as the second lowest in 90 years of data. The North Island had below average inflows at the start of the month, however they picked up later to almost end up at average levels for the month.
Very low inflows resulted in energy storage levels plummeting in May. NZ storage ended the month at 2,601GWh or 58% full, down 835GWh. The following chart shows the latest breakdown of storage across the main hydro catchments.
Security of supply risks increased significantly in May with storage levels decreasing. This is shown in the following risk curves.
Snowpack
Snowpack is an important way that hydro energy is stored over the winter months and released as hydro inflows in the spring. The following graph shows that the snowpack in the important Waitaki catchment is currently close to the minimum levels seen in the last 30 years for this time of year.
Climate outlook overview (from the MetService)
Climate Drivers — The El Niño Southern Oscillation (ENSO) is now in neutral territory and should remain so throughout winter. Whilst our 23-24 El Niño event has had a definitive say on our weather maps since March, its influence is now expected to wane as short-term variability takes the lead during the winter months.
This, combined with cooler than normal sea surface temperatures around and south of New Zealand (again, very different to last year), is likely to drive a fairly typical winter season as a whole, with lots of variability, plenty of cold snaps and seasonal rainfall and temperature patterns not departing too far from long term climate averages.
This might not seem like a very bold prediction, but following on from 4 of the 5 warmest winters NZ has seen since winter 2020, and the wettest winter on record in 2022, just seeing typical winter weather may come as quite a shock to the system! Of course, this doesn’t mean we won’t see departures from normal at a regional level across the country, especially month-to-month, but over the whole season we can expect things to feel different to the winters of recent years which were set against a prolonged La Niña event.
There remains a heightened chance that another phase of La Niña will develop this spring, but its strength and effects on NZ remain far from certain and would likely only become influential over summer.
June 2024 Outlook — After a cold Autumn, we start winter on a milder note with the opening half of the month seeing some warmer northwest to northerly airmasses affect the country. At this time of the year these can often be accompanied by broad rain-bearing weather systems moving out of the Tasman Sea, and as we head into the later parts of this week (beginning Mon 3rd) through mid-month a number of these systems could bring bouts of rainfall quite widely, with the heaviest falls favoured around North Island and upper South Island. Portions of the lower South Island, Westland and Fiordland in particular, are expected to see a much drier start to the month than normal, but there is a chance of warm NW rain before mid-month here too.
These weather patterns can also bring very windy spells east of the South Island main divide, and across central NZ. As always as this time of year, watch for when low pressure systems exit eastwards into the Pacific Ocean for any significant snow or cold weather. There remains lots of uncertainty with rainfall and wind details with these systems before mid-month at this stage, and it will pay to keep up to date with your latest forecast at metservice.com.
The second half of the month should see increased potential for multi-day runs of cold, clear and dry weather with higher pressure favoured to become more influential right across NZ. SW winds would be the order of the day, and the North Island should see a drier second half of the month, whilst western areas of South Island see more typical, changeable weather roll through by months end.
So, temperatures should end up near normal, or even slightly cooler than normal, for the month as a whole with colder weather increasingly likely during the second half of the month. Much more uncertainty around rainfall patterns with lots of day-today variability, but a wetter than normal spell before mid-month for North Island, especially the eastern half, drives a wet anomaly here around Bay of Plenty, Gisborne and the Hawkes Bay. Drier than normal conditions are forecast for western South Island, Otago and Southland, but less confidence in this aspect of the forecast where much could depend on just one heavy rain event before mid-month. The rest of the country should see near-normal rainfall this June.
The Wholesale Gas Market
Spot gas prices increased significantly again in May averaging $28.65/GJ – up 31% in the month. Wholesale prices are now 208% higher than they were at the same time last year.
We have seen signs that gas retailers are refusing to offer contracts to end users even where they are the incumbent retailer. Some tenders are getting no offers at all from retailers.
The Government has set up a body, the Gas Security Response Group, to “coordinate a response to reports of an increasingly tight gas supply from the GIC and the broader gas sector. It will verify gas supply and demand and identify actions to address the situation.” It will be interesting to see what they come up with, however it is difficult to see what they can do in the short term apart from reducing supply to some large gas users to free up supply for others.
On the supply side there was very little change in output over the month – still at a low level compared to historical levels. Pohokura maintained output at just below 50TJ/day – still below the pre-shutdown output of 57TJ per day. Maui held output through the month at around 78.5TJ/day. McKee / Mangahewa averaged slightly below 60TJ per day across the month. Kupe also maintained output at 47TJ per day.
The following graph shows production levels from major fields over the last 6 years.
On the demand side, Methanex Motonui’s usage remained at the lower levels experienced in April providing the buffer for the reduced supply. Usage averaged close to 80TJ/day through May. Huntly power station increased marginally, averaging 44.5TJ/day, while TCC restarted midway through the month, averaging close to 30TJ per day once running.
The following graph shows trends in the major gas users over the last 6 years.
Internationally, LNG netback prices ended the month at $13.62/GJ – up 8% from last month. Forecast prices for 2024 increased to $14.81 – up 9% compared to April. Forecast prices for 2025 were also up 12% at $16.46/GJ.
New Zealand does not have an LNG export market, so our domestic prices are not directly linked to global prices.
LPG is an important fuel for many large energy users, particularly in areas where reticulated natural gas is not available. The contract price of LPG is typically set by international benchmarks such as the Saudi Aramco LPG – normally quoted in US$ per metric tonne.
The following graph shows the Saudi Aramco LPG pricing for the last 3 years as well as forecast pricing for the year ahead.
The other main contributing factor to LPG prices in New Zealand is the exchange rate against the USD. As shown below this has been falling over the last few years adding to domestic LPG prices.
The Coal Market
The global energy crisis has been as much about coal as it has gas. The war in the Ukraine has driven energy prices, including coal, up. Prices in May were largely flat, ending the month at US$143/T – a 1% decrease on the April close. These prices are finally returning to levels close to what we expect to see as shown in the following graph of prices over the last 10 years.
Like gas, the price of coal can flow through and have an impact on the electricity market. In April, Genesis reported that coal stockpiles had been reducing over the last couple of years. The Huntly coal stockpile held 624,000 tonnes as at 31 March 2024, down from 731,000 tonnes at 31 December 2023, 859,000 tonnes at 30 September 2023, and 968,000 tonnes a year earlier.
Carbon Pricing
NZ has had an Emissions Trading Scheme (ETS) in place since 2008. It has been subsequently reviewed by several governments and is now an “uncapped” price scheme closely linked to international schemes. However, there are “upper and lower guard-rails” set up to prevent wild swings in carbon price that act as minimum and maximum prices. These increased in December 2023 to $173 and $64 respectively. Carbon prices decreased a further 2% in May to $54.
As the carbon price rises, the cost of coal, gas or other fossil fuels used in process heat applications will naturally also rise. Electricity prices are also affected by a rising carbon price. Electricity prices are set by the marginal producing unit – in NZ this is currently typically coal or gas or hydro generators, with the latter valuing the cost of its water against the former. An increase in carbon price can lead to an increase in electricity prices in the short to medium term (as the marginal units set the price). A carbon price of $50/t is estimated to currently add about $25/MWh (or ~2.5c/kWh) to electricity prices. In the long term the impact should reduce as money is invested in more low-cost renewables and there is less reliance on gas and coal fired generation.
EU Carbon Permits increased in May to 74.1 Euro/tonne – up 3%.
About this Report
This energy market summary report provides information on wholesale price trends within the NZ Electricity Market.
Please note that all electricity prices are presented as a $ per MWh price and all carbon prices as a $ per unit price.
All spot prices are published by the Electricity Authority. Futures contract prices are sourced from ASX.
Further information can be found at the locations noted below.
- Transpower publishes a range of detailed information which can be found here: https://www.transpower.co.nz/power-system-live-data
- The Electricity Authority publishes a range of detailed information which can be found here: https://www.emi.ea.govt.nz/
- Weather and Climate data – The MetService publishes a range of weather-related information which can be found here: https://www.metservice.com/
Disclaimer
This document has been prepared for information and explanatory purposes only and is not intended to be relied upon by any person. This document does not form part of any existing or future contract or agreement between us. We make no representation, assurance, or guarantee as to the accuracy of the information provided. To the maximum extent permitted by law, none of Smart Power Ltd, its related companies, directors, employees or agents accepts any liability for any loss arising from the use of this document or its contents or otherwise arising out or, or in connection with it. You must not provide this document or any information contained in it to any third party without our prior consent.
About Smart Power
Smart Power is a full-service Energy Management consultancy. Apart from Energy Procurement, Smart Power can also provide:
- Technical Advice on how to reduce your energy use/emissions
- Sustainability Reporting
- Invoice Management services.
We also offer boutique energy and water billing service for landlords/property developers.
Contact us at https://smartpower1.wpenginepowered.com/contact/ or ring one of our offices to talk to one of our experienced staff about how we can assist you with achieving your energy goals.
© Copyright, 2024. Smart Power Ltd
Market Update April 2024
The Wholesale Electricity Market
Spot prices in the wholesale electricity market remained very high through April. Average spot prices ranged from $211 in the lower South Island (down from $224 in March), up to $232 in the upper North Island (up from $220).
The following chart shows average weekly spot prices over the last 2 years. Prices started the month high, reduced with some high inflows in the middle of the month before climbing again at the end of the month. The recent high prices can be clearly seen to the right of the graph.
Electricity Demand
Electricity demand through April remained above levels seen in recent years as shown below.
Electricity Generation Mix
Through April thermal generation was able to back off slightly with some increased hydro generation.
HVDC Transfer
Power transfers on the HVDC link connecting the North and South Islands are important both in showing relative hydro positions and the reliance on thermal power to meet demand. High northward flow tends to indicate a good SI hydro position, whereas the reverse indicates a heavy reliance on thermal power to make up for hydro shortages.
April saw increased SI inflows allow for more northward transfer while southward transfer decreased to close to zero.
The Electricity Futures Market
The Futures Market provides an indication of where market participants see the spot market moving in the future. They are based on actual trades between participants looking to hedge their positions (as both buyers and sellers) into the future against potential spot market volatility. They are also a useful proxy for the direction of retail contracts.
The following graph shows Futures pricing for CY 2024, 2025, 2026 and 2027 at Otahuhu (Auckland) for the last 2 years.
Note that $100/MWh equates to 10c/kWh.
Forward prices were up again in April for all future years. CY 2025 ended the month up 8% at $188.5. CY 2026 price was up 4% at $166 while CY 2027 closed up marginally at $148.5/MWh (+0.3%).
Known new generation projects are shown below (additions / removals / changes highlighted in bold).
Hydro Storage
Inflows were above average in both islands in April as shown in the following charts. The South Island had a large inflow event in the middle of the month.
Above average April inflows resulted in energy storage levels increasing. NZ storage ended the month at 3,436GWh or 77% full, up 357GWh. The following chart shows the latest breakdown of storage across the main hydro catchments.
Security of supply risks decreased in April with storage levels increasing. This is shown in the following risk curves.
Snowpack
Snowpack is an important way that hydro energy is stored over the winter months and released as hydro inflows in the spring. The following graph shows that the snowpack in the important Waitaki catchment is currently close to the mean levels seen in the last 30 years for this time of year.

Climate outlook overview (from the MetService)
Climate Drivers — Key oceanic markers are now below El Nino thresholds, and as we head towards neutral territory in the central and eastern tropical Pacific Ocean the 23-24 event is drawing to a close. However, it will still have a diminishing say on our weather maps through the rest of Autumn, with the atmosphere and weather often lagging the oceans. This means our enhanced southwest flows of March and April are still expected to be with us for a little while longer. Neutral El Nino Southern Oscillation (ENSO) conditions are expected through Winter, and this would typically see increased variability on our weather maps as shorter-term climate drivers take precedence. There is a growing signal that La Nina will develop into early Spring. Any effects from La Nina are unlikely to be seen until the summer and will be very dependent on its strength, which remains far from certain. The end of April also marks the end of the Southwest Pacific Tropical Cyclone Season. While Tropical Cyclones have been known to form in May in the past, this year the risk is considered Very Low to Low.
May 2024 Outlook — May 2023 was the warmest May on record in New Zealand as northerly airmasses plagued the weather maps, with a widespread marine heatwave in the waters surrounding the country. Fast-forward one year, and one El Nino event, and we are looking at a much-changed picture in the waters around New Zealand, with cool anomalies emerging right around the country and in the Southern Ocean to our south. With the weather maps expected to continue to sing off the Nino hymn sheet for a couple more months yet (albeit increasingly out of tune!) enhanced south-westerly winds are still likely to continue with us throughout May, often dragging in some very cold air from the south. With this air moving over much cooler seas this May than last, cool snaps are likely to have some notable bite to them over the final month of Autumn, making for a very different feel to this time last year. This will especially be the case over the opening fortnight of May where very cold southerly winds will be persistent, as high pressure sits slow-moving west of the South Island. While the odd front will move through, it is likely that our opening cold front on May 1st will bring the best of any rainfall for the majority of the country in the first half of the month. This front saw some very heavy falls for Wellington in particular, where 40-80mm fell in just 12 hours. Lots of dry Autumnal days with crisp sunshine are expected to develop during these opening two weeks, especially across the bulk of South Island, with only really Southland and Clutha tapping into more frequent southerly showers. Whenever winds are brisker, especially on those exposed coasts, woolly hats will be essential! The second half of May sees the axis of highest-pressure shift northwards into the northern Tasman Sea, opening the door to increased volatility and more regular frontal visitors from the west or southwest. This is your standard Autumnal fare, with two or three fronts a week moving quickly across the country, generally fading as they move over the North Island. A few of these fronts could pack a punch in terms of rainfall, especially for western and southern areas of New Zealand, so whilst the umbrellas might gather some dust early in May, it’ll pay to keep them handy from mid-month. With the increased volatility, temperatures should bounce around a bit more with some milder weather a possibility at times.
The Wholesale Gas Market
Spot gas prices increased significantly again in April averaging $21.85/GJ – up 12% in the month. Wholesale prices are now 145% higher than they were at the same time last year.
On the supply side there was a little relief with some increased output from some fields, though still not fully recovering to the levels of a few months ago. Pohokura increased mid-month from 36TJ/day to close to 50TJ/day – still below the pre-shutdown output of 57TJ per day. Maui maintained output through the month at around 77TJ/day. McKee / Mangahewa averaged low 60TJs across the month. Kupe also maintained output at 47.5TJ per day.
The following graph shows production levels from major fields over the last 6 years.
On the demand side, Methanex Motonui’s usage remained at the lower levels experienced in March providing the buffer for the reduced supply. Usage averaged close to 80TJ/day through April. Huntly power station decreased slightly, averaging 43TJ/day, while TCC shut down on the 10th April and remained that way for the rest of the month.
The following graph shows trends in the major gas users over the last 6 years.

Internationally, LNG netback prices ended the month at $12.56/GJ – up 15% from last month. Forecast prices for 2024 increased marginally to $13.62 – up 2% compared to March. Forecast prices for 2025 were also up 4% at $14.71/GJ.
New Zealand does not have an LNG export market, so our domestic prices are not directly linked to global prices. However, some of our large gas users deal in international markets which are impacted by global gas prices, and they may try to produce more in NZ (increase demand) to take advantage of lower gas prices when they occur.
LPG is an important fuel for many large energy users, particularly in areas where reticulated natural gas is not available. The contract price of LPG is typically set by international benchmarks such as the Saudi Aramco LPG – normally quoted in US$ per metric tonne.
The following graph shows the Saudi Aramco LPG pricing for the last 3 years as well as forecast pricing for the year ahead.

The other main contributing factor to LPG prices in New Zealand is the exchange rate against the USD. As shown below this has been falling over the last few years adding to domestic LPG prices.
The Coal Market
The global energy crisis has been as much about coal as it has gas. The war in the Ukraine has driven energy prices, including coal, up. Prices in April were up, ending the month at US$145/T – a 20% increase on the March close. These prices are finally returning to levels close to what we expect to see as shown in the following graph of prices over the last 10 years.
Like gas, the price of coal can flow through and have an impact on the electricity market. Last month Genesis reported that coal stockpiles had been reducing over the last couple of years. The Huntly coal stockpile held 624,000 tonnes at 31 March 2024, down from 731,000 tonnes at 31 December 2023, 859,000 tonnes at 30 September 2023, and 968,000 tonnes a year earlier.
Carbon Pricing
NZ has had an Emissions Trading Scheme (ETS) in place since 2008. It has been subsequently reviewed by several governments and is now an “uncapped” price scheme closely linked to international schemes. However, there are “upper and lower guard-rails” set up to prevent wild swings in carbon price that act as minimum and maximum prices. These increased in December 2023 to $173 and $64 respectively. Carbon prices decreased a further 8% in April to $55.
As the carbon price rises, the cost of coal, gas or other fossil fuels used in process heat applications will naturally also rise. Electricity prices are also affected by a rising carbon price. Electricity prices are set by the marginal producing unit – in NZ this is currently typically coal or gas or hydro generators, with the latter valuing the cost of its water against the former. An increase in carbon price can lead to an increase in electricity prices in the short to medium term (as the marginal units set the price). A carbon price of $50/t is estimated to currently add about $25/MWh (or ~2.5c/kWh) to electricity prices. In the long term the impact should reduce as money is invested in more low-cost renewables and there is less reliance on gas and coal fired generation.
EU Carbon Permits increased in April to 72 Euro/tonne – up 17%.
About this Report
This energy market summary report provides information on wholesale price trends within the NZ Electricity Market.
Please note that all electricity prices are presented as a $ per MWh price and all carbon prices as a $ per unit price.
All spot prices are published by the Electricity Authority. Futures contract prices are sourced from ASX.
Further information can be found at the locations noted below.
- Transpower publishes a range of detailed information which can be found here: https://www.transpower.co.nz/power-system-live-data
- The Electricity Authority publishes a range of detailed information which can be found here: https://www.emi.ea.govt.nz/
- Weather and Climate data – The MetService publishes a range of weather-related information which can be found here: https://www.metservice.com/
Disclaimer
This document has been prepared for information and explanatory purposes only and is not intended to be relied upon by any person. This document does not form part of any existing or future contract or agreement between us. We make no representation, assurance, or guarantee as to the accuracy of the information provided. To the maximum extent permitted by law, none of Smart Power Ltd, its related companies, directors, employees or agents accepts any liability for any loss arising from the use of this document or its contents or otherwise arising out or, or in connection with it. You must not provide this document or any information contained in it to any third party without our prior consent.
About Smart Power
Smart Power is a full-service Energy Management consultancy. Apart from Energy Procurement, Smart Power can also provide:
- Technical Advice on how to reduce your energy use/emissions
- Sustainability Reporting
- Invoice Management services.
We also offer boutique energy and water billing service for landlords/property developers.
Contact us at https://smartpower1.wpenginepowered.com/contact/ or ring one of our offices to talk to one of our experienced staff about how we can assist you with achieving your energy goals.
© Copyright, 2024. Smart Power Ltd
Market Update March 2024
The Wholesale Electricity Market
Spot prices in the wholesale electricity market increased significantly in March. Average spot prices ranged from $211 in the lower North Island (up from $153 in February), up to $245 in the upper South Island (up from $145).
The following chart shows average weekly spot prices over the last 2 years. After a small fall at the start of March, prices rose steadily throughout the rest of the month. The recent upward trend in prices can be clearly seen to the right of the graph.
Electricity Demand
Electricity demand through March remained at the high end and above recent years as shown below.
Electricity Generation Mix
Throughout March thermal generation has picked up displacing hydro to try to conserve hydro storage.
HVDC Transfer
Power transfers on the HVDC link connecting the North and South Islands are important both in showing relative hydro positions and the reliance on thermal power to meet demand. High northward flow tends to indicate a good SI hydro position, whereas the reverse indicates a heavy reliance on thermal power to make up for hydro shortages.
March saw northward transfer reduce and southward transfer increase to conserve SI hydro storage.
The Electricity Futures Market
The Futures Market provides an indication of where market participants see the spot market moving in the future. They are based on actual trades between participants looking to hedge their positions (as both buyers and sellers) into the future against potential spot market volatility. They are also a useful proxy for the direction of retail contracts.
The following graph shows Futures pricing for CY 2024, 2025, 2026 and 2027 at Otahuhu (Auckland) for the last 2 years.
Note that $100/MWh equates to 10c/kWh.
Forward prices were up in March for all future years. CY 2025 ended the month up 7% at $175. CY 2026 price was up 9% at $160 while CY 2027 closed up at $148/MWh (+6%).
Known new generation projects are shown below (additions / removals highlighted in bold).
Hydro Storage
Inflows were below average in both islands for most of March as shown in the following charts.
Below average March inflows resulted in energy storage levels falling. NZ storage ended the month at 3,079GWh or 69% full, down 375GWh. The following chart shows the latest breakdown of storage across the main hydro catchments.
Security of supply risks increased in March with storage levels decreasing. Note that since the start of April significant inflows have occurred which have brought storage back to close to the level we would typically expect to see for this time of year; and well above the risk zones. This is shown in the following risk curves.
Snowpack
Snowpack is an important way that hydro energy is stored over the winter months and released as hydro inflows in the spring. The following graph shows that the snowpack in the important Waitaki catchment is currently close to the mean levels seen in the last 30 years for this time of year.
Climate outlook overview (from the MetService)
Climate Drivers — El Nino is nearly at its end, with equatorial sea surface temperatures likely to return to neutral conditions in the next two months. However, as atmospheric markers generally lag oceanic indicators, New Zealand is still likely to see periods of enhanced westerly flows through much of autumn. Models are split evenly between keeping a neutral El Nino state or developing a weak La Nina over the coming months, and any effects are unlikely to be seen until the summer. The next pulse of Madden-Julian Oscillation (MJO) is expected from the middle of April, though early indications are downplaying its intensity in favour of maintaining an active westerly flow across the country. Regardless, there remains a slightly increased risk of tropical influence from mid-month, particularly across the upper North Island.
April 2024 Outlook — Cooler conditions prevail during the first week of April as a weakening front brings a burst of heavy rain to parts of western South Island, while the remainder of New Zealand remains largely dry with gradually warming afternoon temperatures but chilly mornings. A more active weather pattern emerges next week, with a hybrid system approaching from both the Tasman Sea and Southern Ocean. This is likely to be the wettest week this month across many regions, with some heavy rain and potential for downpours. This could also be the warmest period of April across the North Island if a large-scale northerly wind stalls over the country. The strong low pressure anomaly stalls southeast of New Zealand by mid-month, with a heightened risk of south-to-southeasterly winds delivering much colder conditions across the board. Frosts may become commonplace about inland areas during this time, and the odd hard frost cannot be ruled out about the South Island high country. Rainfall should trend close to normal under passing showers, though western South Island is at-risk of seeing below-normal precipitation. The final week of April sees very little in the way of rainfall or temperature anomalies, with a likely mix of weakening fronts spreading across the country alongside passing highs.
The Wholesale Gas Market
Spot gas prices increased significantly in March averaging $19.5/GJ – up 22% in the month. Wholesale prices are now about 59% higher than they were at the same time last year.
On the supply side the gradual decline in output across most fields continued through March, exacerbated by an 18 day shutdown at Pohokura, followed by a significant drop in output on its return. Maui started the month producing just under 80TJ per day, reducing to mid 70s by the end of the month. Pohokura started the month averaging 57TJ per day, returning after its shutdown averaging mid 30TJ per day. McKee / Mangahewa averaged low 60TJs across the month. Kupe also dropped away during the month from mid- 50s at the start of the month to 47.5TJ per day at the end of the month.
The following graph shows production levels from major fields over the last 6 years.
On the demand side, Methanex Motonui’s usage declined through March providing the buffer for the reduced supply. Usage started the month in the low 120TJ/day, dropping to close to 80TJ/day for the rest of the month – even after Pohokura returned. Huntly power station decreased slightly, averaging 46TJ/day, while TCC operated throughout the whole month, averaging 25TJ per day.
The following graph shows trends in the major gas users over the last 6 years.

Internationally, LNG netback prices ended the month at $10.94/GJ – down a further 9% from last month. Forecast prices for 2024 increased to $13.32 – up 4% compared to February. Forecast prices for 2025 were also up 5% at $14.1/GJ.
New Zealand does not have an LNG export market, so our domestic prices are not directly linked to global prices. However, some of our large gas users deal in international markets which are impacted by global gas prices, and they may try to produce more in NZ (increase demand) to take advantage of lower gas prices when they occur.
LPG is an important fuel for many large energy users, particularly in areas where reticulated natural gas is not available. The contract price of LPG is typically set by international benchmarks such as the Saudi Aramco LPG – normally quoted in US$ per metric tonne.
The following graph shows the Saudi Aramco LPG pricing for the last 3 years as well as forecast pricing for the year ahead.
The other main contributing factor to LPG prices in New Zealand is the exchange rate against the USD. As shown below this has been falling over the last few years adding to domestic LPG prices.
The Coal Market
The global energy crisis has been as much about coal as it has gas. The war in the Ukraine has driven energy prices, including coal, up. Prices in March were down slightly, ending the month at US$121/T – an 8% drop on the February close. These prices are finally returning to levels close to what we expect to see as shown in the following graph of prices over the last 10 years.
Like gas, the price of coal can flow through and have an impact on the electricity market. However, coal stockpiles at Huntly are at the highest they have been for many years helping to assure the market that there is plenty of fuel available in the event of dry conditions in the hydro catchments.
Carbon Pricing
NZ has had an Emissions Trading Scheme (ETS) in place since 2008. It has been subsequently reviewed by several governments and is now an “uncapped” price scheme closely linked to international schemes. However, there are “upper and lower guard-rails” set up to prevent wild swings in carbon price that act as minimum and maximum prices. These increased in December 2023 to $173 and $64 respectively. Carbon prices decreased a further 11% in March to $60.
As the carbon price rises, the cost of coal, gas or other fossil fuels used in process heat applications will naturally also rise. Electricity prices are also affected by a rising carbon price. Electricity prices are set by the marginal producing unit – in NZ this is currently typically coal or gas or hydro generators, with the latter valuing the cost of its water against the former. An increase in carbon price can lead to an increase in electricity prices in the short to medium term (as the marginal units set the price). A carbon price of $50/t is estimated to currently add about $25/MWh (or ~2.5c/kWh) to electricity prices. In the long term the impact should reduce as money is invested in more low-cost renewables and there is less reliance on gas and coal fired generation.
EU Carbon Permits Increased in March to 62 Euro/tonne – up 10%.
About this Report
This energy market summary report provides information on wholesale price trends within the NZ Electricity Market.
Please note that all electricity prices are presented as a $ per MWh price and all carbon prices as a $ per unit price.
All spot prices are published by the Electricity Authority. Futures contract prices are sourced from ASX.
Further information can be found at the locations noted below.
- Transpower publishes a range of detailed information which can be found here: https://www.transpower.co.nz/power-system-live-data
- The Electricity Authority publishes a range of detailed information which can be found here: https://www.emi.ea.govt.nz/
- Weather and Climate data – The MetService publishes a range of weather-related information which can be found here: https://www.metservice.com/
Disclaimer
This document has been prepared for information and explanatory purposes only and is not intended to be relied upon by any person. This document does not form part of any existing or future contract or agreement between us. We make no representation, assurance, or guarantee as to the accuracy of the information provided. To the maximum extent permitted by law, none of Smart Power Ltd, its related companies, directors, employees or agents accepts any liability for any loss arising from the use of this document or its contents or otherwise arising out or, or in connection with it. You must not provide this document or any information contained in it to any third party without our prior consent.
About Smart Power
Smart Power is a full-service Energy Management consultancy. Apart from Energy Procurement, Smart Power can also provide:
- Technical Advice on how to reduce your energy use/emissions
- Sustainability Reporting
- Invoice Management services.
We also offer boutique energy and water billing service for landlords/property developers.
Contact us at https://smartpower1.wpenginepowered.com/contact/ or ring one of our offices to talk to one of our experienced staff about how we can assist you with achieving your energy goals.
© Copyright, 2024. Smart Power Ltd
Market Update February 2024
The Wholesale Electricity Market
Spot prices in the wholesale electricity market decreased in February. Average spot prices ranged from $133 in the lower South Island (down from $183 in January), up to $165 in the upper North Island (down from $204).
The following chart shows average weekly spot prices over the last 2 years. After falling at the end of January, prices rose steadily throughout February. The recent see-sawing in prices can be clearly seen to the right of the graph.
Electricity Demand
Electricity demand through February remained at the high end and above recent years as shown below.
Electricity Generation Mix
Throughout February thermal generation has picked up displacing hydro to try to conserve hydro storage.
HVDC Transfer
Power transfers on the HVDC link connecting the North and South Islands are important both in showing relative hydro positions and the reliance on thermal power to meet demand. High northward flow tends to indicate a good SI hydro position, whereas the reverse indicates a heavy reliance on thermal power to make up for hydro shortages.
February saw northward transfer reduce and southward transfer increase to conserve SI hydro storage.
The Electricity Futures Market
The Futures Market provides an indication of where market participants see the spot market moving in the future. They are based on actual trades between participants looking to hedge their positions (as both buyers and sellers) into the future against potential spot market volatility. They are also a useful proxy for the direction of retail contracts.
The following graph shows Futures pricing for CY 2024, 2025, 2026 and 2027 at Otahuhu (Auckland) for the last 2 years.
Note that $100/MWh equates to 10c/kWh.
Forward prices were down slightly in February for most future years. CY 2025 was up slightly at $163 (+0.5%). CY 2026 price was down 3% at $147 while CY 2027 closed down slightly at $139/MWh (-0.5%).
Known new generation projects are shown below (additions / removals highlighted in bold).
Hydro Storage
Inflows were above average in the NI at the start of February before dropping away later in the month. Inflows remained below average for the SI for the whole month as shown in the following charts.
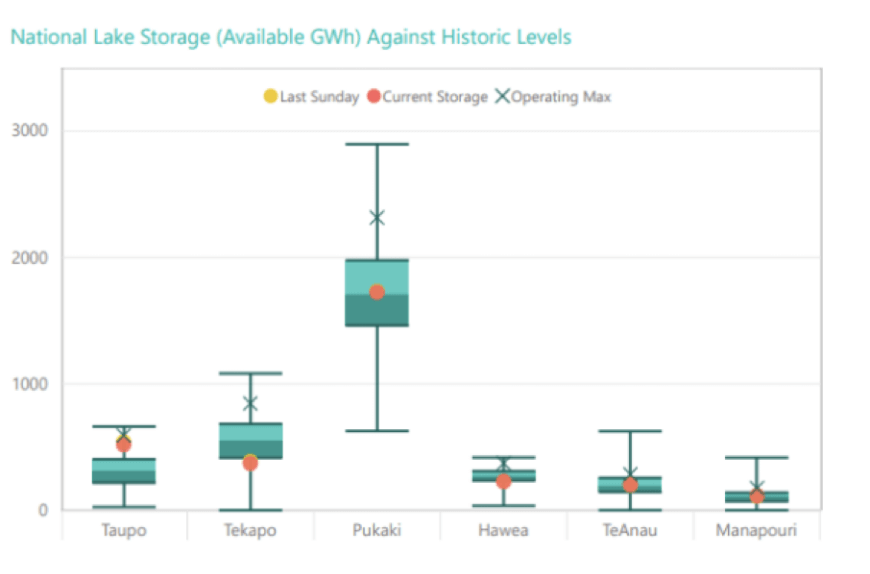
Below average February inflows resulted in energy storage levels falling. NZ storage ended the month at 3,454GWh or 78% full, down 280GWh. The following chart shows the latest breakdown of storage across the main hydro catchments.
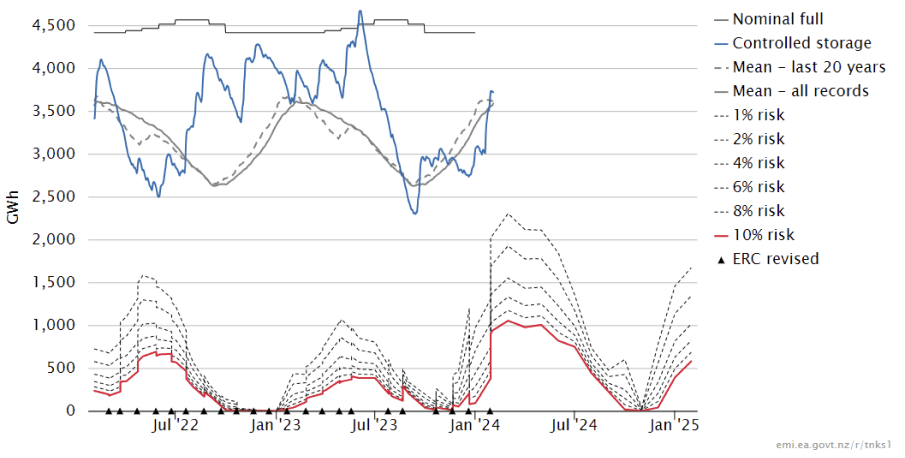
Security of supply risks increased in February with storage levels decreasing. We are currently slightly below the level we would typically expect to see for this time of year; but remain well above the risk zones. This is shown in the following risk curves.
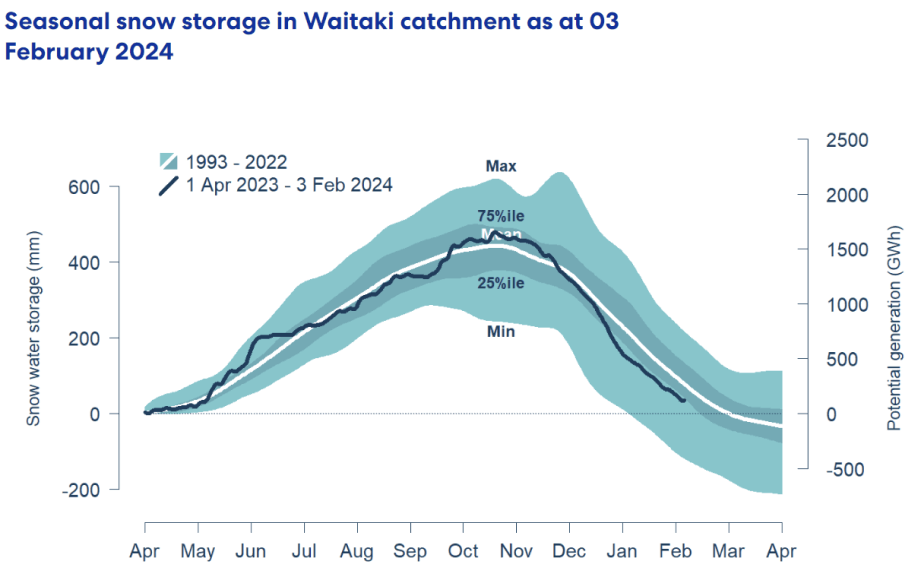
Snowpack
Snowpack is an important way that hydro energy is stored over the winter months and released as hydro inflows in the spring. The following graph shows that the snowpack in the important Waitaki catchment is currently below mean levels seen in the last 30 years for this time of year.
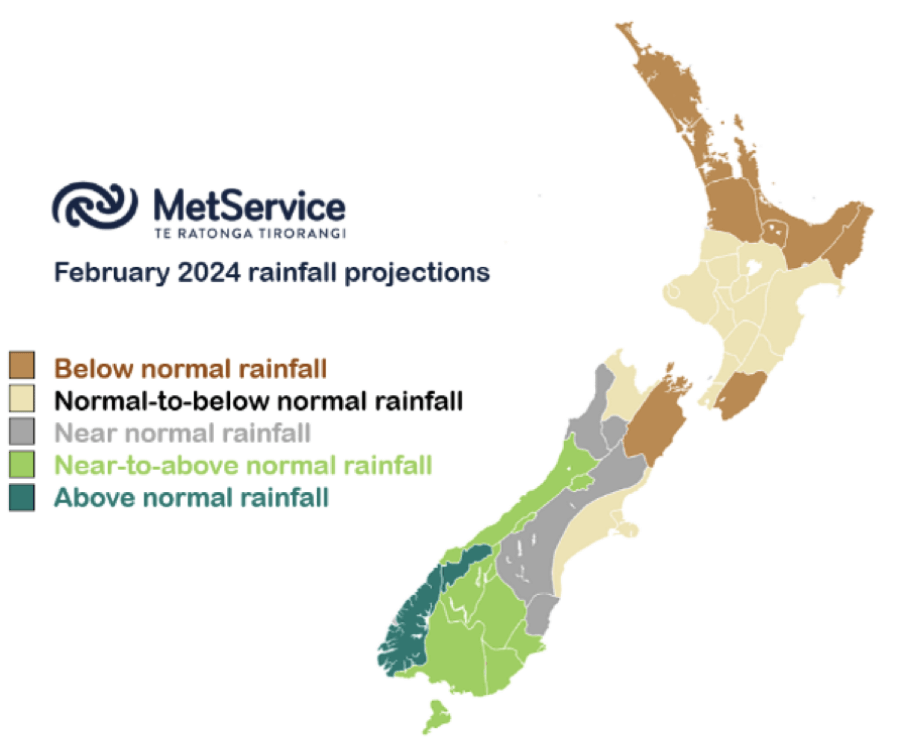
Climate outlook overview (from the MetService)
Climate Drivers — Oceanic sea surface temperatures about the equatorial Pacific Ocean are declining, indicative of a weakening El Nino event. While this El Nino event is expected to ease and become neutral over the coming months, New Zealand should expect an enhanced westerly flow to persist through much of autumn. The Madden-Julian Oscillation (MJO) is expected to make its return to the Southwest Pacific around mid-March, bringing with it an increased potential for warmer (and wetter) subtropical systems across the North Island under an enhanced northeasterly flow. The South Island may see some of this tropical moisture as well, but these will be more of a ‘boom or bust’ scenario.
March 2024 Outlook — A dreary start to autumn as a Southern Ocean cold front sweeps up the country and brings a burst of rain and wind to much of New Zealand as the active westerly weather pattern persists. After this front, some respite is likely as high pressure settles across the country. However, with clearing skies and lighter winds comes falling temperatures, and parts of the lower South Island could see overnight lows approaching freezing by the middle of next week. This pattern shifts around the middle of the month as the MJO once again becomes active in our neck of the woods, which brings an increased potential for a subtropical low or two to approach the country. Peak risk is from mid-month into the third week of March, with the North Island most likely to see warmer temperatures, a potential rainmaker and an uptick in thunderstorm activity, though this is a ‘boom or bust’ situation. The South Island may see some northerly rain as well if a low can drive further south. However, if a subtropical low does not affect New Zealand, then much of the country can expect an overall drier-than-normal month. March ends on a transitional note, as high pressure builds back across the North Island and lower pressure returns once again further south. Although El Nino is on an easing trend, its impacts will likely be felt well into autumn.
The Wholesale Gas Market
Spot gas prices increased again in February averaging $16/GJ – up 5% in the month. Wholesale prices are now about 58% higher than they were at the same time last year.
On the supply side the gradual decline in output across most fields continued through February. Maui started the month producing just under 85TJ per day, reducing to low 80s / high 70s by the end of the month. Pohokura maintained high 70s throughout February while McKee / Mangahewa averaged mid 60TJs across the month. Kupe maintained the increased level noted last month with production averaging mid- 50s.
The following graph shows production levels from major fields over the last 4 years.
On the demand side, Methanex Motonui’s usage declined through February from around 140TJ/day to low 120s by the end of the month. Huntly power station increased, averaging 50TJ/day, while TCC started the month shut down, then started up on the 11th Feb averaging 30TJ per day for the rest of the month.
The following graph shows trends in the major gas users over the last 4 years.
Methanex reported earnings during January when it was noted that their NZ production was forecast to be lower this year, at least partly due to expected gas supply constraints.
Internationally, LNG netback prices ended the month at $12.03/GJ – down a further 14% from last month. Forecast prices for 2024 fell again to $12.77 – down another 8.5% compared to January. Forecast prices for 2025 were also down 7.5% at $13.4/GJ.
New Zealand does not have an LNG export market, so our domestic prices are not directly linked to global prices. However, some of our large gas users deal in international markets which are impacted by global gas prices, and they may try to produce more in NZ (increase demand) to take advantage of lower gas prices.
LPG is an important fuel for many large energy users, particularly in areas where reticulated natural gas is not available. The contract price of LPG is typically set by international benchmarks such as the Saudi Aramco LPG – normally quoted in US$ per metric tonne.
The following graph shows the Saudi Aramco LPG pricing for the last 3 years as well as forecast pricing for the year ahead.
The other main contributing factor to LPG prices in New Zealand is the exchange rate against the USD. As shown below this has been falling over the last few years adding to domestic LPG prices.
The Coal Market
The global energy crisis has been as much about coal as it has gas. The war in the Ukraine has driven energy prices, including coal, up. Prices in February increased, ending the month at US$132/T – a 14% lift on the January close. These prices are finally returning to levels close to what we expect to see as shown in the following graph of prices over the last 10 years.
Like gas, the price of coal can flow through and have an impact on the electricity market. However, coal stockpiles at Huntly are at the highest they have been for many years helping to assure the market that there is plenty of fuel available in the event of dry conditions in the hydro catchments.
Carbon Pricing
NZ has had an Emissions Trading Scheme (ETS) in place since 2008. It has been subsequently reviewed by several governments and is now an “uncapped” price scheme closely linked to international schemes. However, there are “upper and lower guard-rails” set up to prevent wild swings in carbon price that act as minimum and maximum prices. These increased in December 2023 to $173 and $64 respectively. Carbon prices decreased 8% in February to $67.25.
As the carbon price rises, the cost of coal, gas or other fossil fuels used in process heat applications will naturally also rise. Electricity prices are also affected by a rising carbon price. Electricity prices are set by the marginal producing unit – in NZ this is currently typically coal or gas or hydro generators, with the latter valuing the cost of its water against the former. An increase in carbon price can lead to an increase in electricity prices in the short to medium term (as the marginal units set the price). A carbon price of $50/t is estimated to currently add about $25/MWh (or ~2.5c/kWh) to electricity prices. In the long term the impact should reduce as money is invested in more low-cost renewables and there is less reliance on gas and coal fired generation.
EU Carbon Permits decreased further in February to 56 Euro/tonne – down 11%.
About this Report
This energy market summary report provides information on wholesale price trends within the NZ Electricity Market.
Please note that all electricity prices are presented as a $ per MWh price and all carbon prices as a $ per unit price.
All spot prices are published by the Electricity Authority. Futures contract prices are sourced from ASX.
Further information can be found at the locations noted below.
- Transpower publishes a range of detailed information which can be found here: https://www.transpower.co.nz/power-system-live-data
- The Electricity Authority publishes a range of detailed information which can be found here: https://www.emi.ea.govt.nz/
- Weather and Climate data – The MetService publishes a range of weather-related information which can be found here: https://www.metservice.com/
Disclaimer
This document has been prepared for information and explanatory purposes only and is not intended to be relied upon by any person. This document does not form part of any existing or future contract or agreement between us. We make no representation, assurance, or guarantee as to the accuracy of the information provided. To the maximum extent permitted by law, none of Smart Power Ltd, its related companies, directors, employees or agents accepts any liability for any loss arising from the use of this document or its contents or otherwise arising out or, or in connection with it. You must not provide this document or any information contained in it to any third party without our prior consent.
About Smart Power
Smart Power is a full-service Energy Management consultancy. Apart from Energy Procurement, Smart Power can also provide:
- Technical Advice on how to reduce your energy use/emissions
- Sustainability Reporting
- Invoice Management services.
We also offer boutique energy and water billing service for landlords/property developers.
Contact us at https://smartpower1.wpenginepowered.com/contact/ or ring one of our offices to talk to one of our experienced staff about how we can assist you with achieving your energy goals.
© Copyright, 2024. Smart Power Ltd
Market Update January 2024
The Wholesale Electricity Market
Spot prices in the wholesale electricity market increased again in January. Average spot prices ranged from $183 in the lower South Island (up from $169 in December), up to $204 in the upper North Island (up from $184).
The following chart shows average weekly spot prices over the last 2 years. Prices rose steeply at the start of January before falling towards the end of the month. The recent see-sawing in prices can be clearly seen to the right of the graph.
Electricity Demand
Electricity demand in January is at the high end compared to recent years as shown below.
Electricity Generation Mix
Lower holiday period demand meant that hydro generation could be reduced allowing for storage to be conserved early in January. As demand picked up later in the month thermal generation increased as did hydro reflecting some increased inflows.
HVDC Transfer
Power transfers on the HVDC link connecting the North and South Islands are important both in showing relative hydro positions and the reliance on thermal power to meet demand. High northward flow tends to indicate a good SI hydro position, whereas the reverse indicates a heavy reliance on thermal power to make up for hydro shortages.
January saw northward transfer reduce and southward transfer increase to conserve SI hydro storage .
The Electricity Futures Market
The Futures Market provides an indication of where market participants see the spot market moving in the future. They are based on actual trades between participants looking to hedge their positions (as both buyers and sellers) into the future against potential spot market volatility. They are also a useful proxy for the direction of retail contracts.
The following graph shows Futures pricing for CY 2024, 2025, 2026 and 2027 at Otahuhu (Auckland) for the last 2 years.
Note that $100/MWh equates to 10c/kWh.
Forward prices were flat in January for all future years. CY 2025 was down slightly at $162 (-0.5%). CY 2026 price was unchanged at $152 while CY 2027 closed up slightly at $140/MWh (+0.5%).
Known new generation projects are shown below (additions / removals highlighted in bold).
Hydro Storage
Inflows were above average in the NI at the start of January and below average in the SI as shown in the following charts. SI Inflows did increase towards the end of the month (not shown in the charts).
Above average January inflows resulted in energy storage levels in the NI’s main hydro storage lake (Taupo) increasing through the month to close to maximum levels. In the SI, low inflows at the start of the month caused storage to fall before some substantial inflows later in the month brought storage back above average levels for this time of the year. NZ storage ended the month at 3,734GWh or 85% full, up 734GWh. The following chart shows the latest breakdown of storage across the main hydro catchments.
Security of supply risks decreased in January with storage levels increasing. We are currently slightly above the level we would typically expect to see for this time of year; and remain well above the risk zones. This is shown in the following risk curves.
Snowpack
Snowpack is an important way that hydro energy is stored over the winter months and released as hydro inflows in the spring. The following graph shows that the snowpack in the important Waitaki catchment is currently below mean levels seen in the last 30 years for this time of year.
Climate outlook overview (from the MetService)
Climate Drivers — As expected, the Madden-Julian Oscillation (MJO) became active over the tropics during the second half of the month and helped fire up TC Kirrily, which moved onto Australia’s Queensland coast late on the 25th. Ultimately, high pressure over the Tasman Sea kept this system away from NZ, but we did see sub-tropical moisture feed onto NZ at times during the second half of January, aiding some large rainfall events later in the month. The tropics look likely to remain active until mid-February and further named storms are possible over coming weeks, but there are increasing signs that these systems will remain well to the north of NZ. Warm sea surface temperatures associated with El Nino in the central Pacific have now peaked and the atmosphere could now play catch up through late summer and autumn.
February 2024 Outlook — As kids across NZ head back to school, it looks like the weather maps have been studying hard over the summer break with a textbook El Nino month on the cards this February. After El Nino impacts stuttered a bit through the first couple months of summer an enhanced westerly regime, with high pressure ridging persistent across northern NZ and regular fronts washing through south of the high (this is a classic signal during an El Nino summer), is likely to dominate over the next month. The high might win out across South Island at times too, but not as much as we have seen through early summer, and a more unsettled, windier outlook is favoured for the SW corner of New Zealand than over recent months. Near to above normal rainfall is expected for the west and south of the South Island, with the strongest signal for wetter conditions in Fiordland. Fronts should occasionally intrude into the dominant high pressure over the North Island, but any moisture these bring to western areas will likely be rapidly sucked out of the ground by persistent windy days. Eastern and northern areas are expected to be drier than normal, especially during the first half of the month. A cool start to the month, but temperatures should rebound around Waitangi Day. The second half of the month should see regular fluctuations with plenty of warm days still, but interspersed with cooler outbreaks, before an overall downwards trend towards the tail end of summer.
The Wholesale Gas Market
Spot gas prices increased again in January averaging $15.2/GJ – up 5% in the month. Wholesale prices are now about 43% higher than they were at the same time last year.
On the supply side the gradual decline in output across most fields continued through January. Maui started the month producing just under 100TJ per day, reducing to mid to low 80s by the end of the month. Pohokura started at around 62TJ, reducing to high 50s by months end. McKee / Mangahewa went from 70+TJ per day down to mid 60TJs across January. Kupe was the exception with production increasing from 40TJ at the start of the month, jumping to 50TJ and then again to 55TJ at the end of the month.
The following graph shows production levels from major fields over the last 4 years.
On the demand side, Methanex Motonui’s usage was flat through January at just below 150TJ/day for most of the month. Huntly power station gas use was also static during the month, averaging 44TJ/day, while TCC averaged around 35TJ per day until the end of the month when high inflows enabled it to be shut down.
The following graph shows trends in the major gas users over the last 4 years.
Methanex reported earnings during January when it was noted that their NZ production was forecast to be lower this year, at least partly due to expected gas supply constraints.
Internationally, LNG netback prices ended the month at $13.95/GJ – down 27% from last month. Forecast prices for 2024 fell again to $13.95 – down another 5% compared to December. Forecast prices for 2025 were also down 3% at $14.5/GJ.

New Zealand does not have an LNG export market, so our domestic prices are not directly linked to global prices. However, some of our large gas users deal in international markets which are impacted by global gas prices, and they may try to produce more in NZ (increase demand) to take advantage of lower gas prices.
LPG is an important fuel for many large energy users, particularly in areas where reticulated natural gas is not available. The contract price of LPG is typically set by international benchmarks such as the Saudi Aramco LPG – normally quoted in US$ per metric tonne.
The following graph shows the Saudi Aramco LPG pricing for the last 3 years as well as forecast pricing for the year ahead.

The other main contributing factor to LPG prices in New Zealand is the exchange rate against the USD. As shown below this has been falling over the last few years adding to domestic LPG prices.
The Coal Market
The global energy crisis has been as much about coal as it has gas. The war in the Ukraine has driven energy prices, including coal, up. Prices in January decreased, ending the month at US$116/T – a 22% drop on the December close. These prices are finally returning to levels close to what we expect to see as shown in the following graph of prices over the last 10 years.
Like gas, the price of coal can flow through and have an impact on the electricity market. However, coal stockpiles at Huntly are at the highest they have been for many years helping to assure the market that there is plenty of fuel available in the event of dry conditions in the hydro catchments.
Carbon Pricing
NZ has had an Emissions Trading Scheme (ETS) in place since 2008. It has been subsequently reviewed by several governments and is now an “uncapped” price scheme closely linked to international schemes. However, there are “upper and lower guard-rails” set up to prevent wild swings in carbon price that act as minimum and maximum prices. These increased in December 2023 to $173 and $64 respectively. Carbon prices increased 7% in January to $73.1.
As the carbon price rises, the cost of coal, gas or other fossil fuels used in process heat applications will naturally also rise. Electricity prices are also affected by a rising carbon price. Electricity prices are set by the marginal producing unit – in NZ this is currently typically coal or gas or hydro generators, with the latter valuing the cost of its water against the former. An increase in carbon price can lead to an increase in electricity prices in the short to medium term (as the marginal units set the price). A carbon price of $50/t is estimated to currently add about $25/MWh (or ~2.5c/kWh) to electricity prices. In the long term the impact should reduce as money is invested in more low-cost renewables and there is less reliance on gas and coal fired generation.
EU Carbon Permits decreased in January to 64 Euro/tonne – down 21%.
About this Report
This energy market summary report provides information on wholesale price trends within the NZ Electricity Market.
Please note that all electricity prices are presented as a $ per MWh price and all carbon prices as a $ per unit price.
All spot prices are published by the Electricity Authority. Futures contract prices are sourced from ASX.
Further information can be found at the locations noted below.
- Transpower publishes a range of detailed information which can be found here: https://www.transpower.co.nz/power-system-live-data
- The Electricity Authority publishes a range of detailed information which can be found here: https://www.emi.ea.govt.nz/
- Weather and Climate data – The MetService publishes a range of weather-related information which can be found here: https://www.metservice.com/
Disclaimer
This document has been prepared for information and explanatory purposes only and is not intended to be relied upon by any person. This document does not form part of any existing or future contract or agreement between us. We make no representation, assurance, or guarantee as to the accuracy of the information provided. To the maximum extent permitted by law, none of Smart Power Ltd, its related companies, directors, employees or agents accepts any liability for any loss arising from the use of this document or its contents or otherwise arising out or, or in connection with it. You must not provide this document or any information contained in it to any third party without our prior consent.
About Smart Power
Smart Power is a full-service Energy Management consultancy. Apart from Energy Procurement, Smart Power can also provide:
- Technical Advice on how to reduce your energy use/emissions
- Sustainability Reporting
- Invoice Management services.
We also offer boutique energy and water billing service for landlords/property developers.
Contact us at https://smartpower1.wpenginepowered.com/contact/ or ring one of our offices to talk to one of our experienced staff about how we can assist you with achieving your energy goals.
© Copyright, 2024. Smart Power Ltd
Market Update December 2023
The Wholesale Electricity Market
Spot prices in the wholesale electricity market increased through December. Average spot prices ranged from $169 in the lower South Island (up from $127 in November), up to $184 in the upper North Island (up from $154).
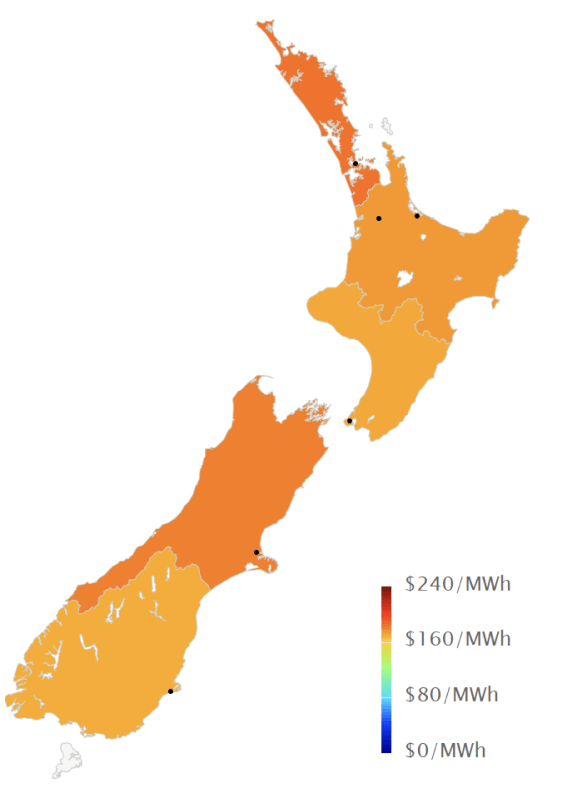
The following chart shows average weekly spot prices over the last 2 years. The recent increase in prices can be clearly seen to the right of the graph.
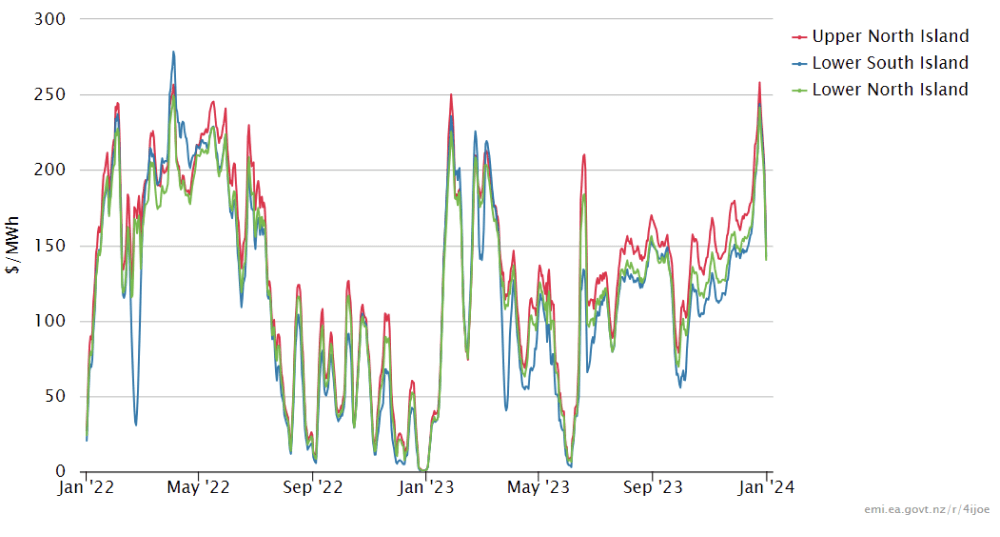
Electricity Demand
Electricity demand in December was on a par with recent years, falling as we head into the warmer summer period.
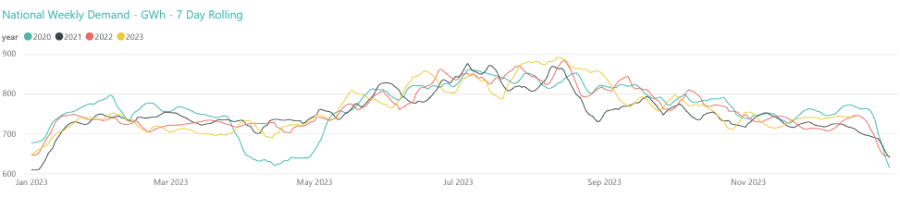
Electricity Generation Mix
Attempts to conserve hydro storage led to increased thermal generation through December as shown below, though reduced demand means this remains well below winter levels.
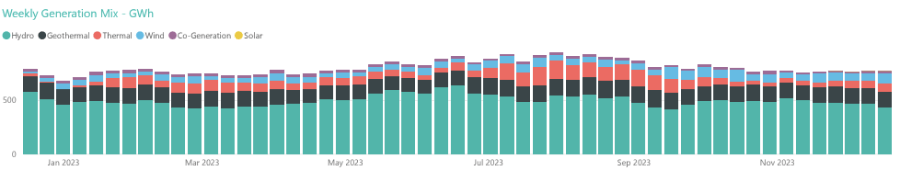
HVDC Transfer
Power transfers on the HVDC link connecting the North and South Islands are important both in showing relative hydro positions and the reliance on thermal power to meet demand. High northward flow tends to indicate a good SI hydro position, whereas the reverse indicates a heavy reliance on thermal power to make up for hydro shortages.
December saw northward transfer reduce to conserve SI hydro storage. Later in the month there was even some significant southward transfer.
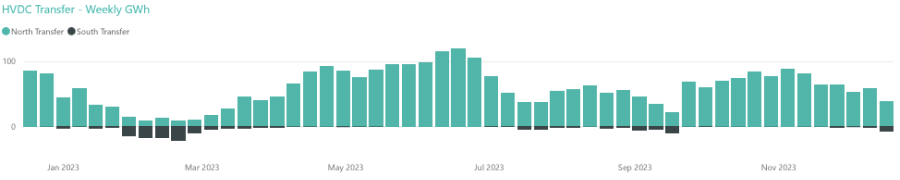
The Electricity Futures Market
The Futures Market provides an indication of where market participants see the spot market moving in the future. They are based on actual trades between participants looking to hedge their positions (as both buyers and sellers) into the future against potential spot market volatility. They are also a useful proxy for the direction of retail contracts.
The following graph shows Futures pricing for CY 2024, 2025, 2026 and 2027 at Otahuhu (Auckland) for the last 2 years.
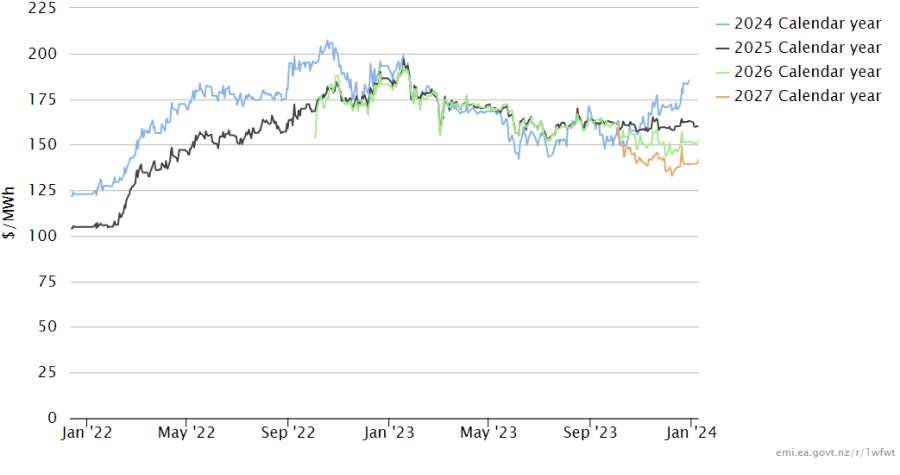
Note that $100/MWh equates to 10c/kWh.
Forward prices were up in December for all future years. CY 2024 closed at $185/MWh (+8%), while CY 2025 was at $163 (+2%). CY 2026 price was up 5% at $152 and CY 2027 closed at $139/MWh (+2%).
Known new generation projects are shown below (additions / removals highlighted in bold).
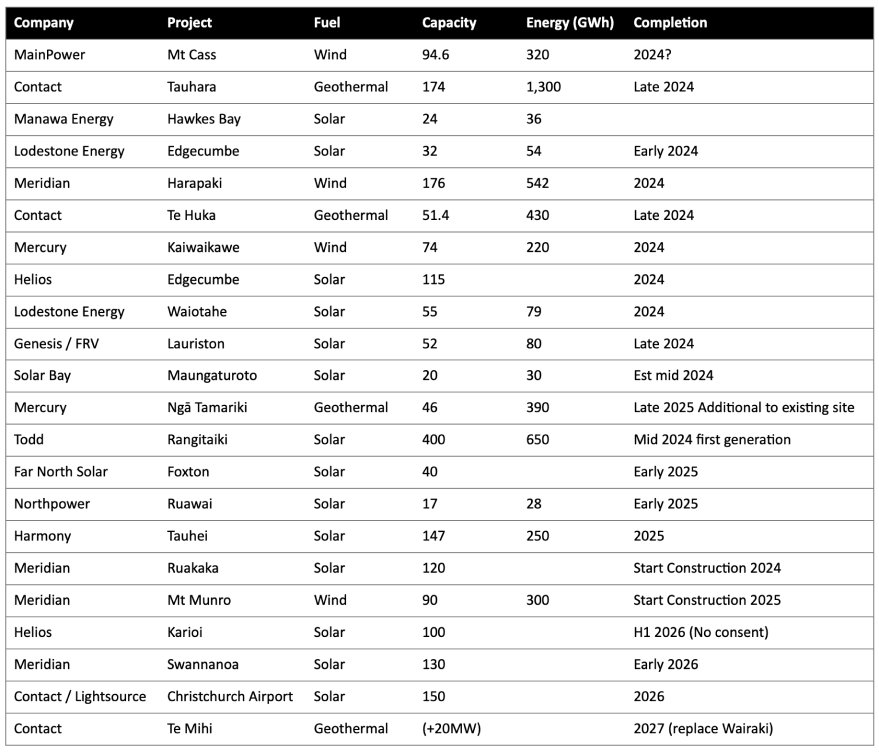
Hydro Storage
Inflows were below average in both the North and South Island through December as shown in the following charts. Inflows did increase towards the end of the month (not shown in the charts).
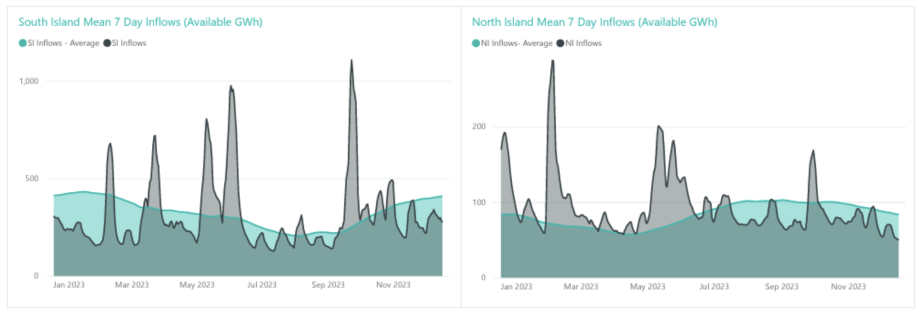
Below average December inflows resulted in energy storage levels in New Zealand’s main hydro storage lakes decreasing through the month, though there was an uplift due to increased inflows at the end of the month. Storage ended the month at 3,000GWh or 68% full, up 162GWh. The following chart shows the latest breakdown of storage across the main hydro catchments.
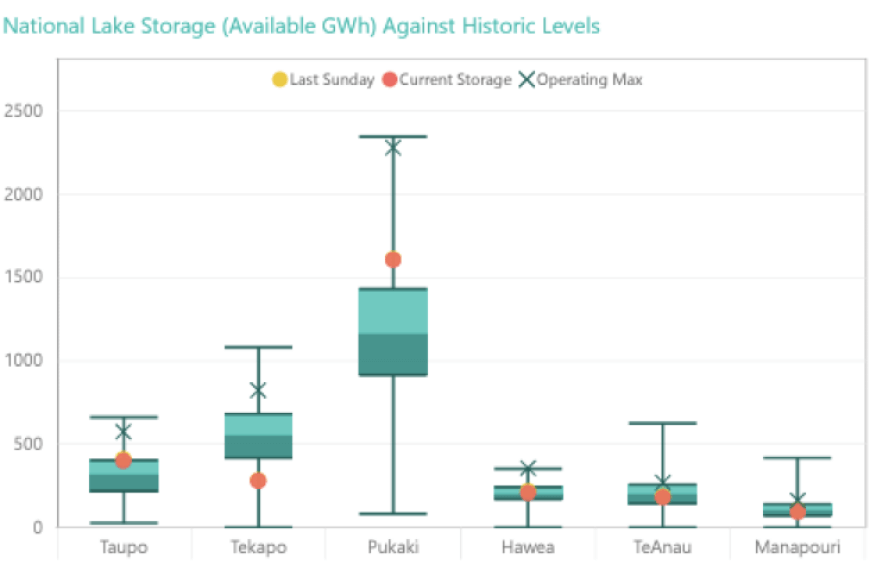
Security of supply risks decreased in December with storage levels increasing. We remain slightly below the level we would typically expect to see for this time of year; but remain well above the risk zones. This is shown in the following risk curves.
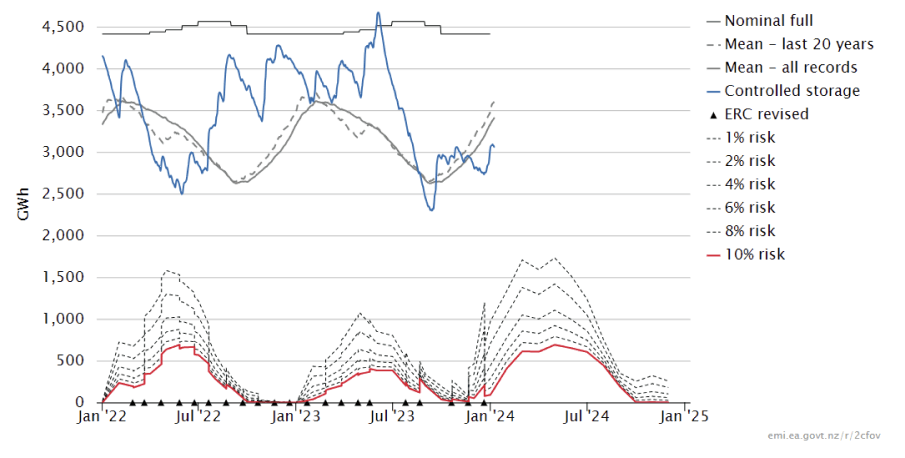
Snow Pack
Snowpack is an important way that hydro energy is stored over the winter months and released as hydro inflows in the spring. The following graph shows that the snowpack in the important Waitaki catchment is currently below mean levels seen in the last 30 years for this time of year.
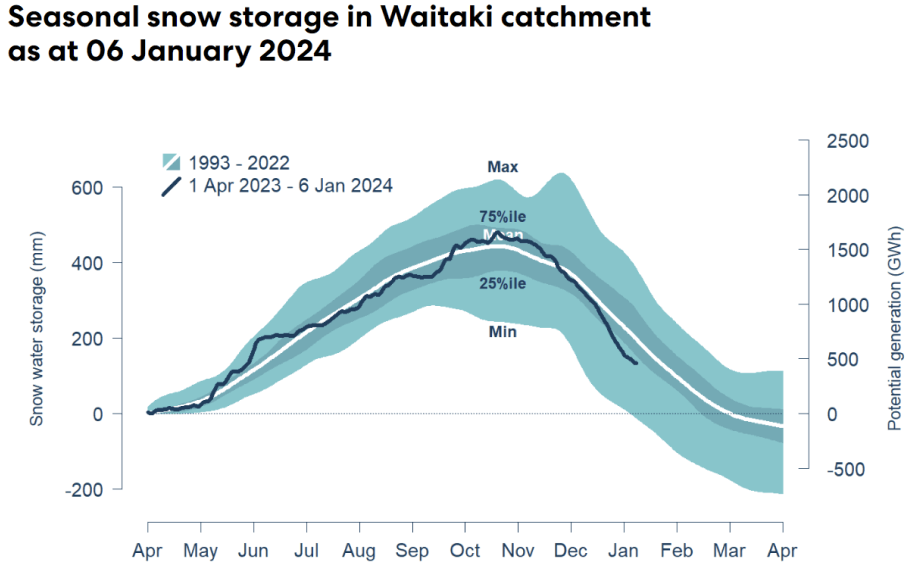
Climate outlook overview (from the MetService)
Climate Drivers — El Nino conditions remain in place through the equatorial Pacific, peaking this month. However, despite these oceanic conditions, weather across New Zealand may end up quite different to what we usually regard as typical El Nino conditions as other shorter term climate drivers dictate. One of these is the Madden-Julian Oscillation (MJO) which may become active again over the tropics north of New Zealand towards the latter parts of the month. This may help drive an unsettled Tasman Sea which brings the risk of rain to northern and western parts of the country. However, this progression of the MJO is not set in stone, and a longer, more typical El Nino dry period should be seen through to the middle of January at least.
January 2023 Outlook — The month of January may very well end up with two distinct periods. A large and slow-moving high pressure system is likely to dominate over New Zealand through to about mid-month. This generally means sunnier days, pleasant temperatures and lighter winds. There may be the odd front here and there, but overall, these should not result in much severe weather. That said, they could increase temperatures and humidity, and in turn create conditions favourable to showers and potential thunderstorms for some inland places. These should be somewhat isolated and as a result, soil moisture deficits could increase quickly over the next week or two for most places. There are signs of these settled conditions departing during the last two weeks of the month as Tasman Sea systems may become more common again. This will be very dependent on the high that needs to give way first, and this battle between the high and an incoming Tasman Sea system can be tricky to pin down this far in advance. However, there are hints of north to northwesterly rain for northern and western parts of the country, potentially flipping a dry month to normal or slightly wetter than normal for some there. Confidence decreases for the South Island where places like Canterbury and West Coast lies borderline with incoming rain, while it may run drier in the deep south. Temperatures and humidity should increase next week, making for some unpleasant nights in particular. Humidity is likely to remain a factor later in the month for northern parts of the country, while southern regions could see a cooler period or two.
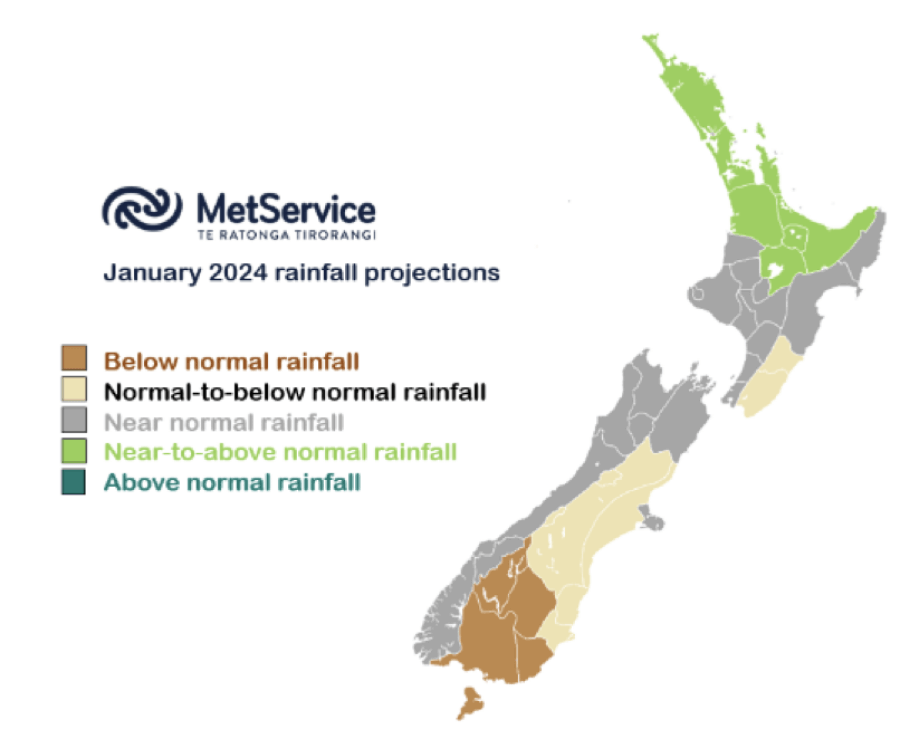
The Wholesale Gas Market
Spot gas prices increased again in December averaging $14.5/GJ – up 8% in the month. Wholesale prices are now about 38% higher than they were at the same time last year.
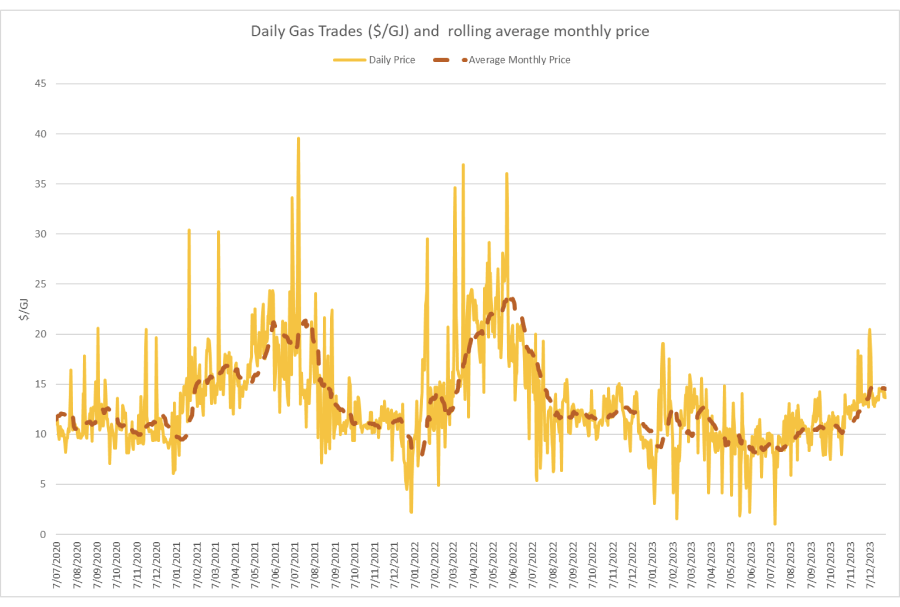
On the supply side Kupe resumed production at the end of the first week of December – averaging close to 50TJ per day when it returned from an extended outage. Maui output was flat – averaging about 93TJ/day. Pohokura had declining output, averaging 63TJ/day, as was McKee / Mangahewa, down slightly at around 69TJ/day in December.
The following graph shows production levels from major fields over the last 4 years.
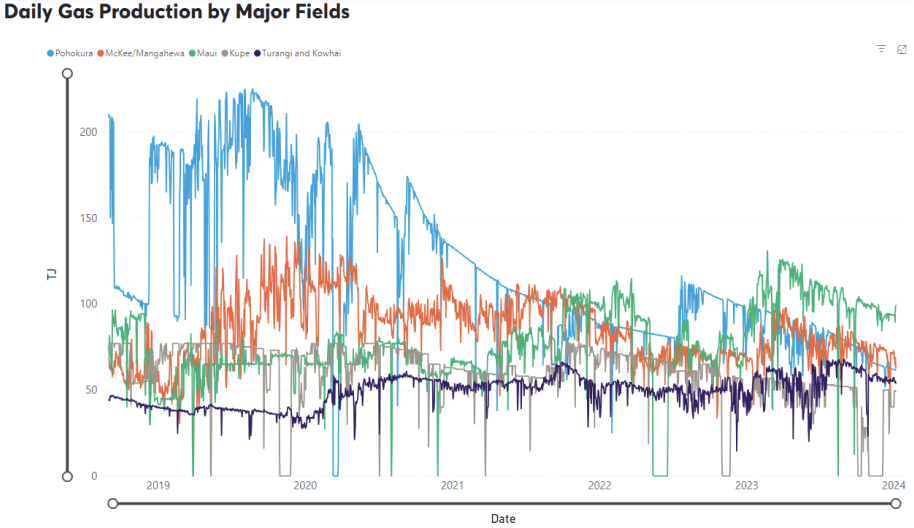
On the demand side, Methanex Motonui’s usage increased in December to around 150TJ/day for most of the month. Huntly power station gas use increased during the month, averaging 44TJ/day, while TCC started up in the middle of the month, averaging around 30TJ per day once operating.
The following graph shows trends in the major gas users over the last 4 years.
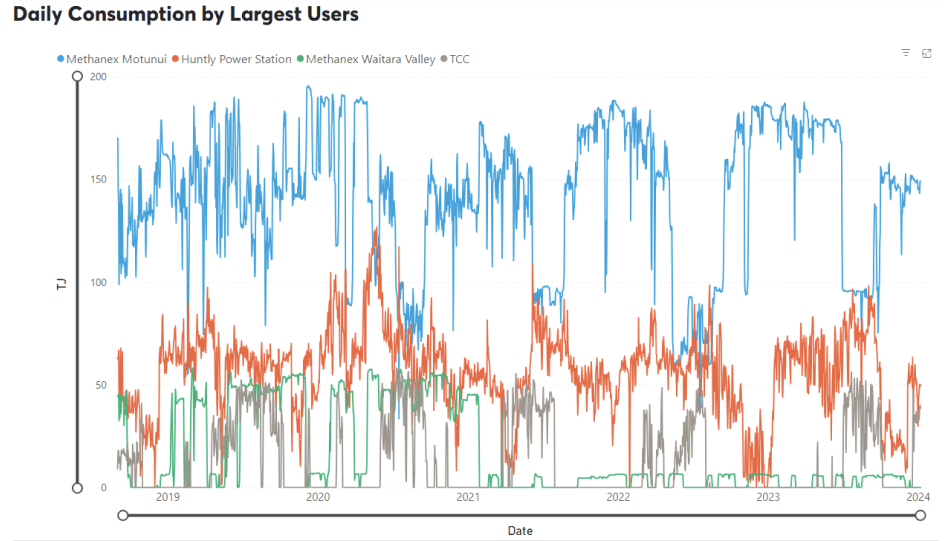
Internationally, LNG netback prices ended the month at $19/GJ – down 13% from last month. Forecast prices for 2024 fell sharply to $14.7 – down 21% compared to November. Forecast prices for 2025 were also shown for the first time – $15/GJ.
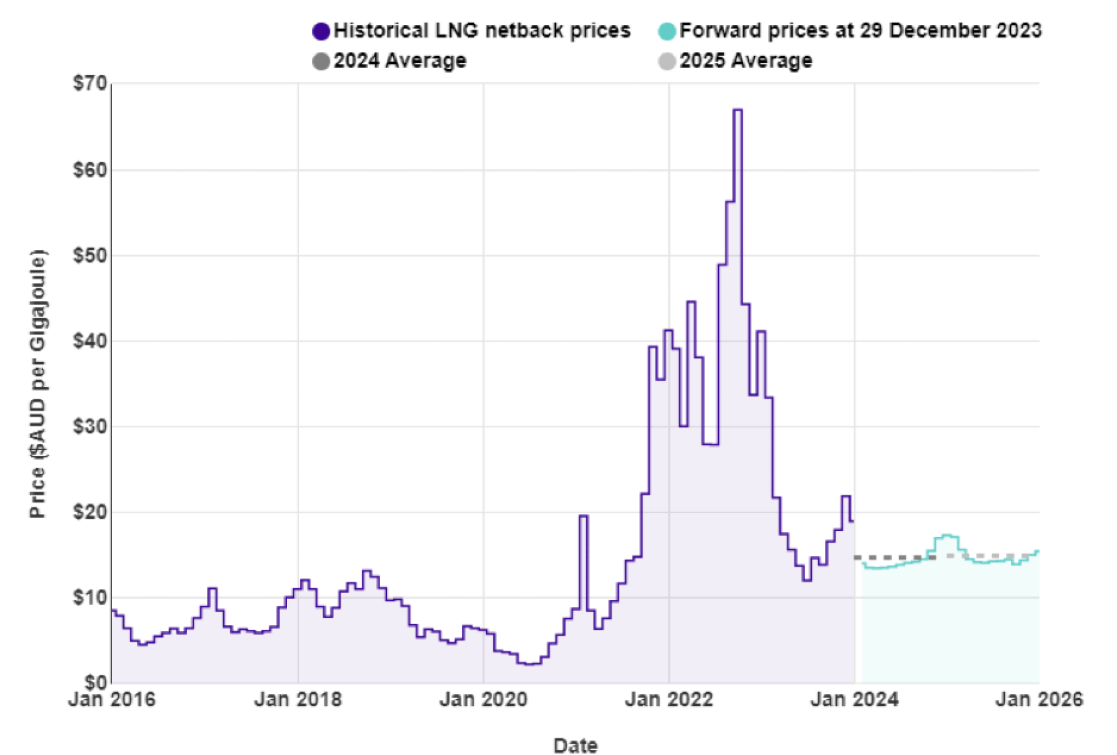
New Zealand does not have an LNG export market, so our domestic prices are not directly linked to global prices. However, some of our large gas users deal in international markets which are impacted by global gas prices, and they may try to produce more in NZ (increase demand) to take advantage of lower gas prices.
LNG is an important fuel for many large energy users, particularly in areas where reticulated natural gas is not available. The contract price of LNG is typically set by international benchmarks such as the Saudi Aramco LPG – normally quoted in US$ per metric tonne.
The following graph shows the Saudi Aramco LPG pricing for the last 3 years as well as forecast pricing for the year ahead.
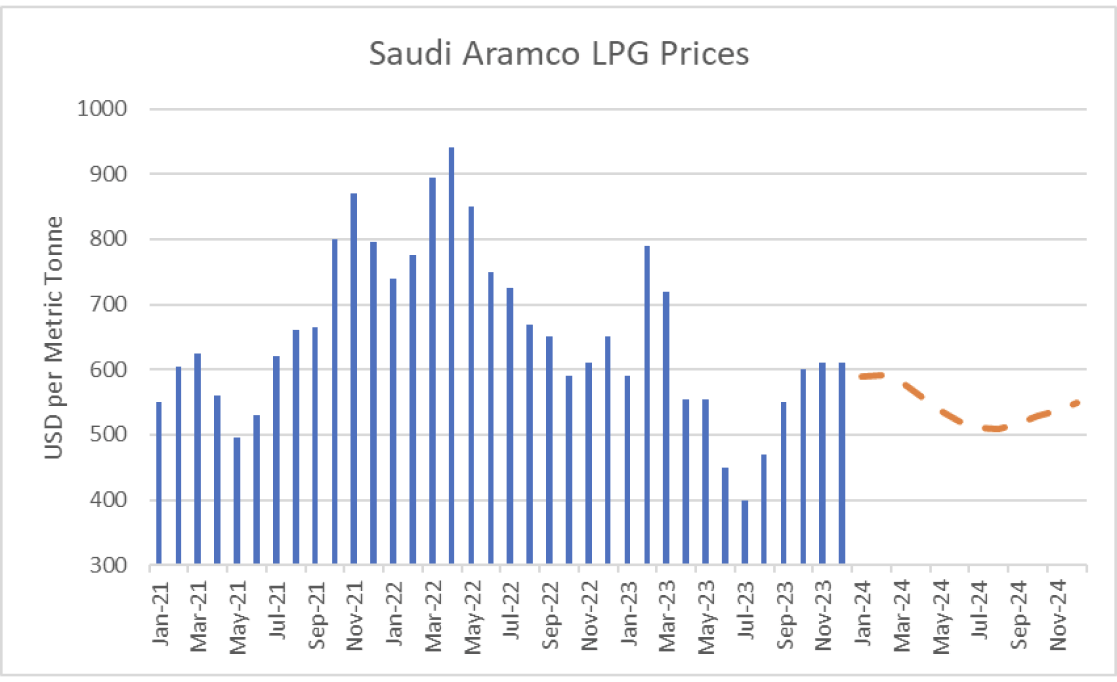
The other main contributing factor to LPG prices in New Zealand is the exchange rate against the USD. As shown below this has been falling over the last few years adding to domestic LPG prices.
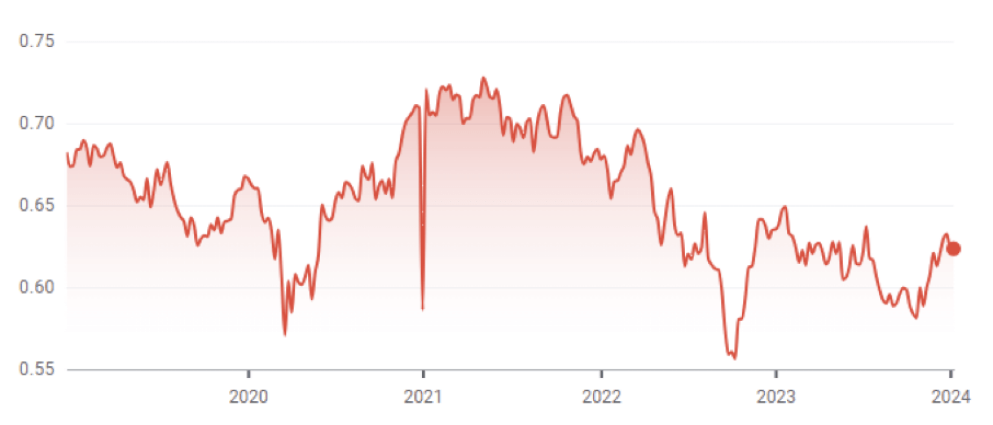
The Coal Market
The global energy crisis has been as much about coal as it has gas. The war in the Ukraine has driven energy prices, including coal, up. Prices in December increased, ending the month at US$148/T – an 11% increase on the November close. These prices, though well below the highs of the last 12 months, remain above what we expect to see as shown in the following graph of prices over the last 10 years.
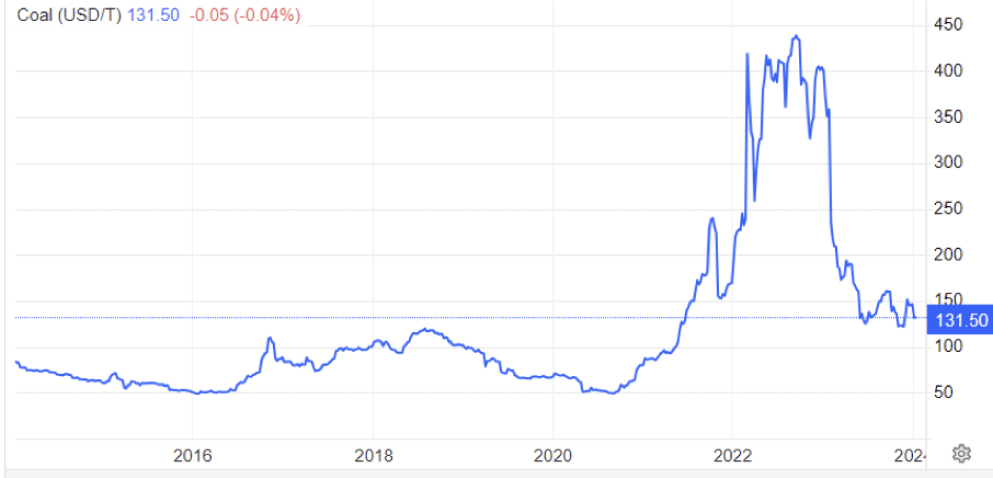
Like gas, the price of coal can flow through and have an impact on the electricity market. However, coal stockpiles at Huntly are at the highest they have been for many years helping to assure the market that there is plenty of fuel available in the event of dry conditions in the hydro catchments.
Carbon Pricing
NZ has had an Emissions Trading Scheme (ETS) in place since 2008. It has been subsequently reviewed by several governments and is now an “uncapped” price scheme closely linked to international schemes. However, there are “upper and lower guard-rails” set up to prevent wild swings in carbon price that act as minimum and maximum prices. These increased in December 2023 to $173 and $64 respectively. Carbon prices fell 10% in December to $68.5.
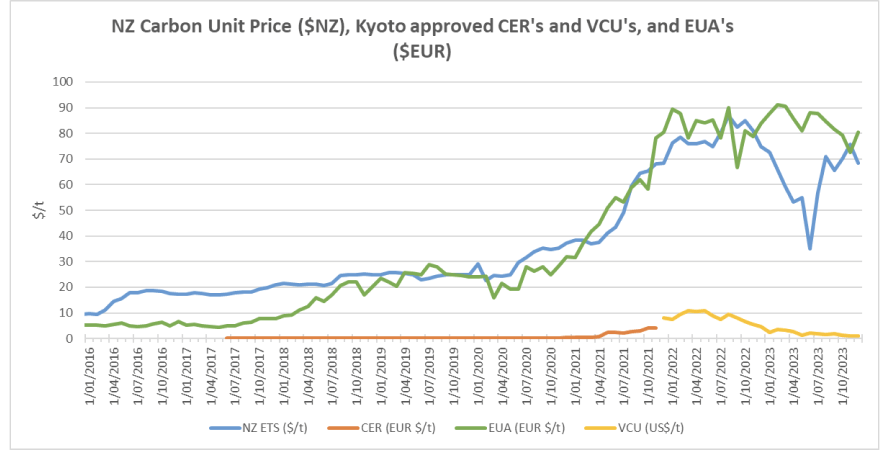
As the carbon price rises, the cost of coal, gas or other fossil fuels used in process heat applications will naturally also rise. Electricity prices are also affected by a rising carbon price. Electricity prices are set by the marginal producing unit – in NZ this is currently typically coal or gas or hydro generators, with the latter valuing the cost of its water against the former. An increase in carbon price can lead to an increase in electricity prices in the short to medium term (as the marginal units set the price). A carbon price of $50/t is estimated to currently add about $25/MWh (or ~2.5c/kWh) to electricity prices. In the long term the impact should reduce as money is invested in more low-cost renewables and there is less reliance on gas and coal fired generation.
EU Carbon Permits increased in December to 80 Euro/tonne – up 11%.
About this Report
This energy market summary report provides information on wholesale price trends within the NZ Electricity Market.
Please note that all electricity prices are presented as a $ per MWh price and all carbon prices as a $ per unit price.
All spot prices are published by the Electricity Authority. Futures contract prices are sourced from ASX.
Further information can be found at the locations noted below.
- Transpower publishes a range of detailed information which can be found here: https://www.transpower.co.nz/power-system-live-data
- The Electricity Authority publishes a range of detailed information which can be found here: https://www.emi.ea.govt.nz/
- Weather and Climate data – The MetService publishes a range of weather-related information which can be found here: https://www.metservice.com/
Disclaimer
This document has been prepared for information and explanatory purposes only and is not intended to be relied upon by any person. This document does not form part of any existing or future contract or agreement between us. We make no representation, assurance, or guarantee as to the accuracy of the information provided. To the maximum extent permitted by law, none of Smart Power Ltd, its related companies, directors, employees or agents accepts any liability for any loss arising from the use of this document or its contents or otherwise arising out or, or in connection with it. You must not provide this document or any information contained in it to any third party without our prior consent.
About Smart Power
Smart Power is a full-service Energy Management consultancy. Apart from Energy Procurement, Smart Power can also provide:
- Technical Advice on how to reduce your energy use/emissions
- Sustainability Reporting
- Invoice Management services.
We also offer boutique energy and water billing service for landlords/property developers.
Contact us at https://smartpower1.wpenginepowered.com/contact/ or ring one of our offices to talk to one of our experienced staff about how we can assist you with achieving your energy goals.
© Copyright, 2024. Smart Power Ltd
Market Update November 2023
The Wholesale Electricity Market
Spot prices in the wholesale electricity market increased through November. Average spot prices ranged from $127 in the lower South Island (up from $106 in October), up to $154 in the upper North Island (up from $133).
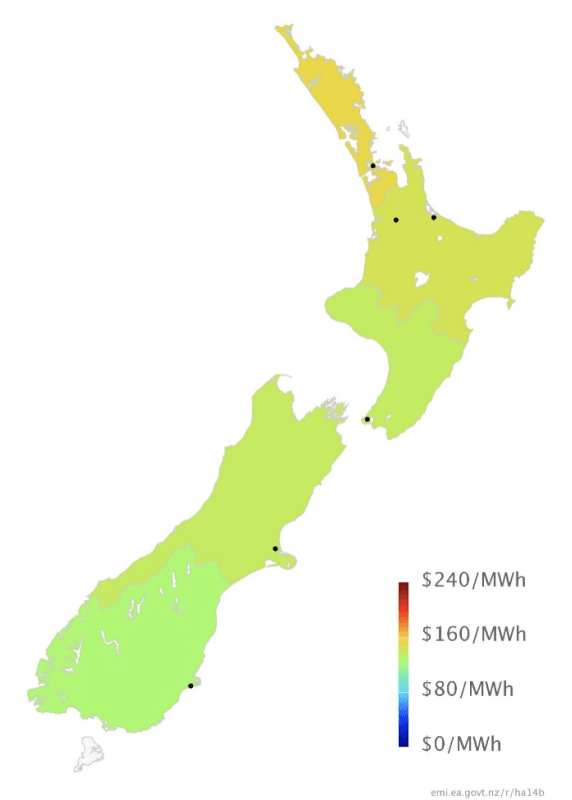
The following chart shows average weekly spot prices over the last 2 years. The sudden drop in prices in the middle of September can be clearly seen as is the recovery in prices since then.
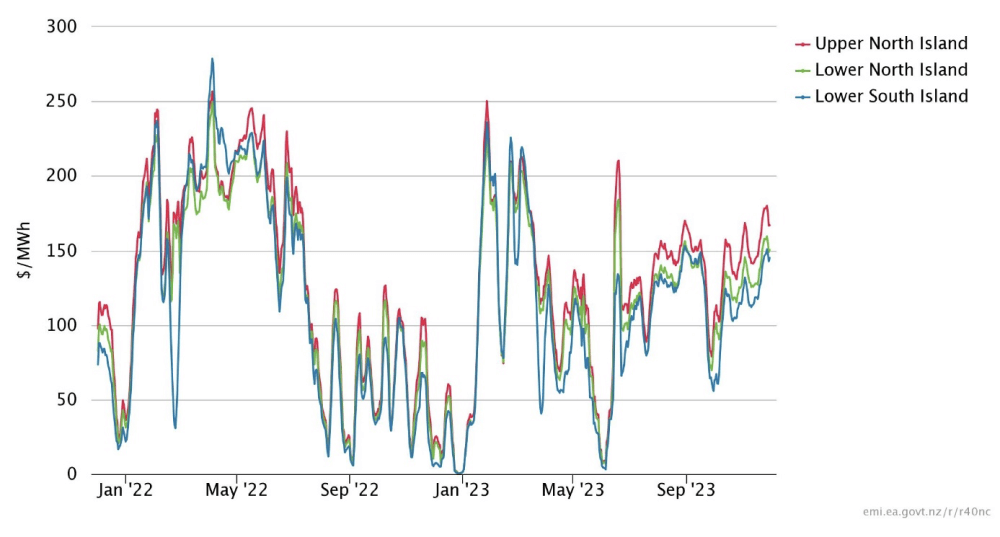
Electricity Demand
Electricity demand in November was on a par with recent years, falling as we head toward the warmer summer period.
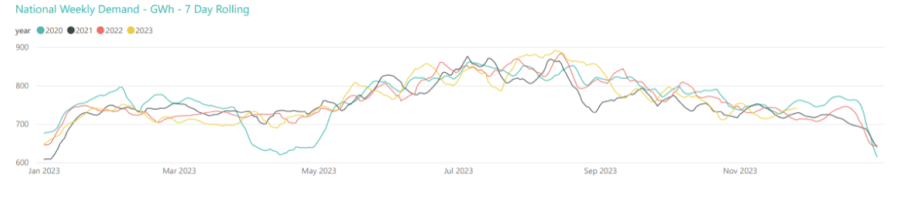
Electricity Generation Mix
The lower level of demand and increased wind generation saw thermal generation remain at the low levels observed last month.
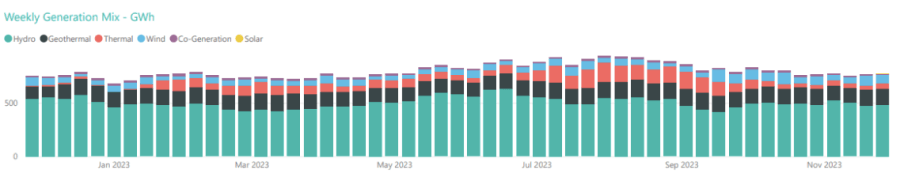
HVDC Transfer
Power transfers on the HVDC link connecting the North and South Islands are important both in showing relative hydro positions and the reliance on thermal power to meet demand. High northward flow tends to indicate a good SI hydro position, whereas the reverse indicates a heavy reliance on thermal power to make up for hydro shortages.
November saw northward transfer continue at the reasonably high levels seen through October at the start of the month, before reducing in the second half of the month. Southward transfer remained minimal.
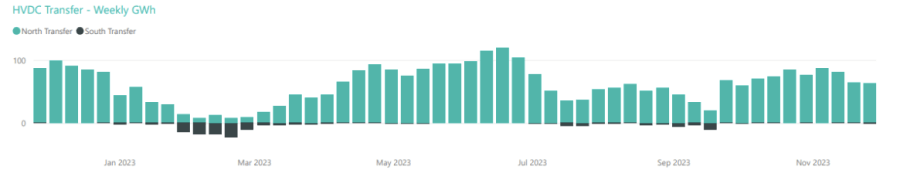
The Electricity Futures Market
The Futures Market provides an indication of where market participants see the spot market moving in the future. They are based on actual trades between participants looking to hedge their positions (as both buyers and sellers) into the future against potential spot market volatility. They are also a useful proxy for the direction of retail contracts.
The following graph shows Futures pricing for CY 2024, 2025, 2026 and 2027 at Otahuhu (Auckland) for the last 2 years.
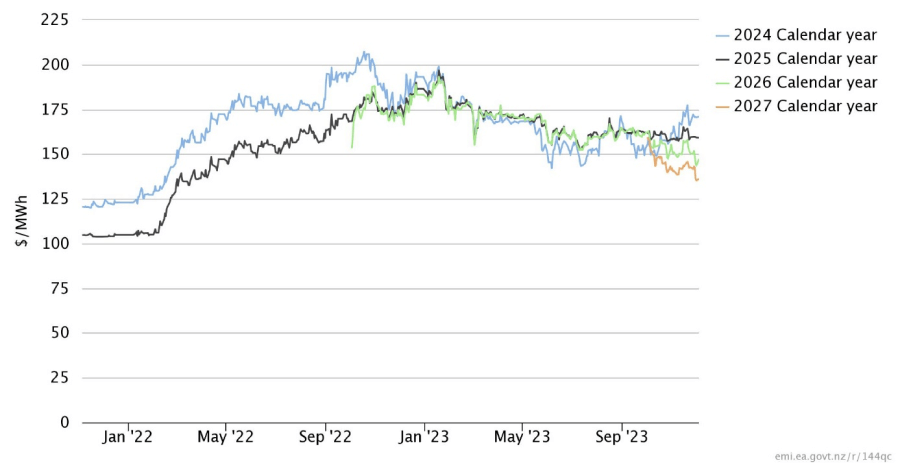
Note that $100/MWh equates to 10c/kWh.
Forward prices were up for near future years but fell for latter years. CY 2024 closed at $171/MWh (+6%), while CY 2025 was at $159.5 (+1%). CY 2026 prices was down 6% at $145 and CY 2027 closed at $136/MWh (-3.5%).
Known new generation projects are shown below (additions / removals highlighted in bold).
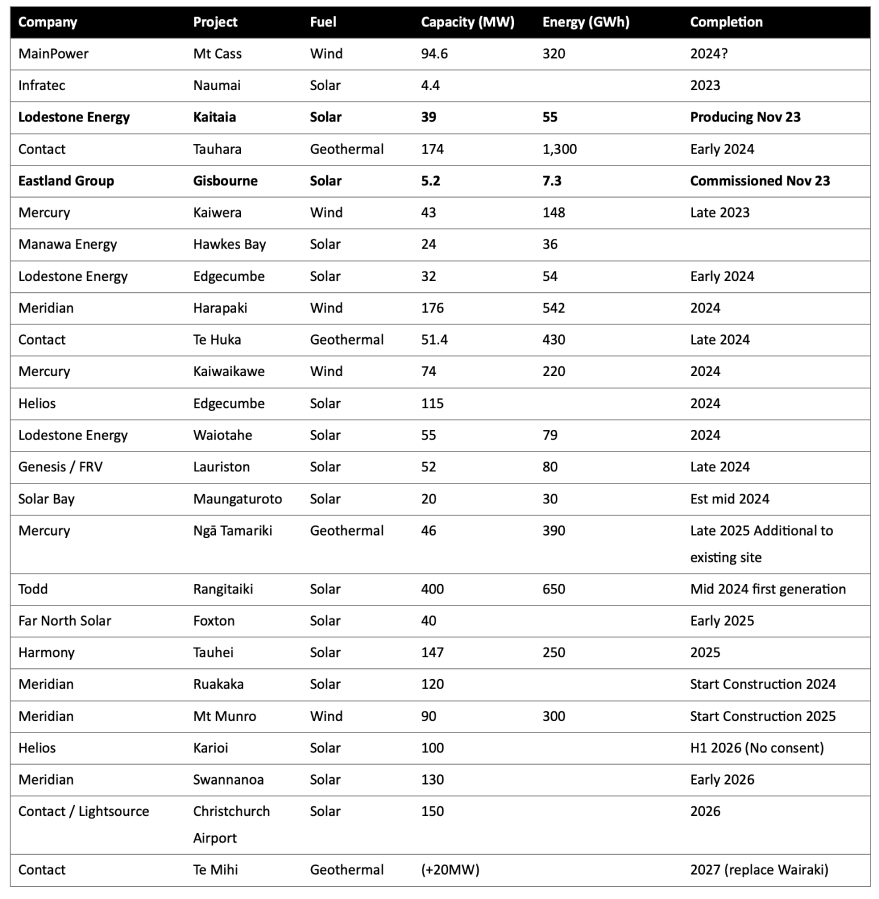
Hydro Storage
Inflows were below average in both the North and South Island through November as shown in the following charts.
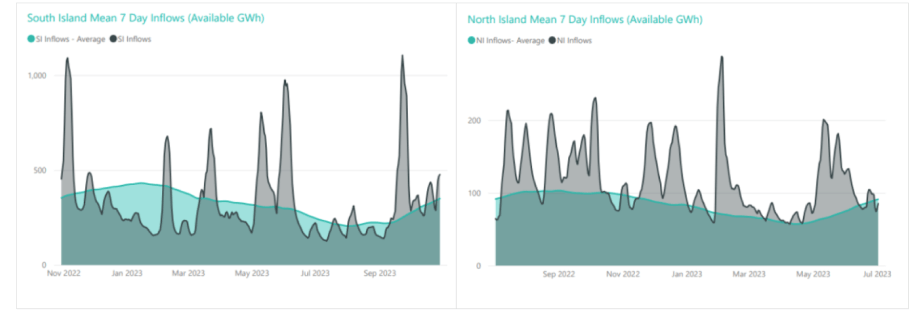
Below average November inflows resulted in energy storage levels in New Zealand’s main hydro storage lakes decreasing through the month. Storage ended the month at 2,838GWh or 64% full, down 177GWh. The following chart shows the latest breakdown of storage across the main hydro catchments.
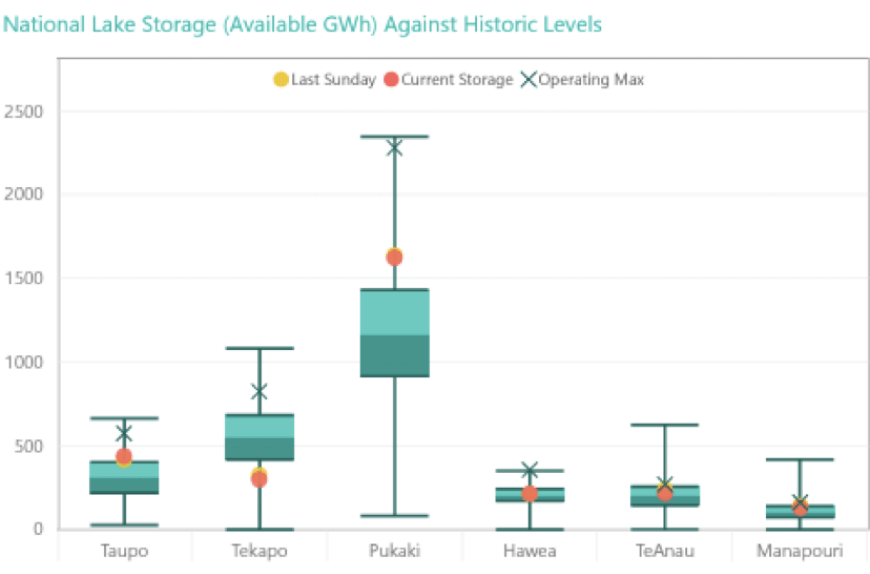
Security of supply risks increased in November with storage levels decreasing. We are now slightly below the level we would typically expect to see for this time of year; but remain well above the risk zones. This is shown in the following risk curves.
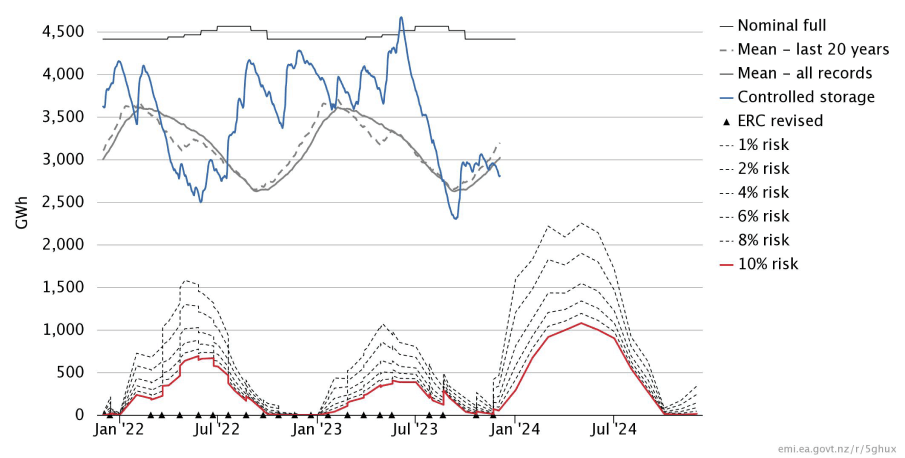
Snow Pack
Snowpack is an important way that hydro energy is stored over the winter months and released as hydro inflows in the spring. The following graph shows that the snowpack in the important Waitaki catchment is currently slightly below mean levels seen in the last 30 years for this time of year.
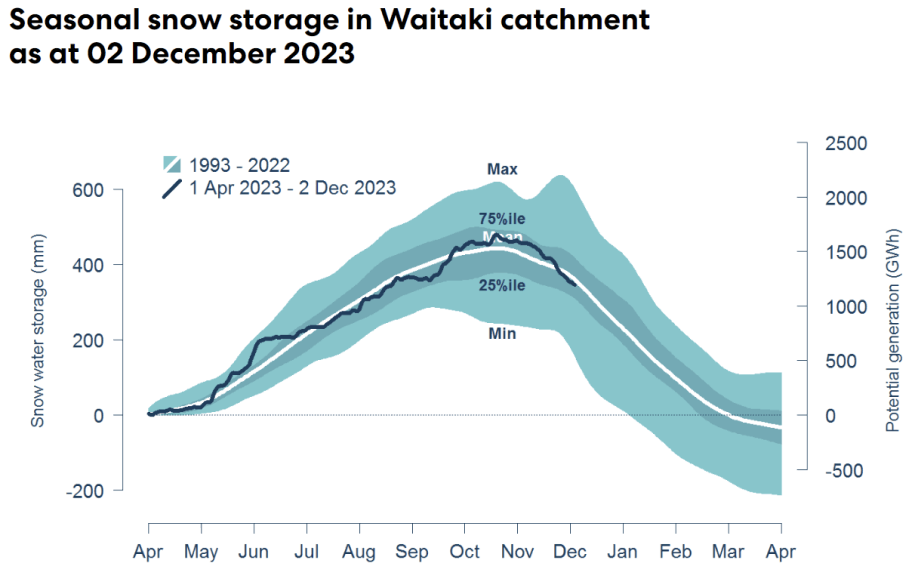
Climate outlook overview (from the MetService)
Climate Drivers — Whilst El Nino remains an important player for NZ, the Madden-Julian Oscillation (MJO), a climate driver tracked across the equator, looks set to help shake up the weather maps early in December, much like it did in November. A pulse of the MJO will move from the Maritime Continent (Southeast Asia) into the Western Pacific during the first half of the month. This will lead to more low pressure across the Australasian/NZ regions, with the belt of higher pressure likely displaced further southwards across South Island, similar to November, at least initially. El Nino is expected to peak in January 2024, continuing through into the autumn months. NZ typically sees the strongest effects of El Nino during late summer/early autumn.
December 2023 Outlook — As noted above, the MJO looks likely to help drive a rather unsettled opening to December, although the South Island might tap into drier weather under that southern ridge more often than not. A couple separate Tasman Sea low pressure systems from the weekend of the 2nd/3rd into the following week look likely to bring rainfall right across the country, but especially across North Island. If the second of these makes a connection with an increasingly active tropics to the north, we may well see some notably heavy falls for northern and northeastern portions of North Island too, but this remains far from certain at this early stage. Keeping a close eye on tropical developments to our north will be important through the first half of December. Heading beyond mid-month, higher than normal pressures are gradually favoured to return across the Tasman Sea, and to the north of New Zealand, with a more westerly pattern redeveloping across the South Island. This pattern is much more typical of El Nino, as the MJO pulse departs eastward. This will be welcome news for those of us across central and northern NZ who are hoping for some more prolonged sunshine as the summer holidays get started and hay-making season ramps up. These synoptic patterns even offer some early hope of a dry Christmas Day BBQ in these regions! Rainfall should become more frequent again for western and southern South Island though. With a predominantly westerly flow, eastern sections of South Island may well be in for some very hot early summer days alongside long dry runs too.
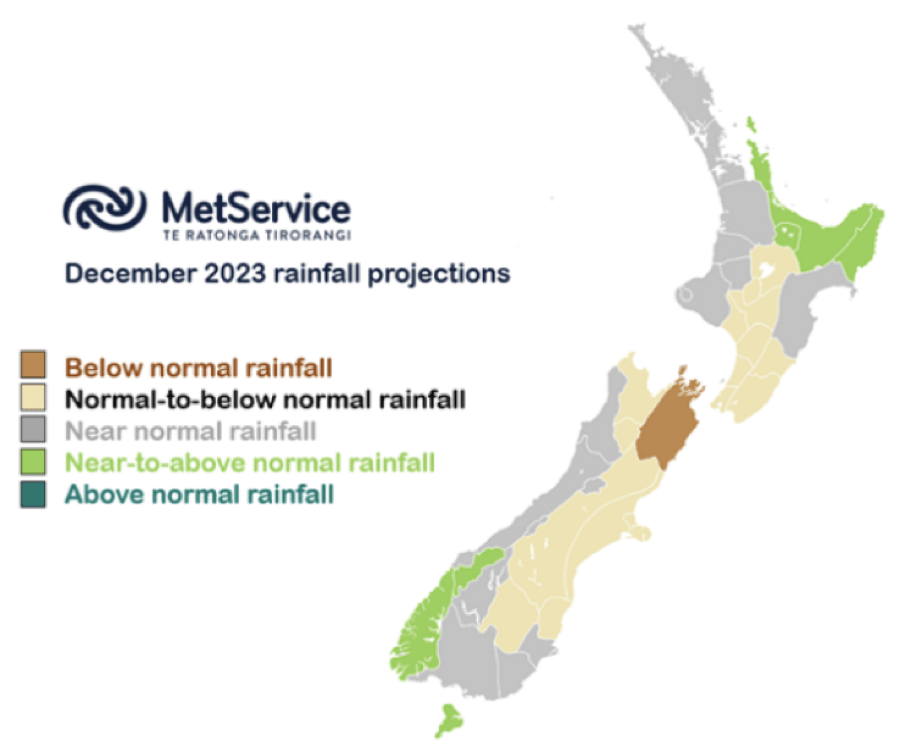
The Wholesale Gas Market
Spot gas prices jumped in November averaging $13.5/GJ – an increase of 27% in the month. Wholesale prices are now about 7% higher than they were at the same time last year.
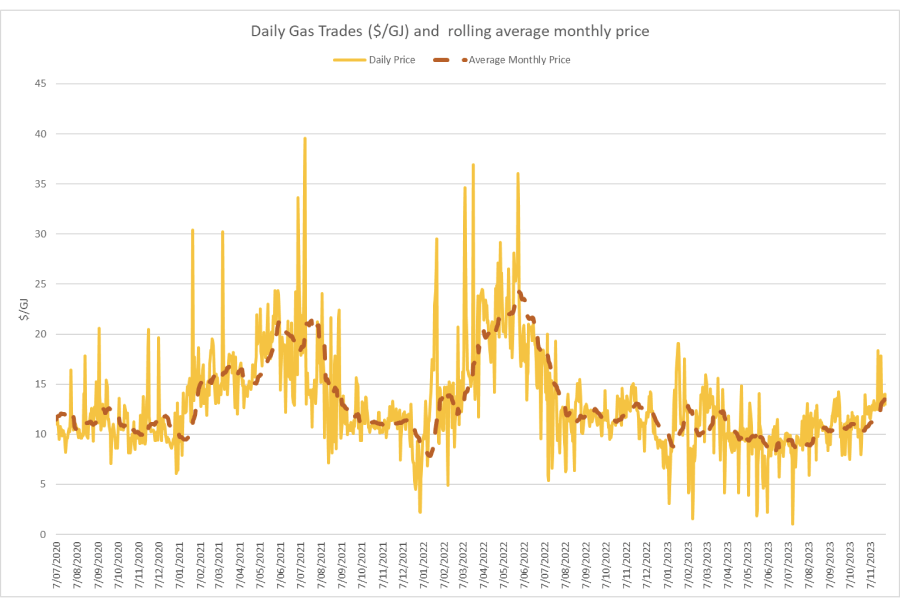
On the supply side the major constraint was the outage at Kupe taking production to zero for the whole of the month. All other fields had declining production through the month – Maui output averaging 97TJ/day (down 3%). Pohokura was down, averaging 66TJ/day (-7.5%), as was McKee / Mangahewa, down slightly at around 71.5TJ/day in November (-3% from October levels).
The following graph shows production levels from major fields over the last 4 years.
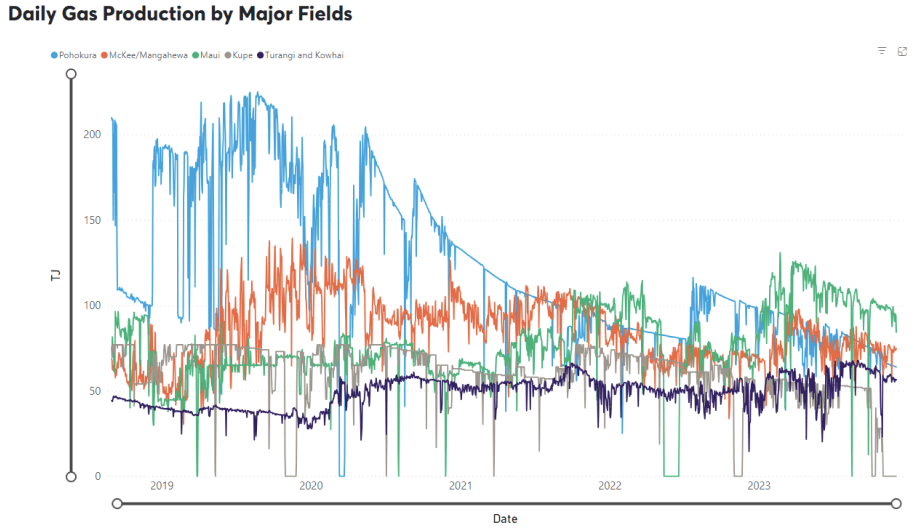
On the demand side, Methanex Motonui’s usage decreased in November to around 140TJ/day for most of the month. Huntly power station gas use reduced during the month, averaging 21TJ/day. TCC remained switched off all month.
The following graph shows trends in the major gas users over the last 4 years.
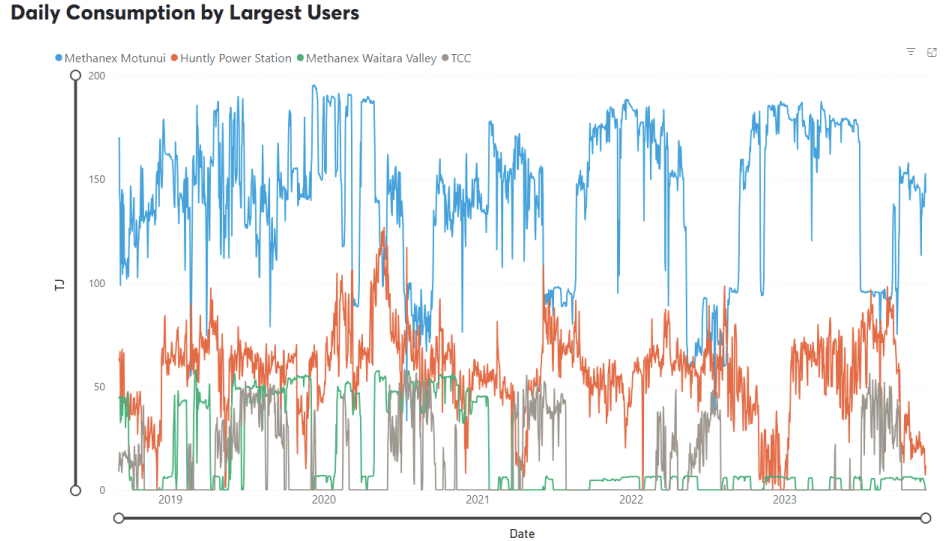
Internationally, LNG netback prices ended the month at $21.91GJ – up again 22% from last month. Forecast 2023 netback prices were also up marginally at $20 – + 1% on what the ACCC was forecasting in October. Forecast prices for 2024 fell sharply to $18.6 – down 20% compared to October.
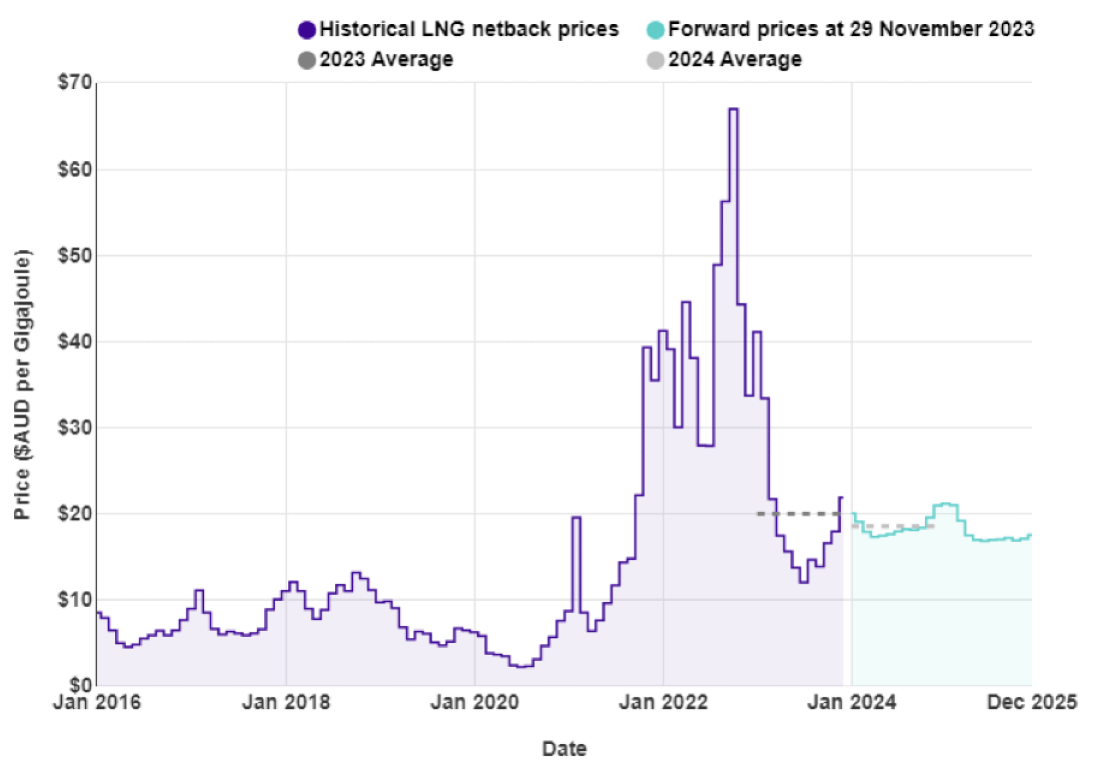
New Zealand does not have an LNG export market, so our domestic prices are not directly linked to global prices. However, some of our large gas users deal in international markets which are impacted by global gas prices, and they may try to produce more in NZ (increase demand) to take advantage of lower gas prices.
LPG is an important fuel for many large energy users, particularly in areas where reticulated natural gas is not available. The contract price of LPG is typically set by international benchmarks such as the Saudi Aramco LPG – normally quoted in US$ per metric tonne.
The following graph shows the Saudi Aramco LPG pricing for the last 3 years as well as forecast pricing for the year ahead.
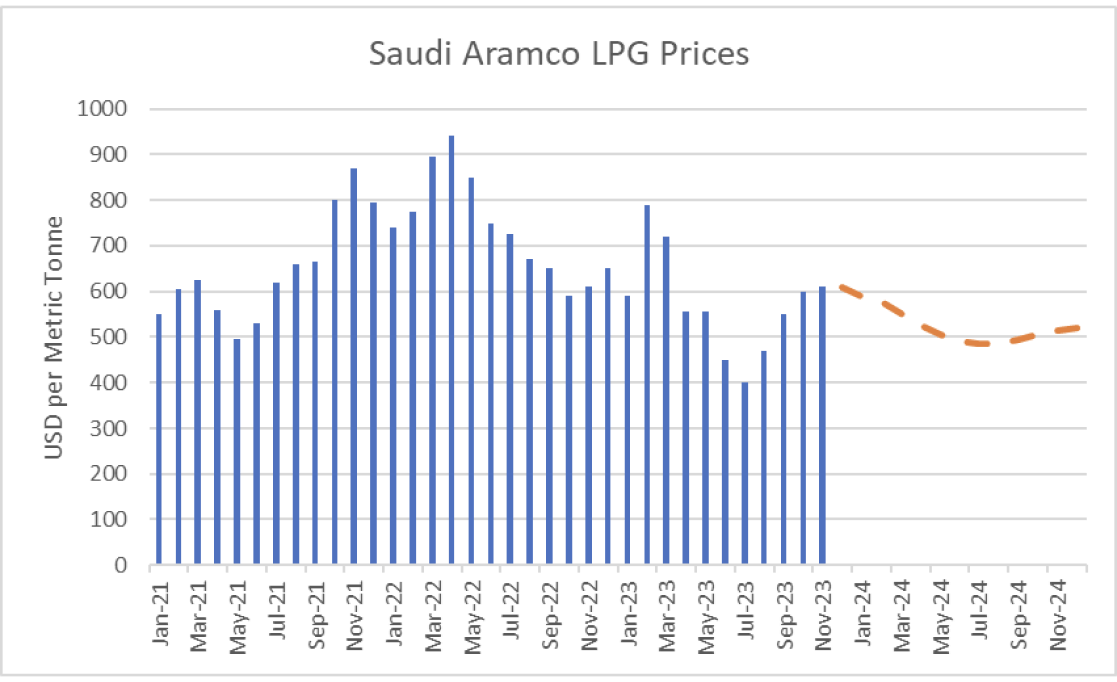
The other main contributing factor to LPG prices in New Zealand is the exchange rate against the USD. As shown below this has been falling over the last few years adding to domestic LPG prices.
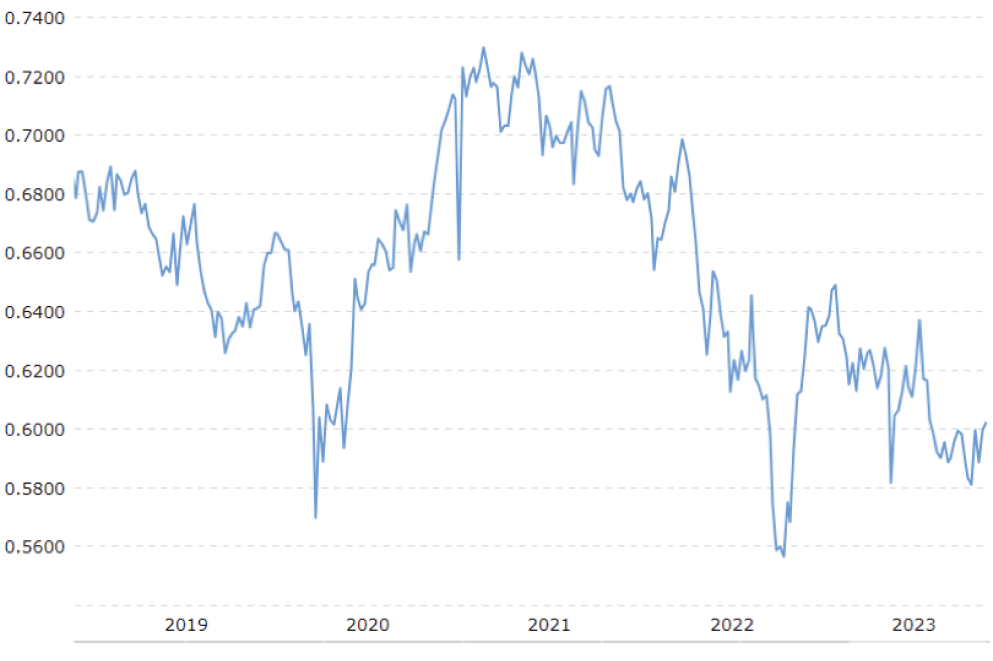
The Coal Market
The global energy crisis has been as much about coal as it has gas. The war in the Ukraine has driven energy prices, including coal, up. Prices in November increased, ending the month at US$133.5/T – a 14% decrease on the October close. These prices, though well below the highs of the last 12 months, remain above what we expect to see as shown in the following graph of prices over the last 10 years.
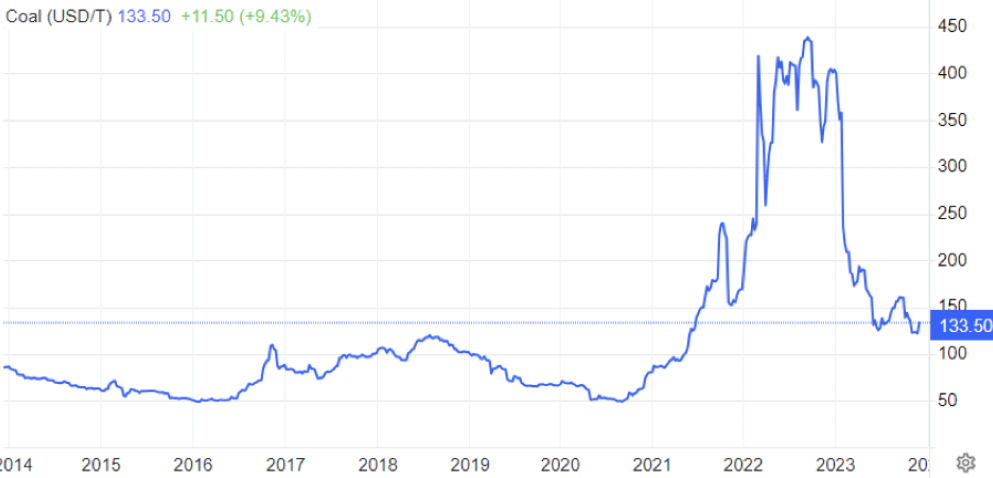
Like gas, the price of coal can flow through and have an impact on the electricity market. However, coal stockpiles at Huntly are at the highest they have been for many years helping to assure the market that there is plenty of fuel available in the event of dry conditions in the hydro catchments.
Carbon Pricing
NZ has had an Emissions Trading Scheme (ETS) in place since 2008. It has been subsequently reviewed by several governments and is now an “uncapped” price scheme closely linked to international schemes. However, there are “upper and lower guard-rails” set up to prevent wild swings in carbon price that act as minimum and maximum prices. Currently these are set at $82 and $33 respectively, however they are going to increase in December after the Government recently accepted the Climate Change Commission’s recommendations to tighten the auction scheme. Carbon prices continued to increase in November, climbing a further 8% to $76.
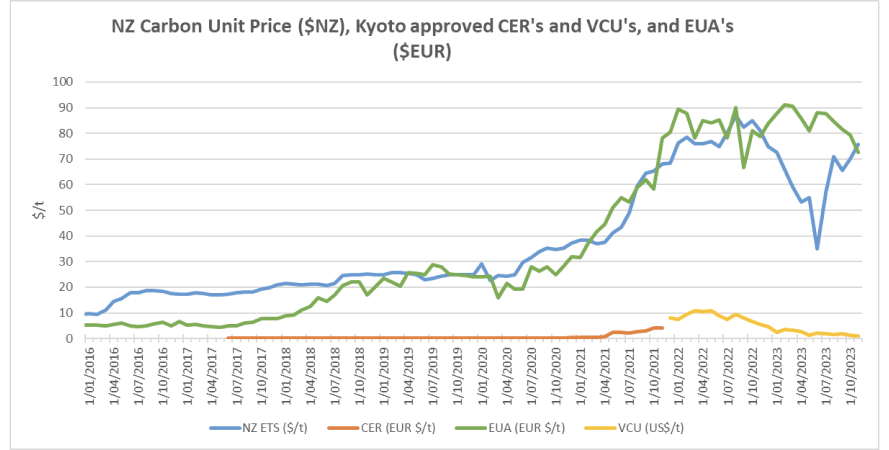
As the carbon price rises, the cost of coal, gas or other fossil fuels used in process heat applications will naturally also rise. Electricity prices are also affected by a rising carbon price. Electricity prices are set by the marginal producing unit – in NZ this is currently typically coal or gas or hydro generators, with the latter valuing the cost of its water against the former. An increase in carbon price can lead to an increase in electricity prices in the short to medium term (as the marginal units set the price). A carbon price of $50/t is estimated to currently add about $25/MWh (or ~2.5c/kWh) to electricity prices. In the long term the impact should reduce as money is invested in more low-cost renewables and there is less reliance on gas and coal fired generation.
EU Carbon Permits decreased further in November to 72.5 Euro/tonne – down 9%.
About this Report
This energy market summary report provides information on wholesale price trends within the NZ Electricity Market.
Please note that all electricity prices are presented as a $ per MWh price and all carbon prices as a $ per unit price.
All spot prices are published by the Electricity Authority. Futures contract prices are sourced from ASX.
Further information can be found at the locations noted below.
- Transpower publishes a range of detailed information which can be found here: https://www.transpower.co.nz/power-system-live-data
- The Electricity Authority publishes a range of detailed information which can be found here: https://www.emi.ea.govt.nz/
- Weather and Climate data – The MetService publishes a range of weather-related information which can be found here: https://www.metservice.com/
Disclaimer
This document has been prepared for information and explanatory purposes only and is not intended to be relied upon by any person. This document does not form part of any existing or future contract or agreement between us. We make no representation, assurance, or guarantee as to the accuracy of the information provided. To the maximum extent permitted by law, none of Smart Power Ltd, its related companies, directors, employees or agents accepts any liability for any loss arising from the use of this document or its contents or otherwise arising out or, or in connection with it. You must not provide this document or any information contained in it to any third party without our prior consent.
About Smart Power
Smart Power is a full-service Energy Management consultancy. Apart from Energy Procurement, Smart Power can also provide:
- Technical Advice on how to reduce your energy use/emissions
- Sustainability Reporting
- Invoice Management services.
We also offer boutique energy and water billing service for landlords/property developers.
Contact us at https://smartpower1.wpenginepowered.com/contact/ or ring one of our offices to talk to one of our experienced staff about how we can assist you with achieving your energy goals.
© Copyright, 2023. Smart Power Ltd
Market Update October 2023
The Wholesale Electricity Market
Spot prices in the wholesale electricity market were relatively unchanged through October. Average spot prices ranged from $106 in the lower South Island (down from $110 in September), up to $133 in the upper North Island (up from $127).
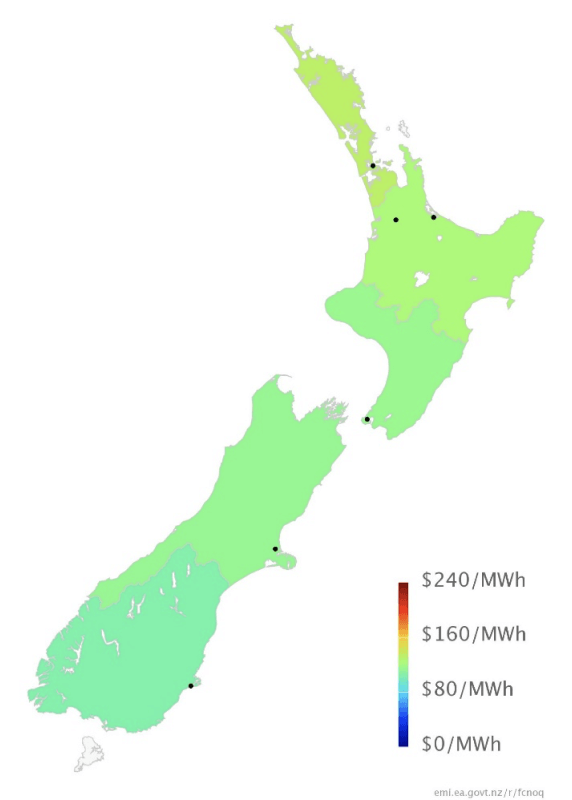
The following chart shows average weekly spot prices over the last 2 years. The sudden drop in prices in the middle of September can be clearly seen as is the recovery in prices since then.
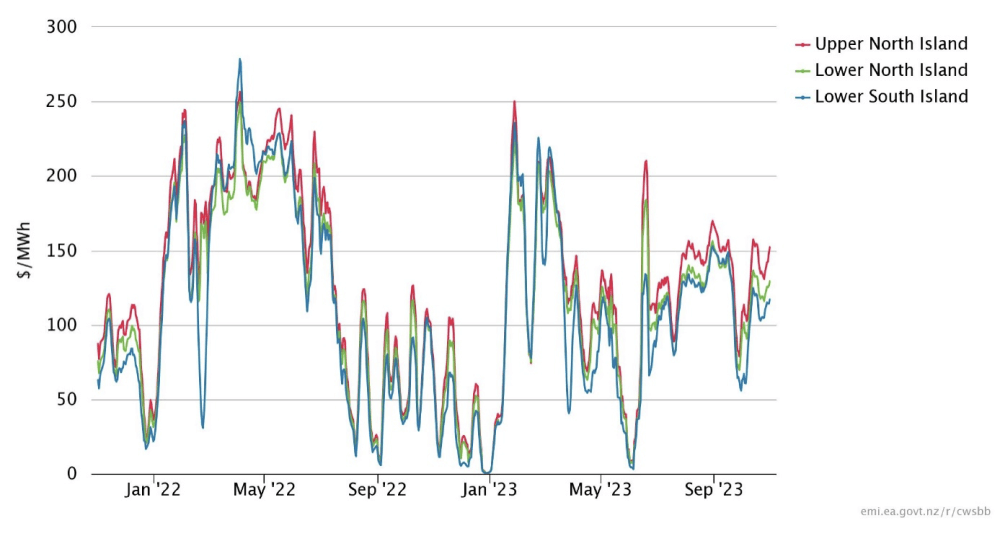
Electricity Demand
Electricity demand in early October was on a par with recent year before dropping to lower levels at the end of the month.
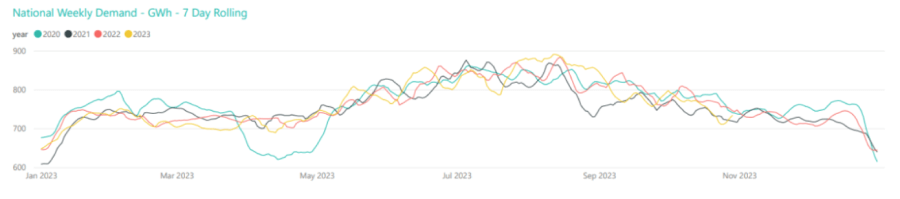
Electricity Generation Mix
Lower demand and increased wind and hydro generation saw thermal generation reduce to very low levels through October. The last week saw almost 95% of generation coming from renewable sources.
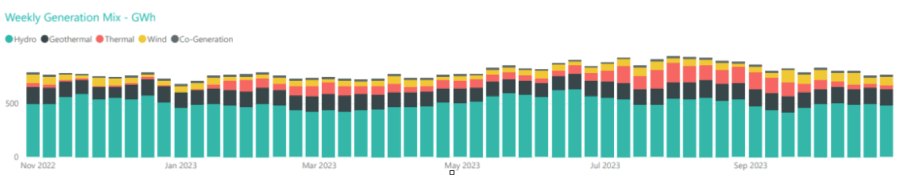
HVDC Transfer
Power transfers on the HVDC link connecting the North and South Islands are important both in showing relative hydro positions and the reliance on thermal power to meet demand. High northward flow tends to indicate a good SI hydro position, whereas the reverse indicates a heavy reliance on thermal power to make up for hydro shortages.
October saw northward transfer continue at the reasonably high levels seen at the end of September. Southward transfer was minimal.
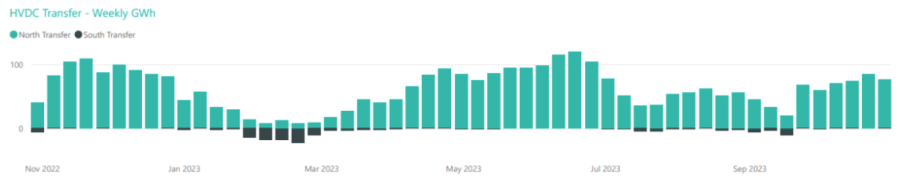
The Electricity Futures Market
The Futures Market provides an indication of where market participants see the spot market moving in the future. They are based on actual trades between participants looking to hedge their positions (as both buyers and sellers) into the future against potential spot market volatility. They are also a useful proxy for the direction of retail contracts.
The following graph shows Futures pricing for CY 2024, 2025, 2026 and 2027 at Otahuhu (Auckland) for the last 2 years.
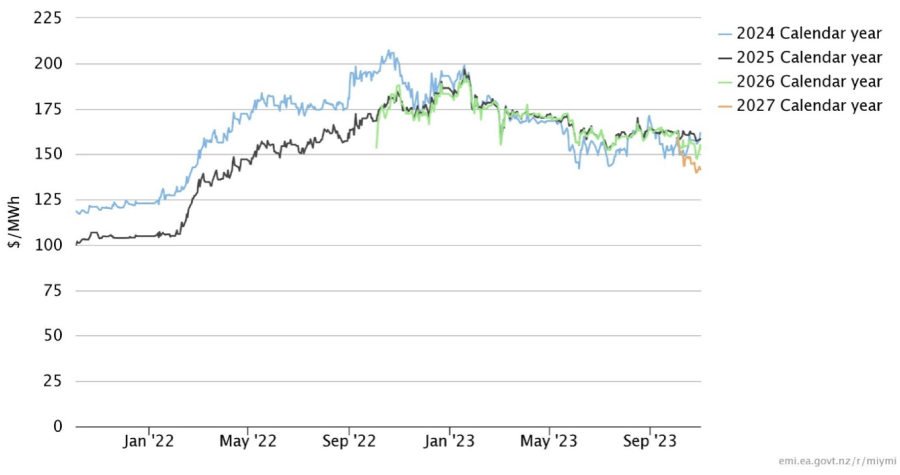
Note that $100/MWh equates to 10c/kWh.
Future prices increased for CY 2024, but was down for all other years. CY 2024 closed at $162/MWh (+6%). CY 2025 was at $158 (-2%) while CY 2026 prices was down 4% at $155. CY 2027 has just been started to be published in October – currently it is at $141/MWh (-11%).
Known new generation projects are shown below (additions / removals highlighted in bold).
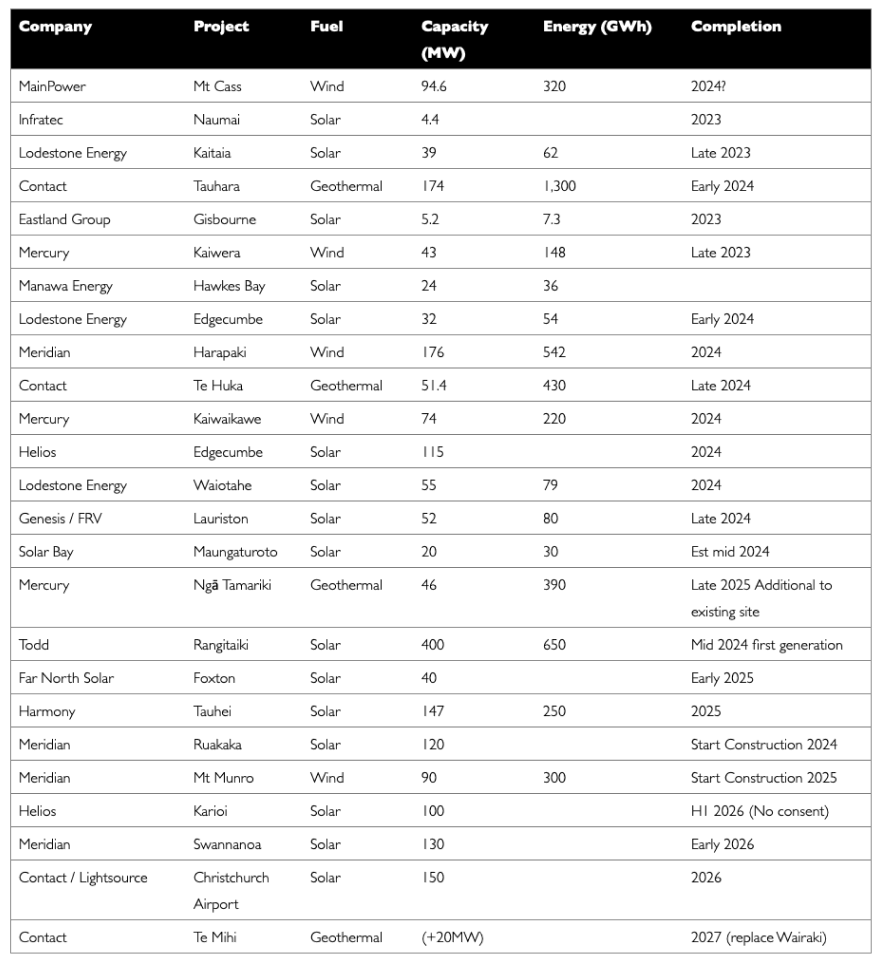
Hydro Storage
Inflows were close to average or above average in the South Island through October. Transpower has not updated NI inflows since July, however we can assume by how Taupo storage has slightly increased through the month that inflows were close to or above average for the time of year.
Close to or above average October inflows resulted in energy storage levels in New Zealand’s main hydro storage lakes increasing through the month. Storage ended the month at 3,051GWh or 69% full, up 124GWh. The following chart shows the latest breakdown of storage across the main hydro catchments.
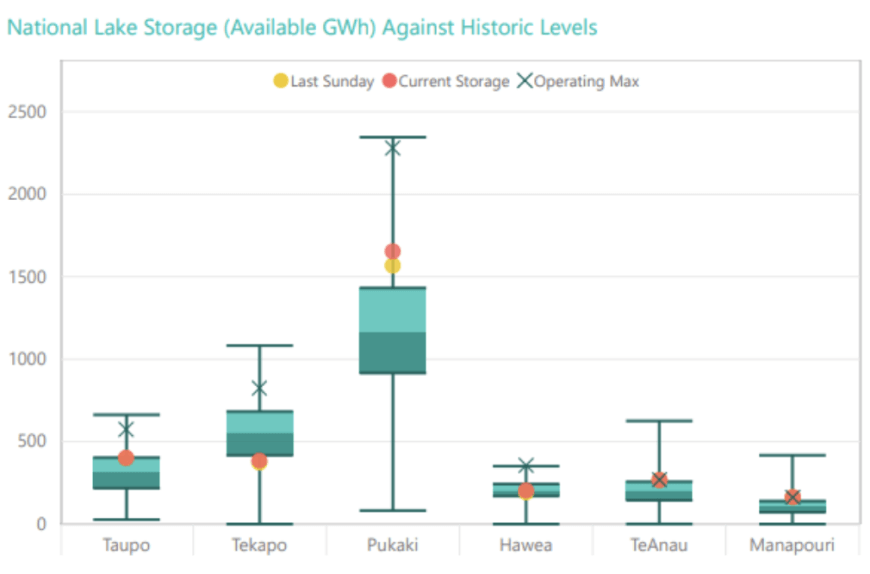
Security of supply risks decreased in October with storage levels increasing. We remain slightly above the level we would typically expect to see for this time of year; and remain well above the risk zones. This is shown in the following risk curves.
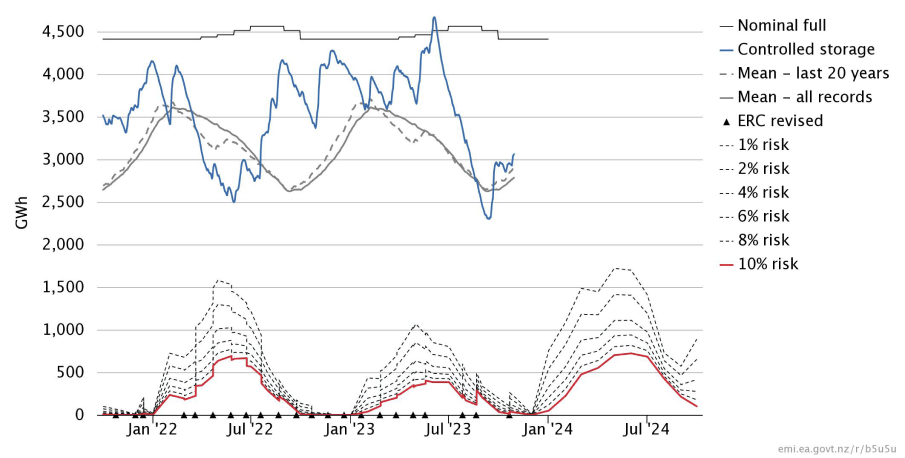
Snow Pack
Snowpack is an important way that hydro energy is stored over the winter months and released as hydro inflows in the spring. The following graph shows that the snowpack in the important Waitaki catchment is currently slightly above mean levels seen in the last 30 years for this time of year.
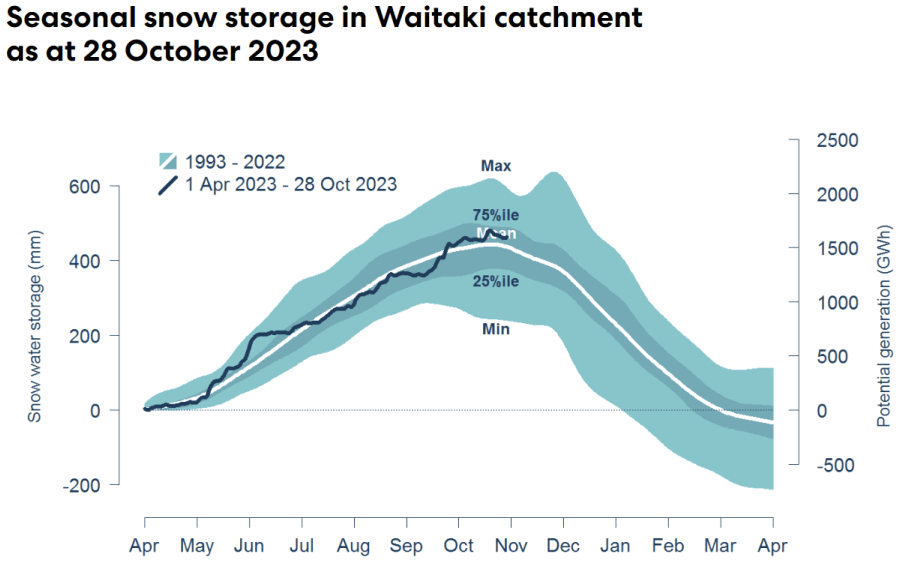
Climate outlook overview (from the MetService)
Climate Drivers — Sea surface temperatures in the equatorial Pacific Ocean NINO3.4 area continue to exceed 1.5C degrees above average, meeting the strong El Nino criterion. All climate models strengthen the event further, between now and its likely peak around Christmas, with most models forecasting an intense El Nino event for summer. Additionally, the positive Indian Ocean Dipole event also enhances the westerly flow of weather across New Zealand, alongside the El Nino.
November 2023 Outlook — November starts off with the remnants of ex-tropical cyclone Lola quickly moving away to the east, although another Tasman Sea low is likely to bring rainfall back onto the country later this week. This rain should particularly favour northern and western parts of the North Island, although some places like Southland and inland Otago could also see brief, but useful bursts for a time as well. Once this low clears away, a longer period of drier and more settled weather is expected country-wide, as a large high builds over New Zealand from the Tasman Sea. Isolated showers could occur under this high, but overall rainfall should be limited for most places. Around mid-month, we may see westerlies returning, resembling October’s predominantly westerly pattern. Fronts might move up the South Island but are likely to weaken quickly as they encounter the high over the North Island. Some of these fronts should bring slightly wetter than normal conditions to the west of the South Island, with the south seeing more uncertainty, coinciding with the return of bursts of gusty westerly winds for many places. Temperatures are forecast run warmer than average through much of the month, although a cooler period might be seen during the start to mid-month under more settled skies.
The Gas Market
Gas prices were flat again in October closing unchanged at $10.6/GJ. Prices are still about 8% lower than they were at the same time last year.
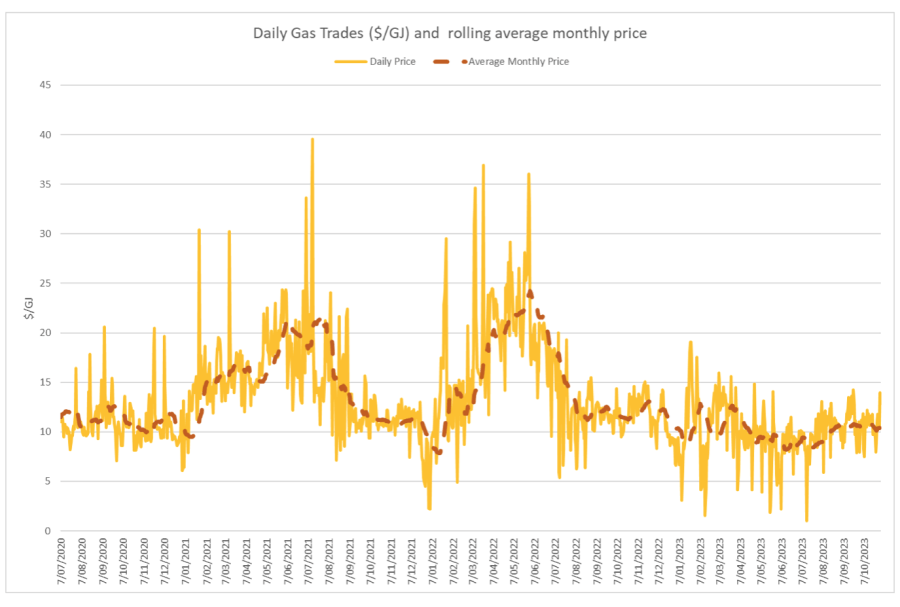
On the supply side, Maui output had a boost in October – averaging just over 100 TJ/day (up 10%). Pohokura was down, averaging 71.5TJ/day (-7%) as was Kupe where preparation work for further drilling resulted in shutdowns and an average 20TJ/day production – down 62%. McKee / Mangahewa was also down slightly at around 74TJ/day in October (-6% from September levels).
The following graph shows production levels from major fields over the last 4 years.
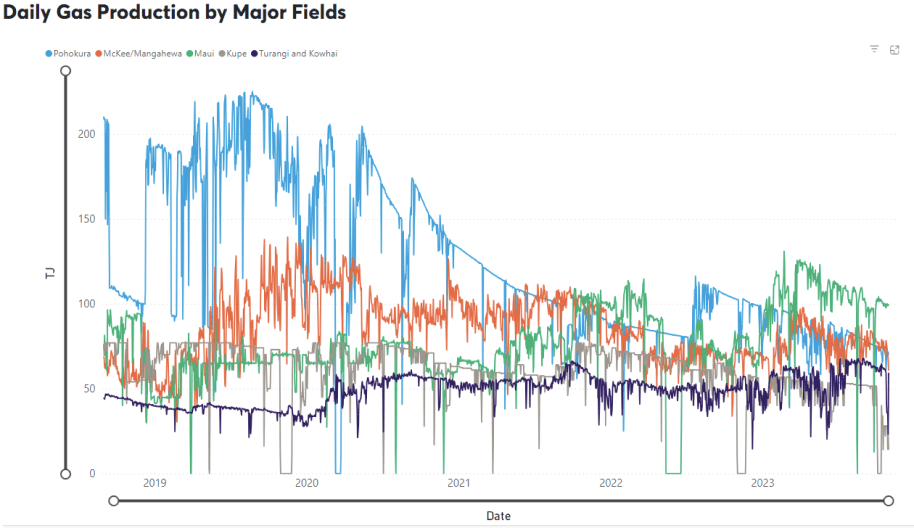
On the demand side, Methanex Motonui’s usage increased in October to around 150TJ/day for most of the month. Huntly power station gas use reduced during the month, averaging less than 30TJ/day. TCC dropped early in the month before being switched off on the 6th October.
The following graph shows trends in the major gas users over the last 4 years.
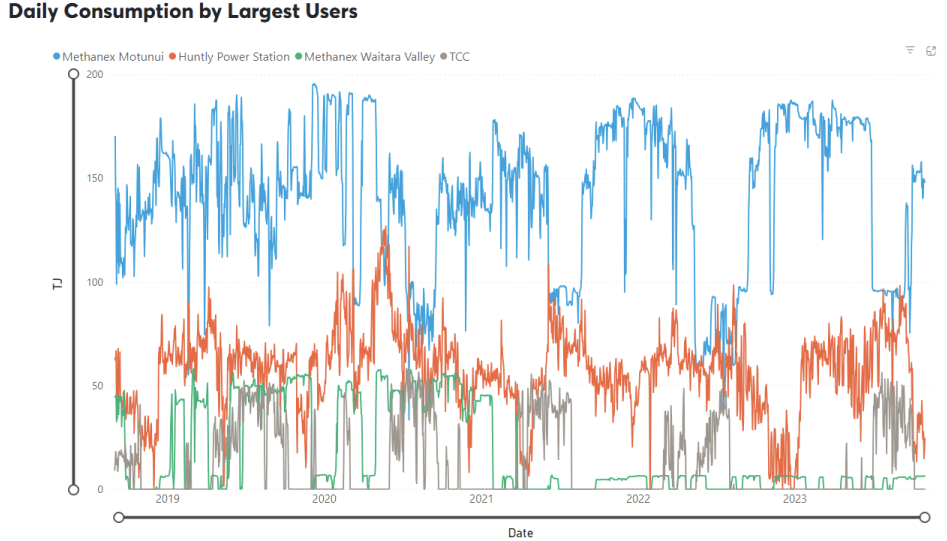
LNG netback prices ended the month at $17.99GJ – up again, 8% from last month. Forecast 2023 netback prices were also up at $19.78 – + 2% on what the ACCC was forecasting in September. Forecast prices for 2024 are now sitting at $23.3 – up 15% compared to September.
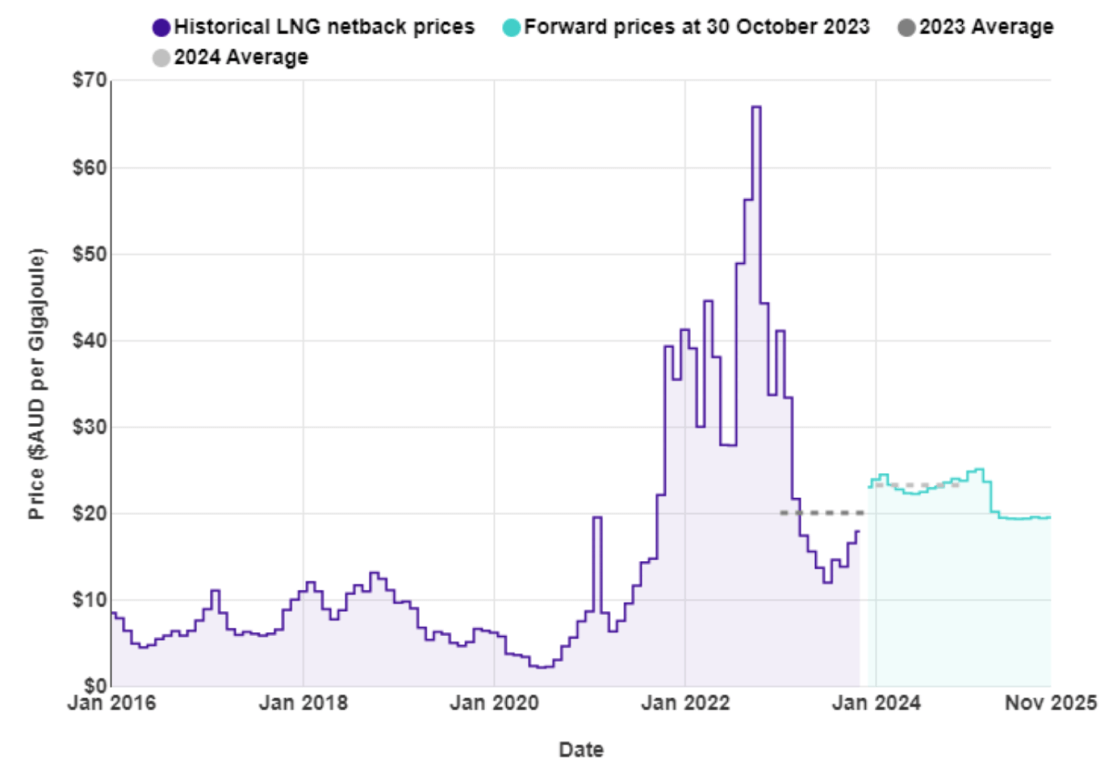
New Zealand does not have an LNG export market, so our domestic prices are not directly linked to global prices. However, some of our large gas users deal in international markets which are impacted by global gas prices, and they may try to produce more in NZ (increase demand) to take advantage of lower gas prices.
The Coal Market
The global energy crisis has been as much about coal as it has gas. The war in the Ukraine has driven energy prices, including coal, up. Prices in October reduced significantly, ending the month at US$117.5/T – a 24% decrease on the September close. These prices, though well below the highs of the last 12 months, remain above what we expect to see as shown in the following graph of prices over the last 10 years.
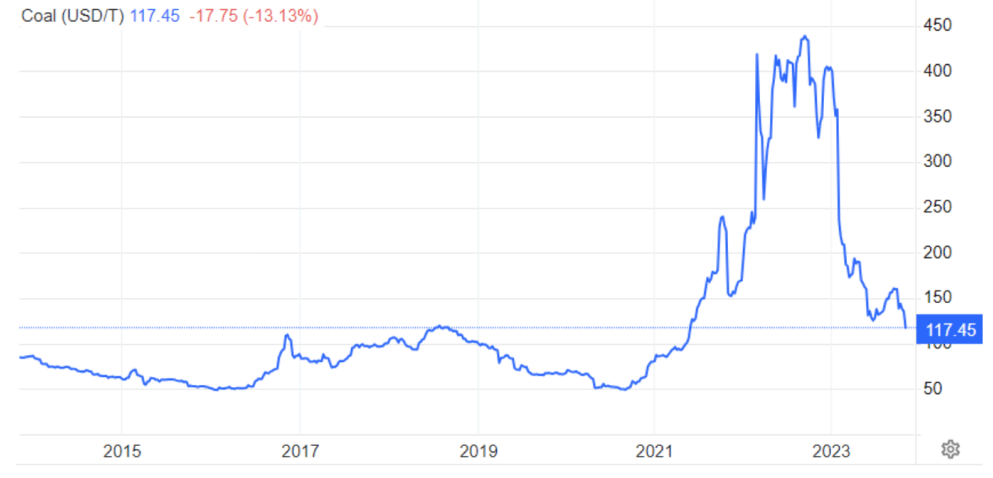
Like gas, the price of coal can flow through and have an impact on the electricity market. However, coal stockpiles at Huntly are at the highest they have been for many years helping to assure the market that there is plenty of fuel available in the event of dry conditions in the hydro catchments.
Carbon Pricing
NZ has had an Emissions Trading Scheme (ETS) in place since 2008. It has been subsequently reviewed by several governments and is now an “uncapped” price scheme closely linked to international schemes. However, there are “upper and lower guard-rails” set up to prevent wild swings in carbon price that act as minimum and maximum prices. Currently these are set at $82 and $33 respectively, however they are going to increase in December after the Government recently accepted the Climate Change Commission’s recommendations to tighten the auction scheme. Carbon prices reversed last month’s drop, increasing 7% back to $70.
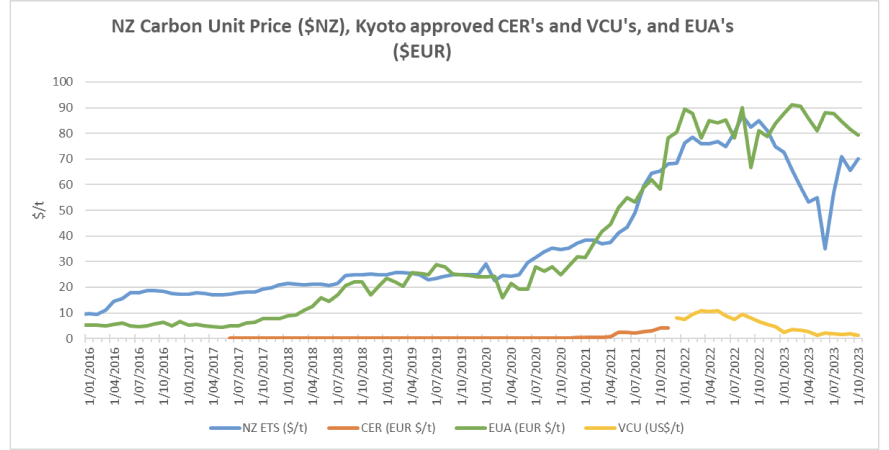
As the carbon price rises, the cost of coal, gas or other fossil fuels used in process heat applications will naturally also rise. Electricity prices are also affected by a rising carbon price. Electricity prices are set by the marginal producing unit – in NZ this is currently typically coal or gas or hydro generators, with the latter valuing the cost of its water against the former. An increase in carbon price can lead to an increase in electricity prices in the short to medium term (as the marginal units set the price). A carbon price of $50/t is estimated to currently add about $25/MWh (or ~2.5c/kWh) to electricity prices. In the long term the impact should reduce as money is invested in more low-cost renewables and there is less reliance on gas and coal fired generation.
EU Carbon Permits decreased a little further in October to 79 Euro/tonne – down 3%.
About this Report
This energy market summary report provides information on wholesale price trends within the NZ Electricity Market.
Please note that all electricity prices are presented as a $ per MWh price and all carbon prices as a $ per unit price.
All spot prices are published by the Electricity Authority. Futures contract prices are sourced from ASX.
Further information can be found at the locations noted below.
- Transpower publishes a range of detailed information which can be found here: https://www.transpower.co.nz/power-system-live-data
- The Electricity Authority publishes a range of detailed information which can be found here: https://www.emi.ea.govt.nz/
- Weather and Climate data – The MetService publishes a range of weather-related information which can be found here: https://www.metservice.com/
Disclaimer
This document has been prepared for information and explanatory purposes only and is not intended to be relied upon by any person. This document does not form part of any existing or future contract or agreement between us. We make no representation, assurance, or guarantee as to the accuracy of the information provided. To the maximum extent permitted by law, none of Smart Power Ltd, its related companies, directors, employees or agents accepts any liability for any loss arising from the use of this document or its contents or otherwise arising out or, or in connection with it. You must not provide this document or any information contained in it to any third party without our prior consent.
About Smart Power
Smart Power is a full-service Energy Management consultancy. Apart from Energy Procurement, Smart Power can also provide:
- Technical Advice on how to reduce your energy use/emissions
- Sustainability Reporting
- Invoice Management services.
We also offer boutique energy and water billing service for landlords/property developers.
Contact us at https://smartpower1.wpenginepowered.com/contact/ or ring one of our offices to talk to one of our experienced staff about how we can assist you with achieving your energy goals.
© Copyright, 2023. Smart Power Ltd
Market Update September 2023
The Wholesale Electricity Market
Spot prices in the wholesale electricity market eased through September. Average spot prices ranged from $110 in the lower South Island (down from $131 in August), up to $127 in the upper North Island (down from $149).
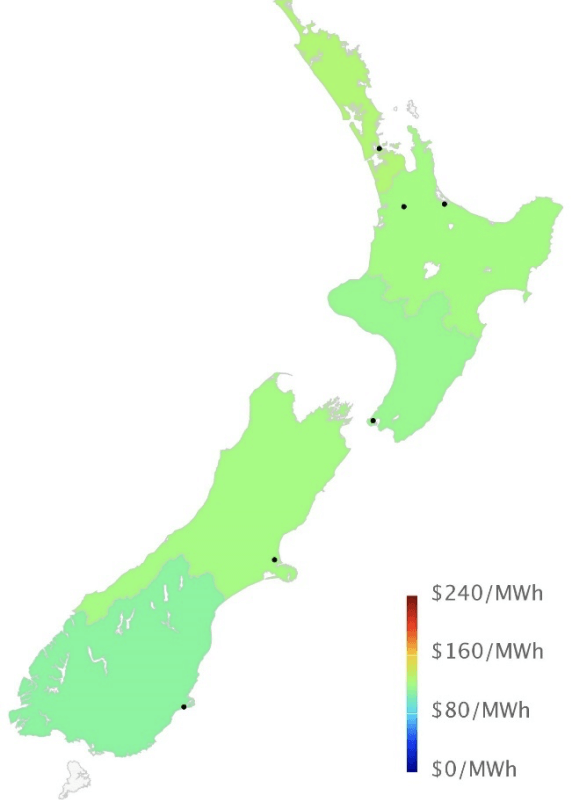
The following chart shows average weekly spot prices over the last 2 years. The sudden drop in prices in the middle of September can be clearly seen.
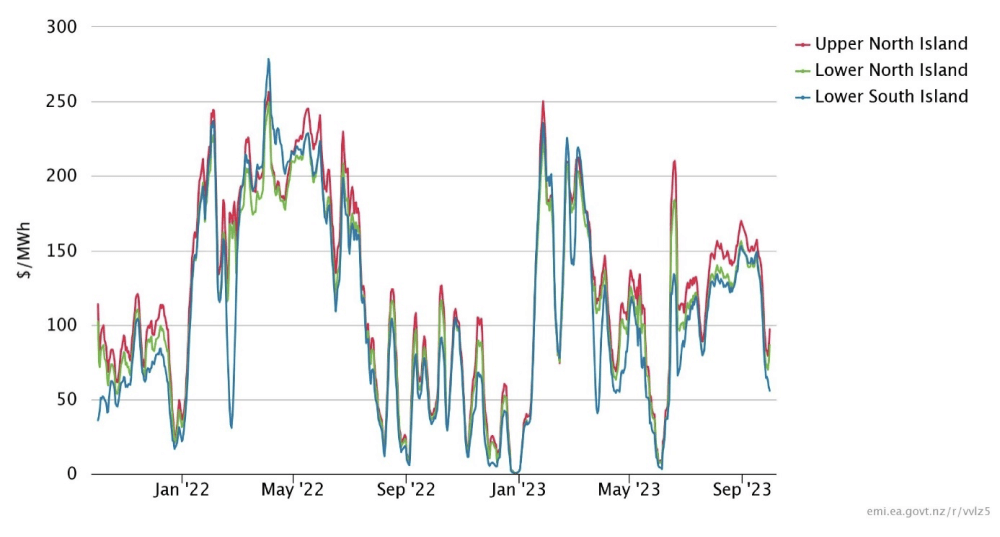
Electricity Demand
Electricity demand in September was lower than it has been in recent years as shown in the graph below.
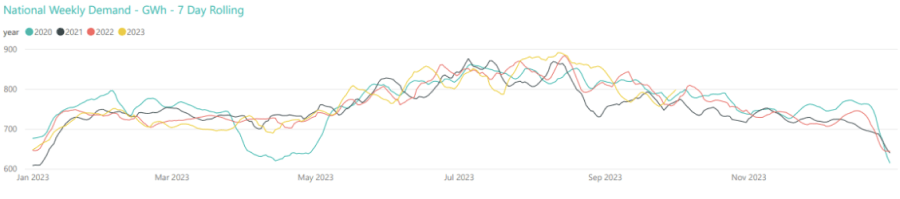
Electricity Generation Mix
Lower demand led to reduced hydro generation at the start of September, but higher inflows in the later part of the month saw hydro generation pick up. Thermal generation maintained the higher output observed in August until those inflows increased. There was also increased wind generation throughout most of September.
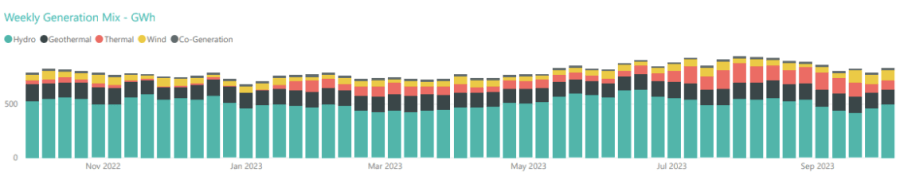
HVDC Transfer
Power transfers on the HVDC link connecting the North and South Islands are important both in showing relative hydro positions and the reliance on thermal power to meet demand. High northward flow tends to indicate a good SI hydro position, whereas the reverse indicates a heavy reliance on thermal power to make up for hydro shortages.
September saw northward transfer decrease at the start of the month and increased southward transfer, until the rain came mid-month increasing the level of northward transfer and stopping southward transfer.
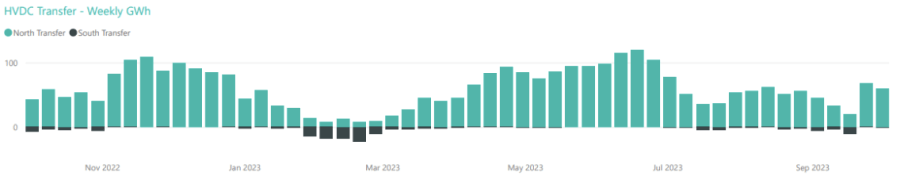
The Electricity Futures Market
The Futures Market provides an indication of where market participants see the spot market moving in the future. They are based on actual trades between participants looking to hedge their positions (as both buyers and sellers) into the future against potential spot market volatility. They are also a useful proxy for the direction of retail contracts.
The following graph shows Futures pricing for CY 2024, 2025, 2026 and 2027 at Otahuhu (Auckland) for the last 2 years.
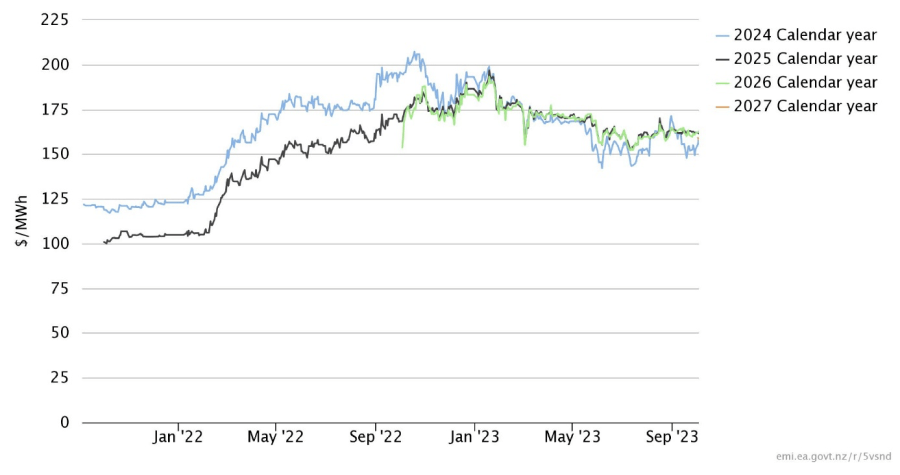
Note that $100/MWh equates to 10c/kWh.
Future prices for all years were down during September but particularly CY 2024 which finished at $153/MWh (-9%). CY 2025 was at $162 (-1%) while CY 2026 prices was down 2% at $162. CY 2027 has just been started to be published in October – currently it is at $158/MWh
Known new generation projects are shown below (additions / removals highlighted in bold).
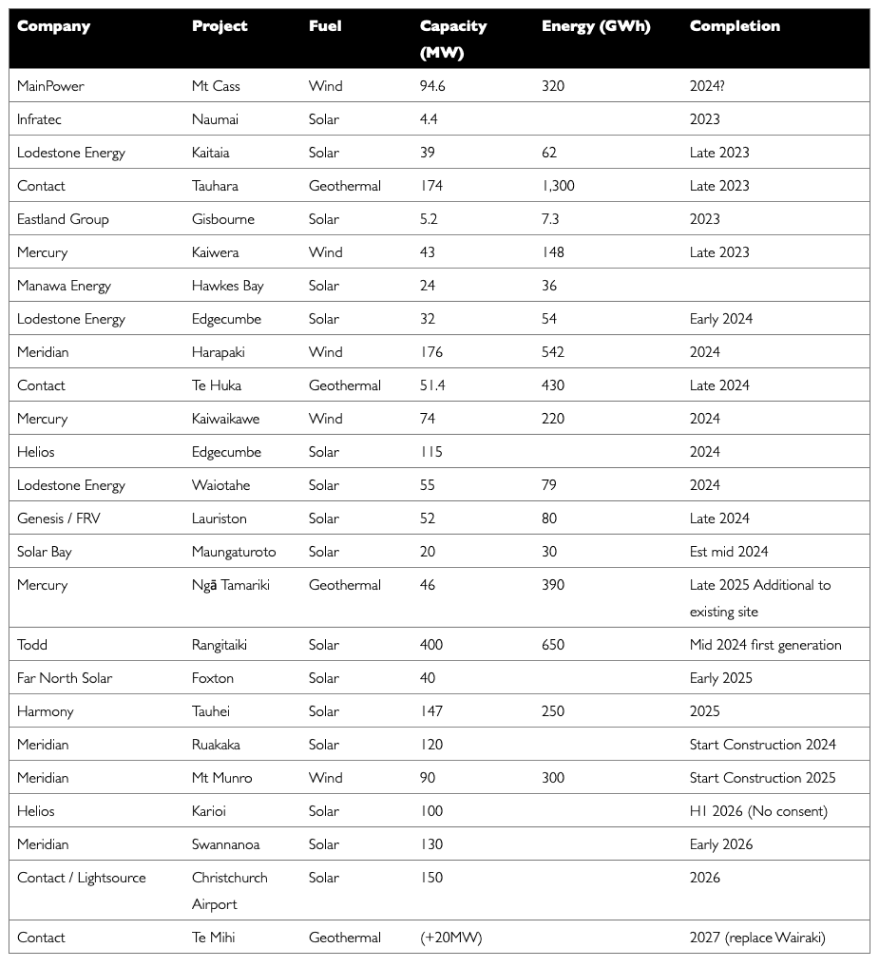
Hydro Storage
Inflows were below average in the South Island at the start of September but then increased dramatically for the second half of the month. Transpower has not updated NI inflows since July, however we can assume by the rate that Taupo storage has increased that inflows were above average for the time of year.
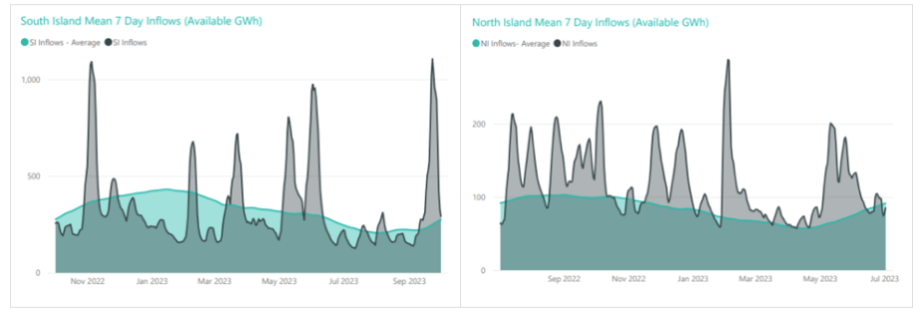
High September inflows resulted in a significant increase in energy storage levels in New Zealand’s main hydro storage lakes – reversing the steep declines over recent months. Storage ended the month at 2,927GWh or 66% full, up 459GWh. The following chart shows the latest breakdown of storage across the main hydro catchments.
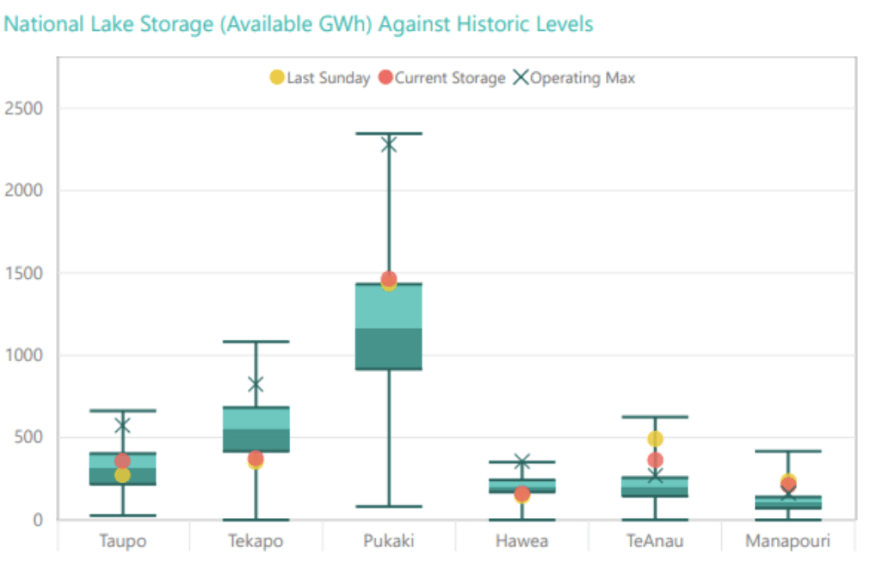
Security of supply risks decreased in September with storage levels increasing quickly. We are now back above the level we would typically expect to see for this time of year; and remain well above the risk zones. This is shown in the following risk curves.
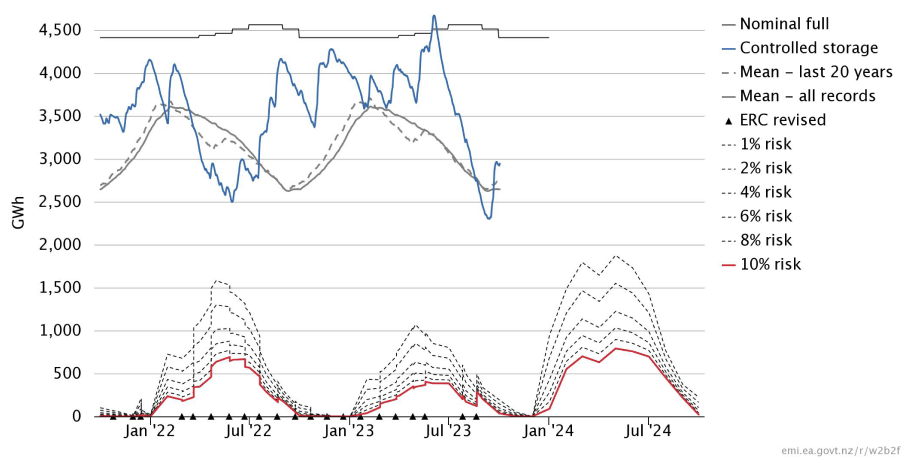
Snow Pack
Snowpack is an important way that hydro energy is stored over the winter months and released as hydro inflows in the spring. The following graph shows that the snowpack in the important Waitaki catchment is currently slightly above mean levels seen in the last 30 years for this time of year. Note this has not been updated since the middle of September.
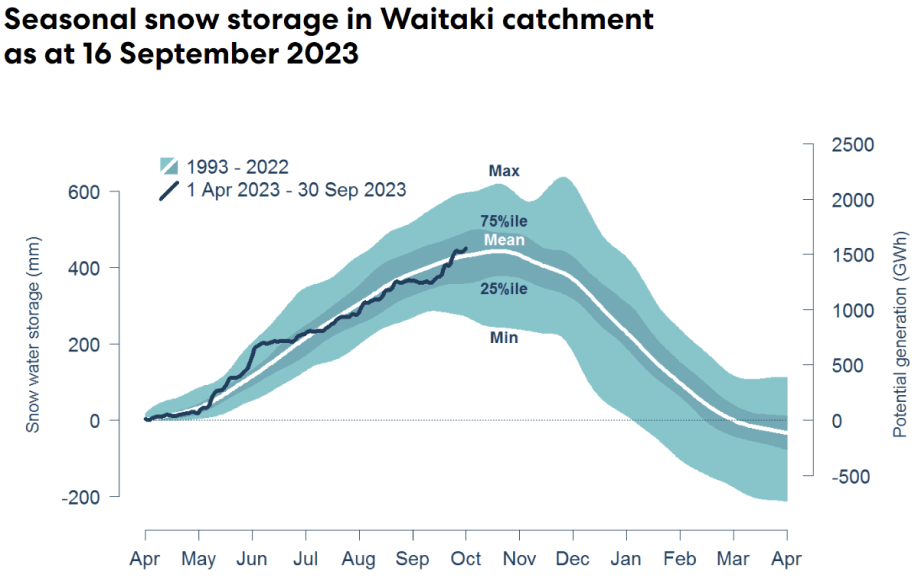
Climate outlook overview (from the MetService)
Climate Drivers — Sea surface temperatures in the equatorial Pacific Ocean NINO3.4 area now exceed 1.5C degrees above average, meeting the strong El Nino criterion. All climate models strengthen the event further, between now and its likely peak around Christmas, with the majority of models forecasting an intense El Nino event for summer. In addition, a positive Indian Ocean Dipole event is now underway, which typically enhances the westerly flow of weather across New Zealand. The Southern Ocean should also periodically throw some stormy, cold, and unsettled bursts of wind and weather across the South Island through October, reinforcing the westerly pattern. Due to the windy September, the local Tasman Sea marine heat-wave has now ended, with sea surface temperatures currently near average, to a touch cooler than average, around the New Zealand coastline. This means that a marine heatwave will NOT be factor in our late spring or early summer weather patterns.
October 2023 Outlook — The hallmark of El Nino in New Zealand is a cold spring. August ran much colder than usual, nationally, and the forecast for October is also much colder than usual. Expect a colder than average October across the country, with the exception of Nelson, Marlborough, Canterbury, Gisborne and Hawkes Bay. In those regions, monthly temperatures likely end up ‘about average’ BUT expect abnormal spring temperature swings between extreme heat during foehn warming in the westerlies, and intermittent cold blasts and even some high-country snowfalls. This week, high pressure brings a relatively dry week. For the rest of October, a stronger than normal ridge is predicted over Northland, coupled with stormy, unsettled westerlies across the South Island. In between, stronger than usual westerlies are forecast – it looks likely to be a windier than normal October. Rainfall is expected to be normal to above normal along the West Coast South Island, and in Southland. For regions in the northeast of both Islands, below normal rainfall is forecast (Northland, Auckland, Coromandel, Bay of Plenty, Taupo, Waikato, and Waitomo, also Nelson, Marlborough and Coastal Canterbury). For Gisborne and Hawkes Bay, a burst of rain this weekend is then followed by drier westerlies (e.g. normal to below normal rainfall for October as a whole). Elsewhere, near normal October rainfall is forecast.
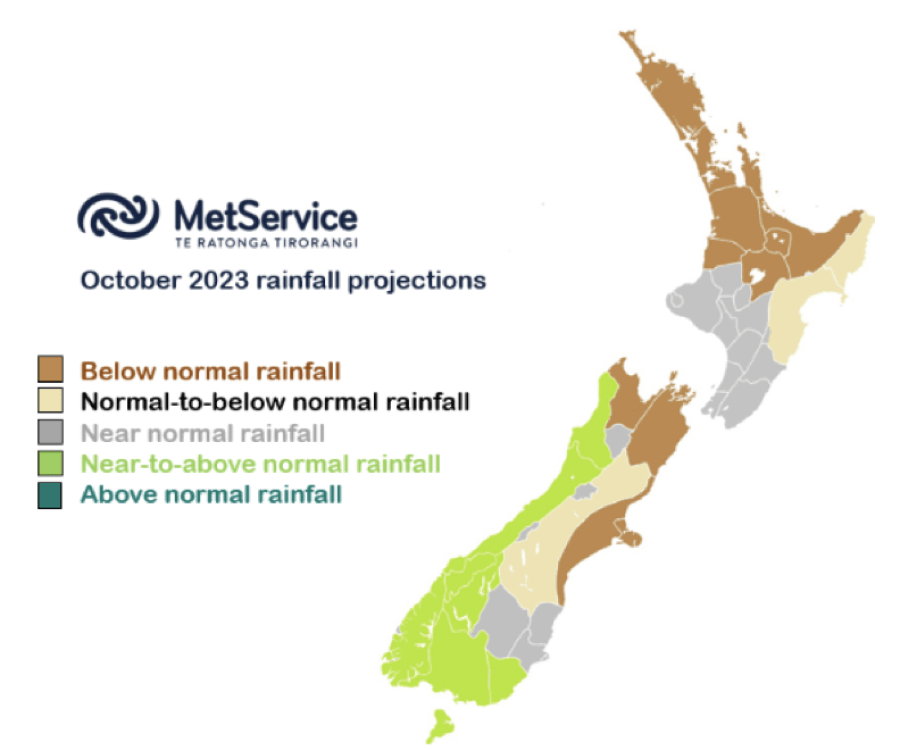
The Gas Market
Gas prices were flat in September closing unchanged at $10.6/GJ. Prices are still currently about 10% lower than they were at the same time last year.
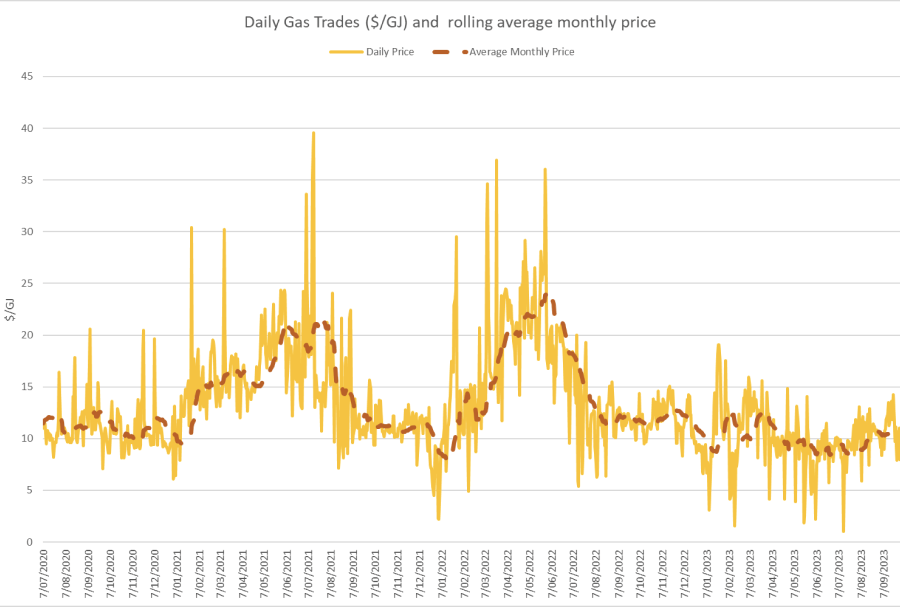
On the supply side, Maui output was down again in September – averaging just over 90 TJ/day (down 10%). Pohokura was also down slightly, averaging 77TJ/day (-4%) as was Kupe averaging 51TJ/day – also down 4%. Offsetting some of that loss, McKee / Mangahewa was up at around 79TJ/day in September (+3% from August levels).
The following graph shows production levels from major fields over the last 4 years.
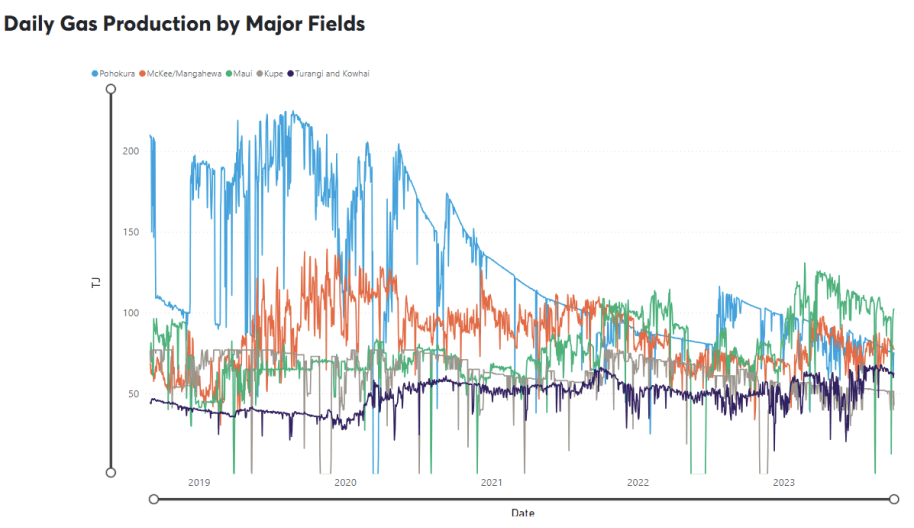
On the demand side, Methanex Motonui’s usage remained lower than usual at the start of September, increasing to around 135TJ/day later in the month. Huntly power station gas use averaged around 87TJ/day early before dropping back to less than 60TJ/day when the rain came through later in the month. TCC continued to be used at similar levels to August, averaging 34.5TJ/day.
The following graph shows trends in the major gas users over the last 4 years.
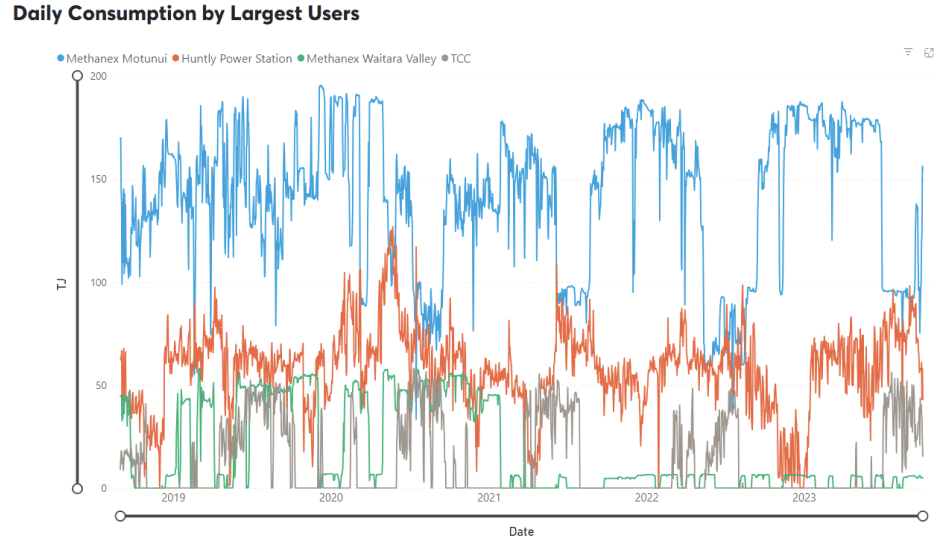
After their recent falls, global energy prices flattened out and were quite stable in September. They continue to be at levels above what we would have considered to be high only 2 years ago. Lack of investment in new gas supply internationally over several years had already resulted in price increases before the conflict in Europe accelerated those impacts.
LNG netback prices ended the month at $16.63GJ – up almost 20% from last month, however forecast 2023 netback prices are $19.78 – down 2% on what the ACCC was forecasting in August. Forecast prices for 2024 are now sitting at $20.27 – down 14% compared to August.

New Zealand does not have an LNG export market, so our domestic prices are not directly linked to global prices. However, some of our large gas users deal in international markets which are impacted by global gas prices, and they may try to produce more in NZ (increase demand) to take advantage of lower gas prices.
The Coal Market
The global energy crisis has been as much about coal as it has gas. The war in the Ukraine has driven energy prices, including coal, up. Prices in September were flat, ending the month at US$155/T – a 0.6% decrease on the August close. These prices, though well below the highs of the last 12 months, remain above what we expect to see as shown in the following graph of prices over the last 10 years.
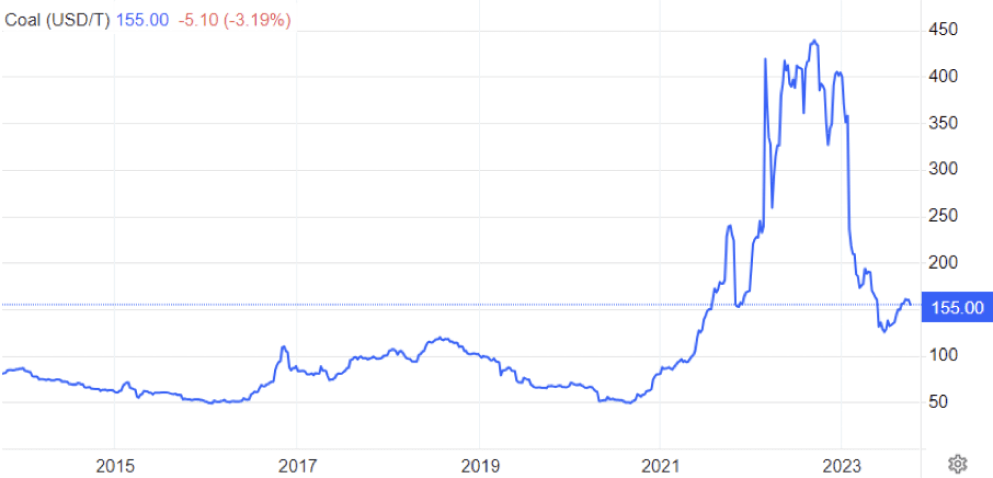
Like gas, the price of coal can flow through and have an impact on the electricity market. However, coal stockpiles at Huntly are at the highest they have been for many years helping to assure the market that there is plenty of fuel available in the event of dry conditions in the hydro catchments.
Carbon Pricing
NZ has had an Emissions Trading Scheme (ETS) in place since 2008. It has been subsequently reviewed by several governments and is now an “uncapped” price scheme closely linked to international schemes. However, there are “upper and lower guard-rails” set up to prevent wild swings in carbon price that act as minimum and maximum prices. Currently these are set at $82 and $33 respectively, however they are going to increase in December after the Government recently accepted the Climate Change Commission’s recommendations to tighten the auction scheme. Carbon prices eased through September falling to $65.6 – down 8% over the month.
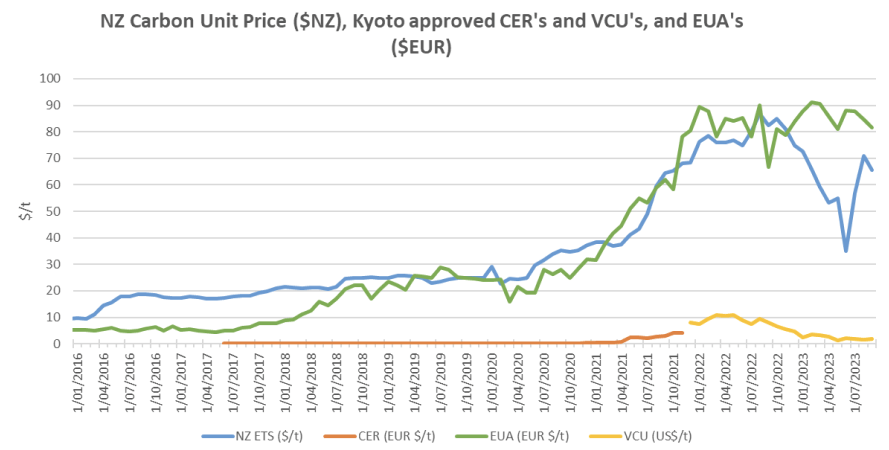
As the carbon price rises, the cost of coal, gas or other fossil fuels used in process heat applications will naturally also rise. Electricity prices are also affected by a rising carbon price. Electricity prices are set by the marginal producing unit – in NZ this is currently typically coal or gas or hydro generators, with the latter valuing the cost of its water against the former. An increase in carbon price can lead to an increase in electricity prices in the short to medium term (as the marginal units set the price). A carbon price of $50/t is estimated to currently add about $25/MWh (or ~2.5c/kWh) to electricity prices. In the long term the impact should reduce as money is invested in more low-cost renewables and there is less reliance on gas and coal fired generation.
EU Carbon Permits decreased in September to 82 Euro/tonne – down 3%.
About this Report
This energy market summary report provides information on wholesale price trends within the NZ Electricity Market.
Please note that all electricity prices are presented as a $ per MWh price and all carbon prices as a $ per unit price.
All spot prices are published by the Electricity Authority. Futures contract prices are sourced from ASX.
Further information can be found at the locations noted below.
- Transpower publishes a range of detailed information which can be found here: https://www.transpower.co.nz/power-system-live-data
- The Electricity Authority publishes a range of detailed information which can be found here: https://www.emi.ea.govt.nz/
- Weather and Climate data – The MetService publishes a range of weather-related information which can be found here: https://www.metservice.com/
Disclaimer
This document has been prepared for information and explanatory purposes only and is not intended to be relied upon by any person. This document does not form part of any existing or future contract or agreement between us. We make no representation, assurance, or guarantee as to the accuracy of the information provided. To the maximum extent permitted by law, none of Smart Power Ltd, its related companies, directors, employees or agents accepts any liability for any loss arising from the use of this document or its contents or otherwise arising out or, or in connection with it. You must not provide this document or any information contained in it to any third party without our prior consent.
About Smart Power
Smart Power is a full-service Energy Management consultancy. Apart from Energy Procurement, Smart Power can also provide:
- Technical Advice on how to reduce your energy use/emissions
- Sustainability Reporting
- Invoice Management services.
We also offer boutique energy and water billing service for landlords/property developers.
Contact us at https://smartpower1.wpenginepowered.com/contact/ or ring one of our offices to talk to one of our experienced staff about how we can assist you with achieving your energy goals.
© Copyright, 2023. Smart Power Ltd