
Market Update September 2023
The Wholesale Electricity Market
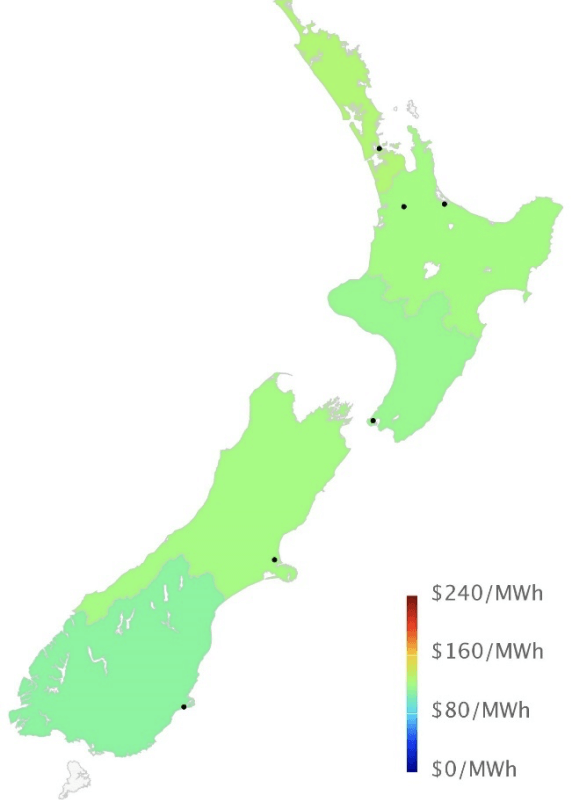
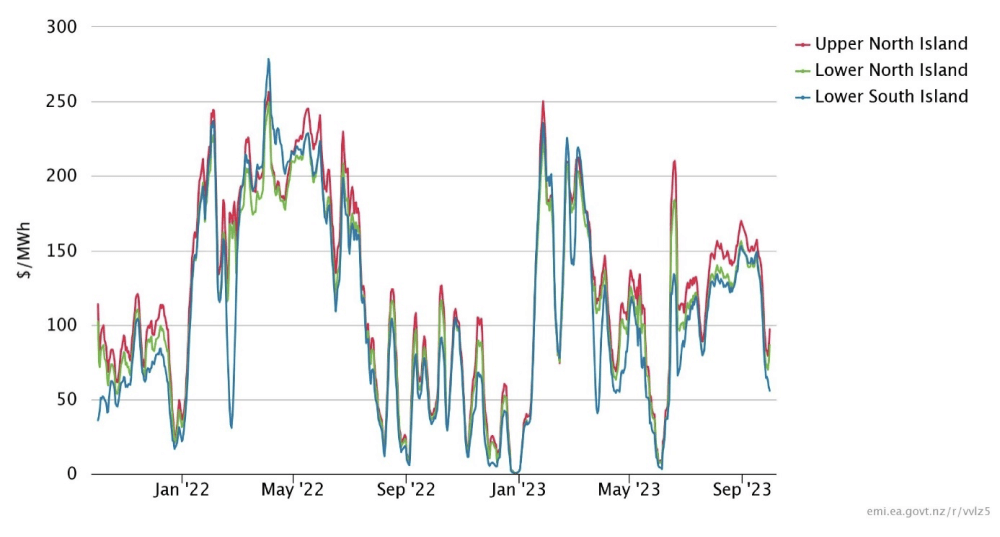
Spot prices in the wholesale electricity market eased through September. Average spot prices ranged from $110 in the lower South Island (down from $131 in August), up to $127 in the upper North Island (down from $149).
The following chart shows average weekly spot prices over the last 2 years. The sudden drop in prices in the middle of September can be clearly seen.
Electricity Demand
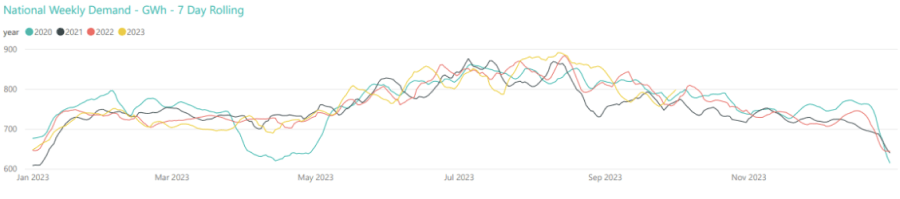
Electricity demand in September was lower than it has been in recent years as shown in the graph below.
Electricity Generation Mix
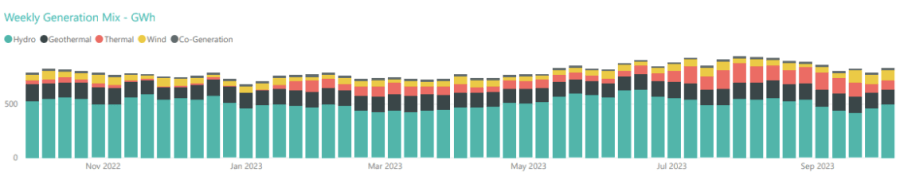
Lower demand led to reduced hydro generation at the start of September, but higher inflows in the later part of the month saw hydro generation pick up. Thermal generation maintained the higher output observed in August until those inflows increased. There was also increased wind generation throughout most of September.
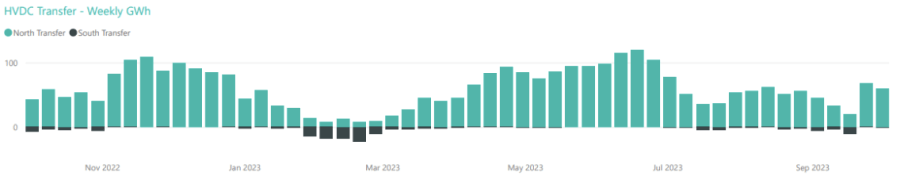
HVDC Transfer
Power transfers on the HVDC link connecting the North and South Islands are important both in showing relative hydro positions and the reliance on thermal power to meet demand. High northward flow tends to indicate a good SI hydro position, whereas the reverse indicates a heavy reliance on thermal power to make up for hydro shortages.
September saw northward transfer decrease at the start of the month and increased southward transfer, until the rain came mid-month increasing the level of northward transfer and stopping southward transfer.
The Electricity Futures Market
The Futures Market provides an indication of where market participants see the spot market moving in the future. They are based on actual trades between participants looking to hedge their positions (as both buyers and sellers) into the future against potential spot market volatility. They are also a useful proxy for the direction of retail contracts.
The following graph shows Futures pricing for CY 2024, 2025, 2026 and 2027 at Otahuhu (Auckland) for the last 2 years.
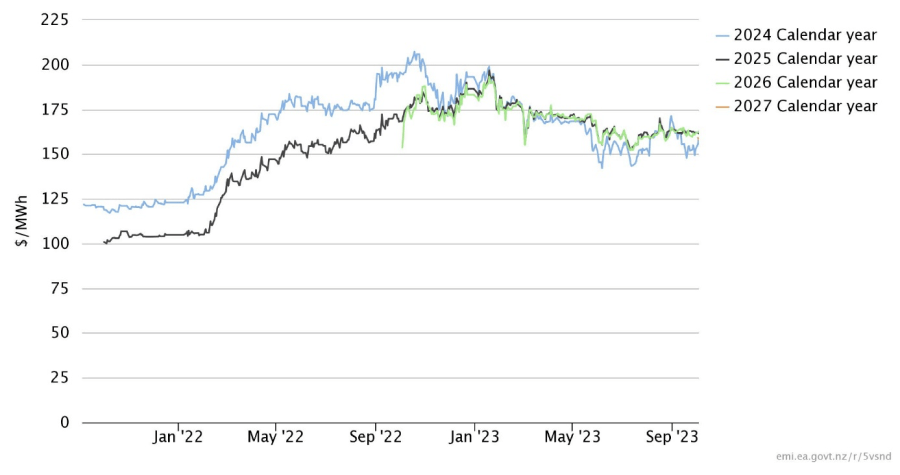
Note that $100/MWh equates to 10c/kWh.
Future prices for all years were down during September but particularly CY 2024 which finished at $153/MWh (-9%). CY 2025 was at $162 (-1%) while CY 2026 prices was down 2% at $162. CY 2027 has just been started to be published in October – currently it is at $158/MWh
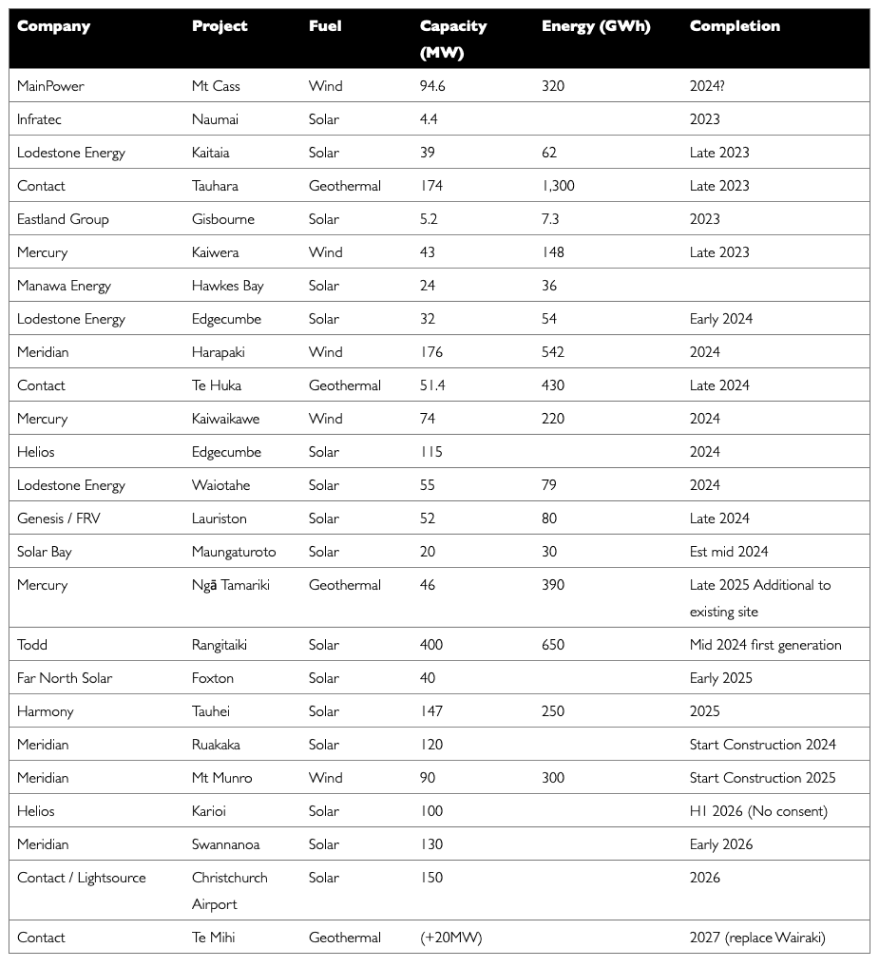
Known new generation projects are shown below (additions / removals highlighted in bold).
Hydro Storage
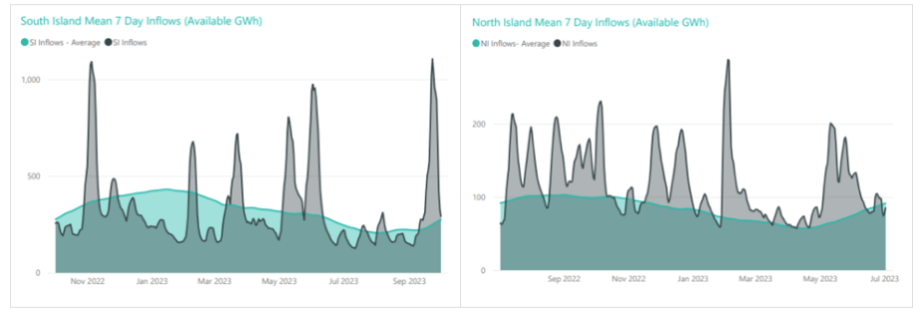
Inflows were below average in the South Island at the start of September but then increased dramatically for the second half of the month. Transpower has not updated NI inflows since July, however we can assume by the rate that Taupo storage has increased that inflows were above average for the time of year.
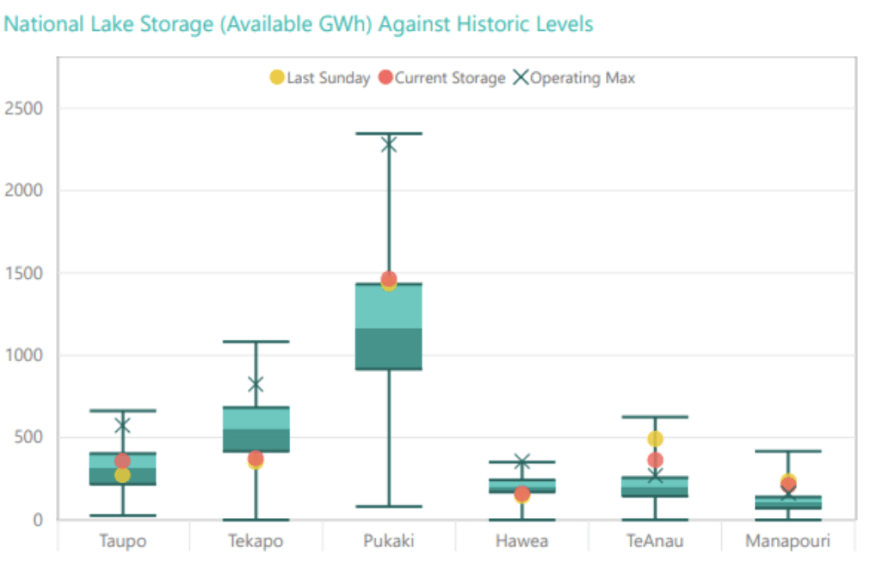
High September inflows resulted in a significant increase in energy storage levels in New Zealand’s main hydro storage lakes – reversing the steep declines over recent months. Storage ended the month at 2,927GWh or 66% full, up 459GWh. The following chart shows the latest breakdown of storage across the main hydro catchments.
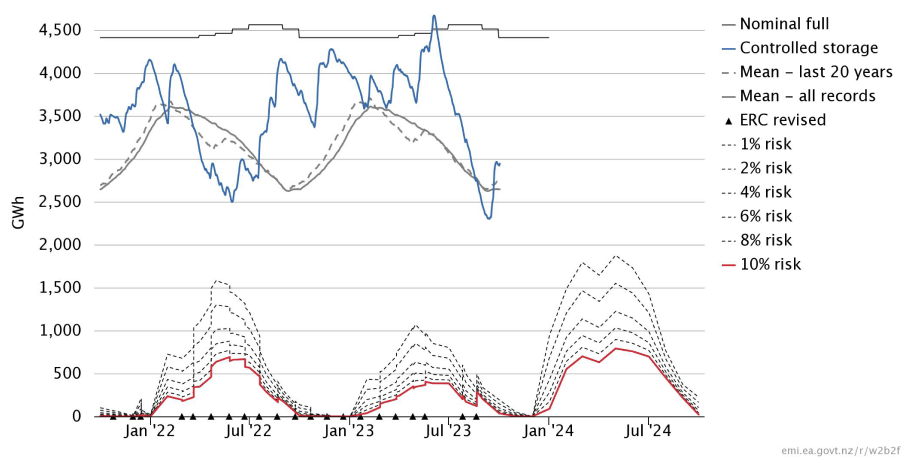
Security of supply risks decreased in September with storage levels increasing quickly. We are now back above the level we would typically expect to see for this time of year; and remain well above the risk zones. This is shown in the following risk curves.
Snow Pack
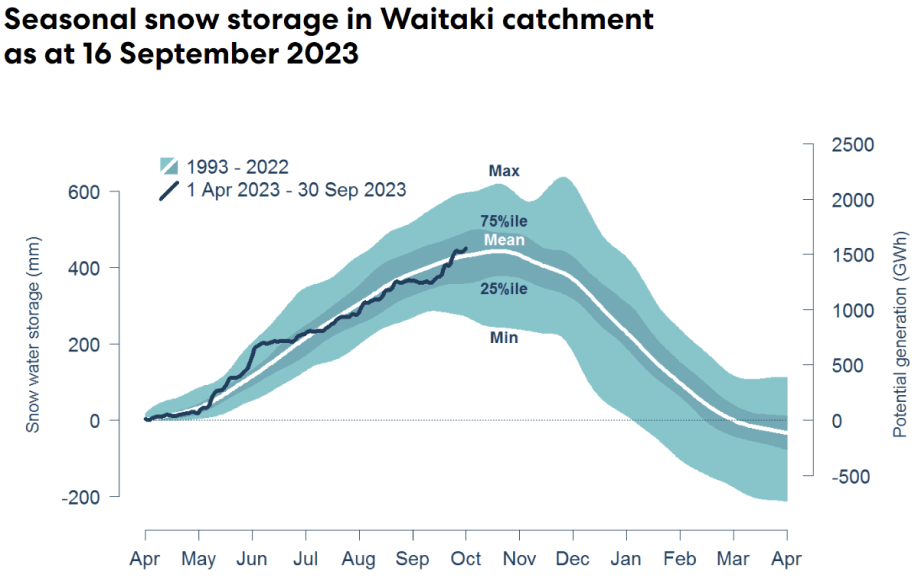
Snowpack is an important way that hydro energy is stored over the winter months and released as hydro inflows in the spring. The following graph shows that the snowpack in the important Waitaki catchment is currently slightly above mean levels seen in the last 30 years for this time of year. Note this has not been updated since the middle of September.
Climate outlook overview (from the MetService)
Climate Drivers — Sea surface temperatures in the equatorial Pacific Ocean NINO3.4 area now exceed 1.5C degrees above average, meeting the strong El Nino criterion. All climate models strengthen the event further, between now and its likely peak around Christmas, with the majority of models forecasting an intense El Nino event for summer. In addition, a positive Indian Ocean Dipole event is now underway, which typically enhances the westerly flow of weather across New Zealand. The Southern Ocean should also periodically throw some stormy, cold, and unsettled bursts of wind and weather across the South Island through October, reinforcing the westerly pattern. Due to the windy September, the local Tasman Sea marine heat-wave has now ended, with sea surface temperatures currently near average, to a touch cooler than average, around the New Zealand coastline. This means that a marine heatwave will NOT be factor in our late spring or early summer weather patterns.
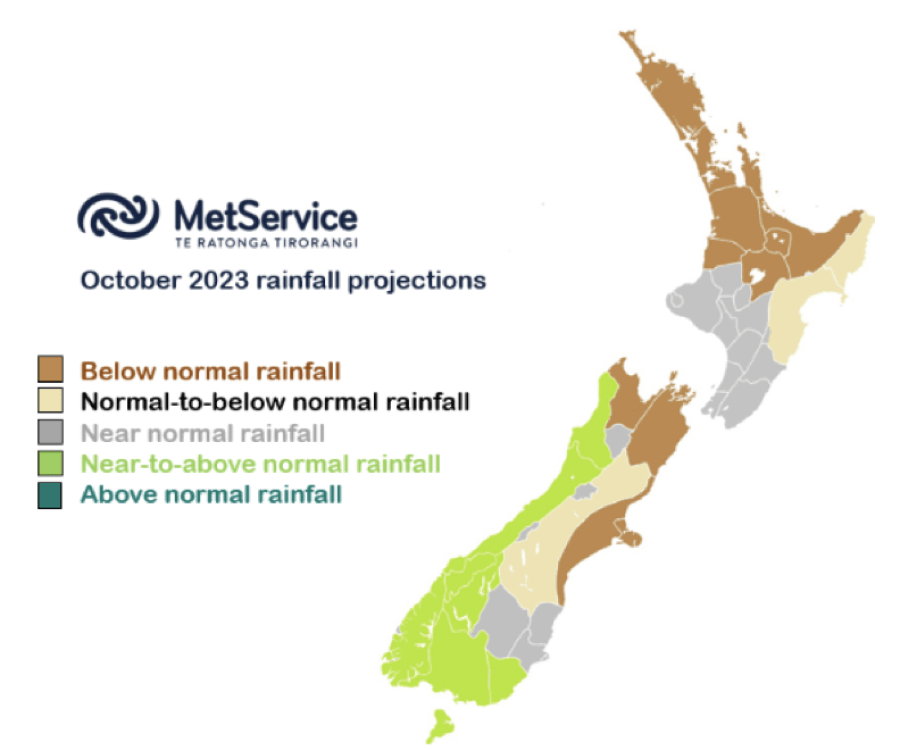
October 2023 Outlook — The hallmark of El Nino in New Zealand is a cold spring. August ran much colder than usual, nationally, and the forecast for October is also much colder than usual. Expect a colder than average October across the country, with the exception of Nelson, Marlborough, Canterbury, Gisborne and Hawkes Bay. In those regions, monthly temperatures likely end up ‘about average’ BUT expect abnormal spring temperature swings between extreme heat during foehn warming in the westerlies, and intermittent cold blasts and even some high-country snowfalls. This week, high pressure brings a relatively dry week. For the rest of October, a stronger than normal ridge is predicted over Northland, coupled with stormy, unsettled westerlies across the South Island. In between, stronger than usual westerlies are forecast – it looks likely to be a windier than normal October. Rainfall is expected to be normal to above normal along the West Coast South Island, and in Southland. For regions in the northeast of both Islands, below normal rainfall is forecast (Northland, Auckland, Coromandel, Bay of Plenty, Taupo, Waikato, and Waitomo, also Nelson, Marlborough and Coastal Canterbury). For Gisborne and Hawkes Bay, a burst of rain this weekend is then followed by drier westerlies (e.g. normal to below normal rainfall for October as a whole). Elsewhere, near normal October rainfall is forecast.
The Gas Market
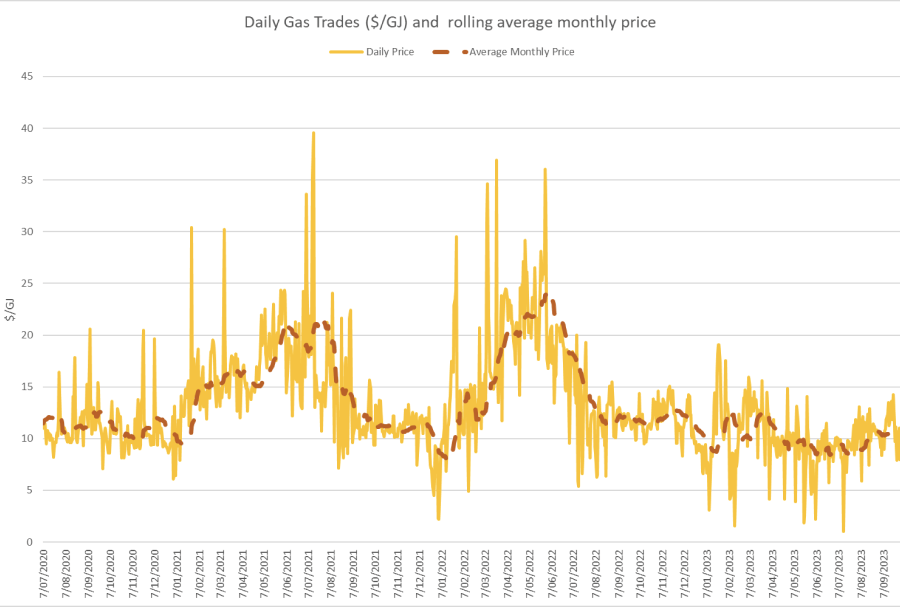
Gas prices were flat in September closing unchanged at $10.6/GJ. Prices are still currently about 10% lower than they were at the same time last year.
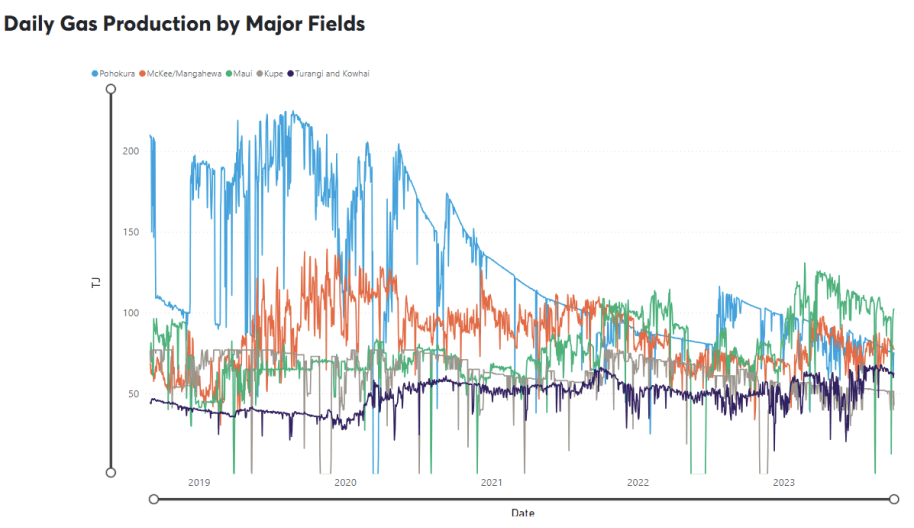
On the supply side, Maui output was down again in September – averaging just over 90 TJ/day (down 10%). Pohokura was also down slightly, averaging 77TJ/day (-4%) as was Kupe averaging 51TJ/day – also down 4%. Offsetting some of that loss, McKee / Mangahewa was up at around 79TJ/day in September (+3% from August levels).
The following graph shows production levels from major fields over the last 4 years.
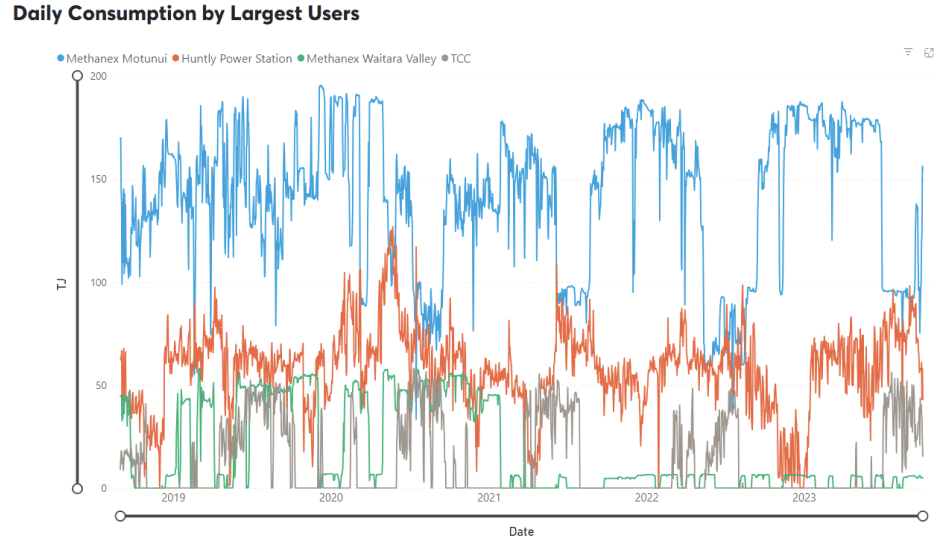
On the demand side, Methanex Motonui’s usage remained lower than usual at the start of September, increasing to around 135TJ/day later in the month. Huntly power station gas use averaged around 87TJ/day early before dropping back to less than 60TJ/day when the rain came through later in the month. TCC continued to be used at similar levels to August, averaging 34.5TJ/day.
The following graph shows trends in the major gas users over the last 4 years.
After their recent falls, global energy prices flattened out and were quite stable in September. They continue to be at levels above what we would have considered to be high only 2 years ago. Lack of investment in new gas supply internationally over several years had already resulted in price increases before the conflict in Europe accelerated those impacts.
LNG netback prices ended the month at $16.63GJ – up almost 20% from last month, however forecast 2023 netback prices are $19.78 – down 2% on what the ACCC was forecasting in August. Forecast prices for 2024 are now sitting at $20.27 – down 14% compared to August.
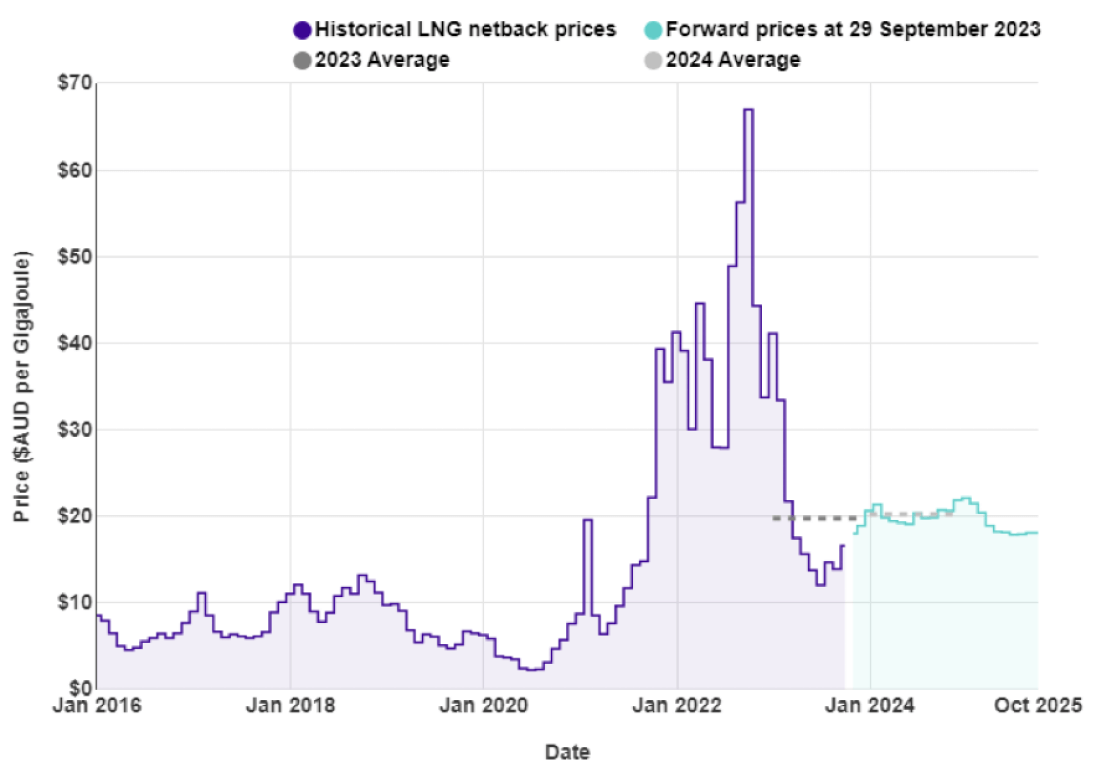
New Zealand does not have an LNG export market, so our domestic prices are not directly linked to global prices. However, some of our large gas users deal in international markets which are impacted by global gas prices, and they may try to produce more in NZ (increase demand) to take advantage of lower gas prices.
The Coal Market
The global energy crisis has been as much about coal as it has gas. The war in the Ukraine has driven energy prices, including coal, up. Prices in September were flat, ending the month at US$155/T – a 0.6% decrease on the August close. These prices, though well below the highs of the last 12 months, remain above what we expect to see as shown in the following graph of prices over the last 10 years.
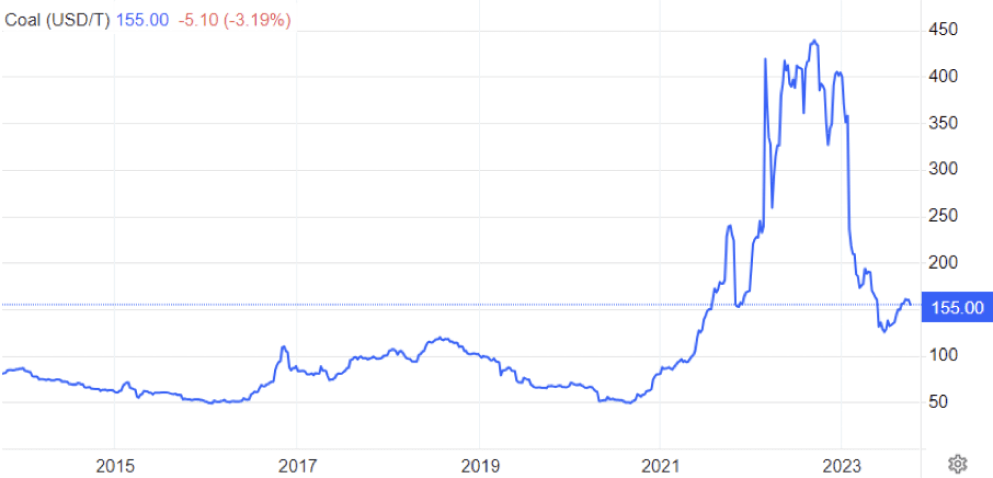
Like gas, the price of coal can flow through and have an impact on the electricity market. However, coal stockpiles at Huntly are at the highest they have been for many years helping to assure the market that there is plenty of fuel available in the event of dry conditions in the hydro catchments.
Carbon Pricing
NZ has had an Emissions Trading Scheme (ETS) in place since 2008. It has been subsequently reviewed by several governments and is now an “uncapped” price scheme closely linked to international schemes. However, there are “upper and lower guard-rails” set up to prevent wild swings in carbon price that act as minimum and maximum prices. Currently these are set at $82 and $33 respectively, however they are going to increase in December after the Government recently accepted the Climate Change Commission’s recommendations to tighten the auction scheme. Carbon prices eased through September falling to $65.6 – down 8% over the month.
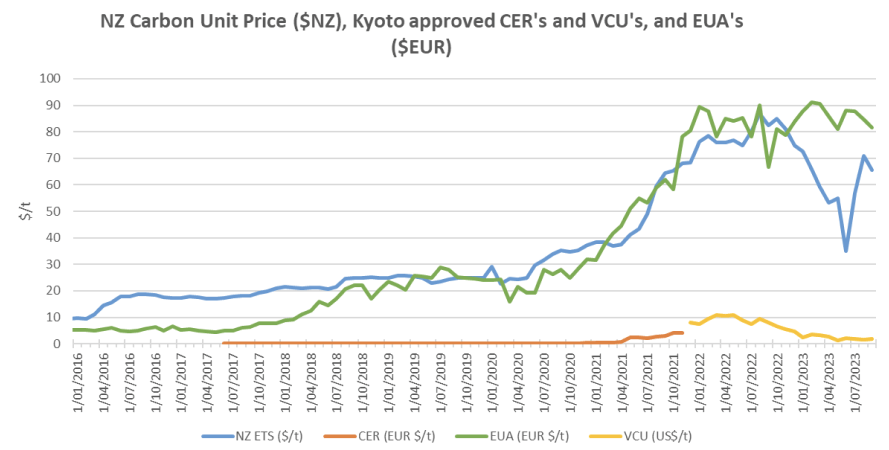
As the carbon price rises, the cost of coal, gas or other fossil fuels used in process heat applications will naturally also rise. Electricity prices are also affected by a rising carbon price. Electricity prices are set by the marginal producing unit – in NZ this is currently typically coal or gas or hydro generators, with the latter valuing the cost of its water against the former. An increase in carbon price can lead to an increase in electricity prices in the short to medium term (as the marginal units set the price). A carbon price of $50/t is estimated to currently add about $25/MWh (or ~2.5c/kWh) to electricity prices. In the long term the impact should reduce as money is invested in more low-cost renewables and there is less reliance on gas and coal fired generation.
EU Carbon Permits decreased in September to 82 Euro/tonne – down 3%.
About this Report
This energy market summary report provides information on wholesale price trends within the NZ Electricity Market.
Please note that all electricity prices are presented as a $ per MWh price and all carbon prices as a $ per unit price.
All spot prices are published by the Electricity Authority. Futures contract prices are sourced from ASX.
Further information can be found at the locations noted below.
- Transpower publishes a range of detailed information which can be found here: https://www.transpower.co.nz/power-system-live-data
- The Electricity Authority publishes a range of detailed information which can be found here: https://www.emi.ea.govt.nz/
- Weather and Climate data – The MetService publishes a range of weather-related information which can be found here: https://www.metservice.com/
Disclaimer
This document has been prepared for information and explanatory purposes only and is not intended to be relied upon by any person. This document does not form part of any existing or future contract or agreement between us. We make no representation, assurance, or guarantee as to the accuracy of the information provided. To the maximum extent permitted by law, none of Smart Power Ltd, its related companies, directors, employees or agents accepts any liability for any loss arising from the use of this document or its contents or otherwise arising out or, or in connection with it. You must not provide this document or any information contained in it to any third party without our prior consent.
About Smart Power
Smart Power is a full-service Energy Management consultancy. Apart from Energy Procurement, Smart Power can also provide:
- Technical Advice on how to reduce your energy use/emissions
- Sustainability Reporting
- Invoice Management services.
We also offer boutique energy and water billing service for landlords/property developers.
Contact us at https://smartpower1.wpenginepowered.com/contact/ or ring one of our offices to talk to one of our experienced staff about how we can assist you with achieving your energy goals.
© Copyright, 2023. Smart Power Ltd