
Market Update November 2023
The Wholesale Electricity Market
Spot prices in the wholesale electricity market increased through November. Average spot prices ranged from $127 in the lower South Island (up from $106 in October), up to $154 in the upper North Island (up from $133).
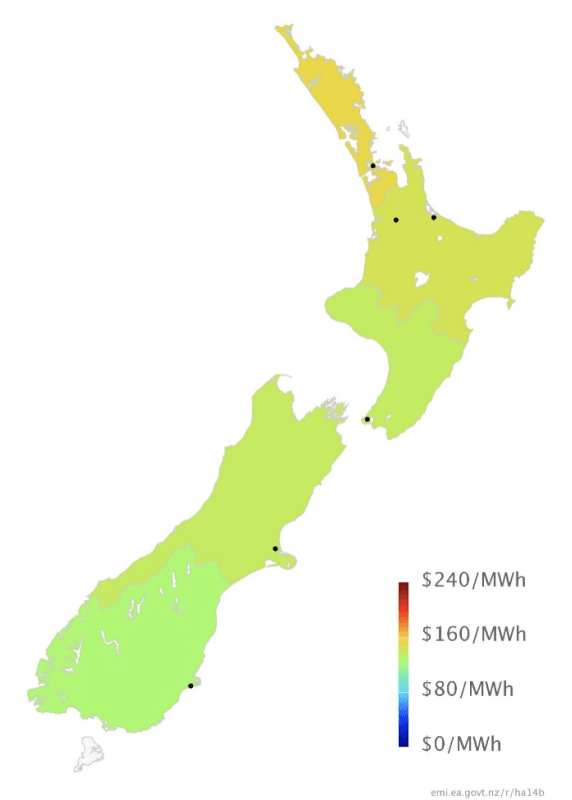
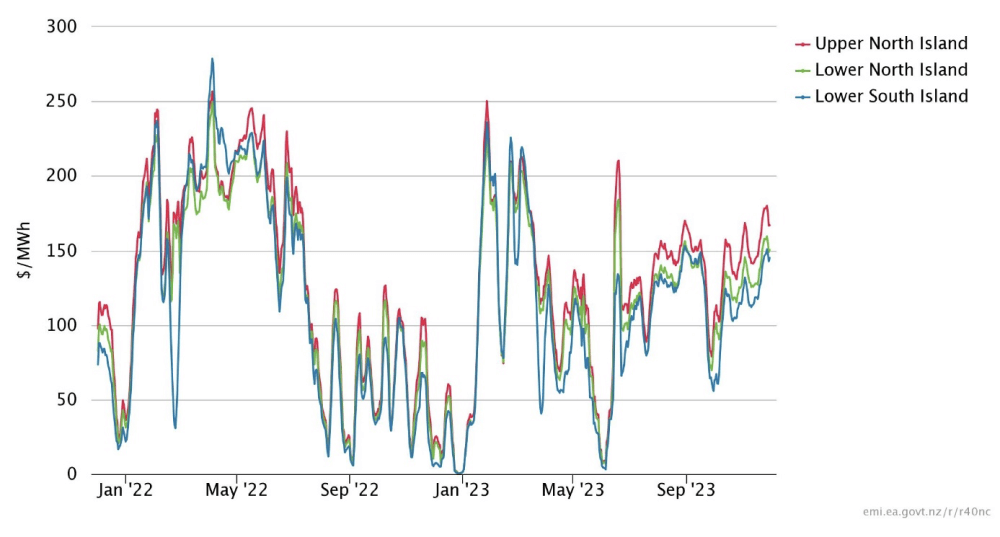
The following chart shows average weekly spot prices over the last 2 years. The sudden drop in prices in the middle of September can be clearly seen as is the recovery in prices since then.
Electricity Demand
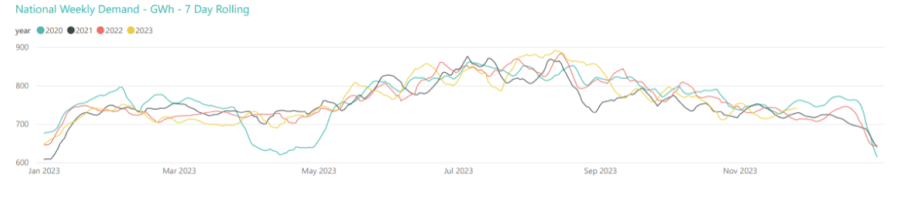
Electricity demand in November was on a par with recent years, falling as we head toward the warmer summer period.
Electricity Generation Mix
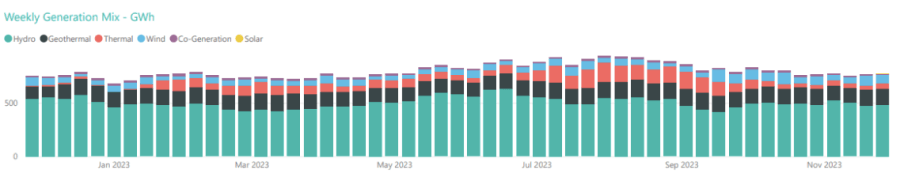
The lower level of demand and increased wind generation saw thermal generation remain at the low levels observed last month.
HVDC Transfer
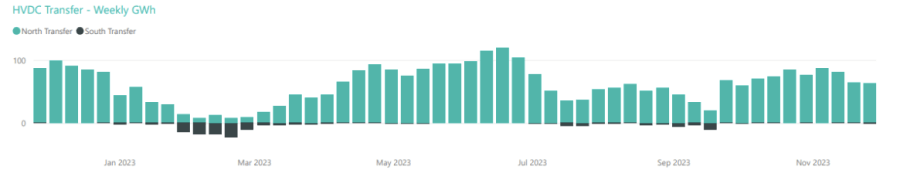
Power transfers on the HVDC link connecting the North and South Islands are important both in showing relative hydro positions and the reliance on thermal power to meet demand. High northward flow tends to indicate a good SI hydro position, whereas the reverse indicates a heavy reliance on thermal power to make up for hydro shortages.
November saw northward transfer continue at the reasonably high levels seen through October at the start of the month, before reducing in the second half of the month. Southward transfer remained minimal.
The Electricity Futures Market
The Futures Market provides an indication of where market participants see the spot market moving in the future. They are based on actual trades between participants looking to hedge their positions (as both buyers and sellers) into the future against potential spot market volatility. They are also a useful proxy for the direction of retail contracts.
The following graph shows Futures pricing for CY 2024, 2025, 2026 and 2027 at Otahuhu (Auckland) for the last 2 years.
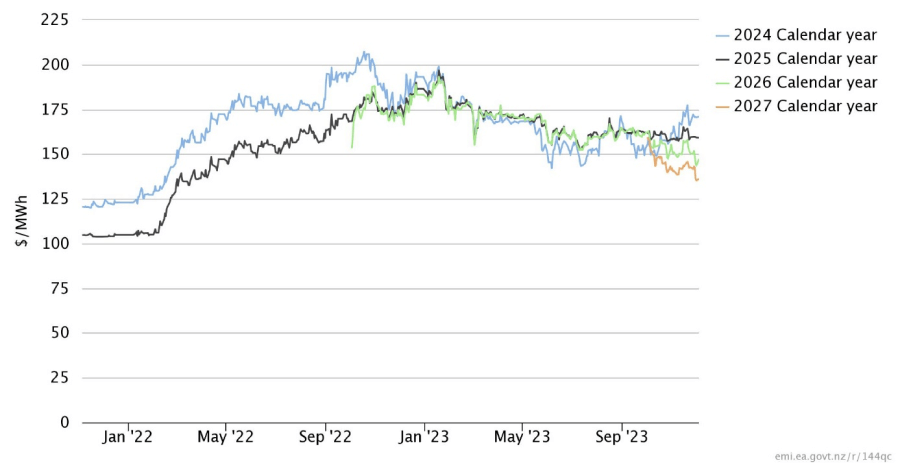
Note that $100/MWh equates to 10c/kWh.
Forward prices were up for near future years but fell for latter years. CY 2024 closed at $171/MWh (+6%), while CY 2025 was at $159.5 (+1%). CY 2026 prices was down 6% at $145 and CY 2027 closed at $136/MWh (-3.5%).
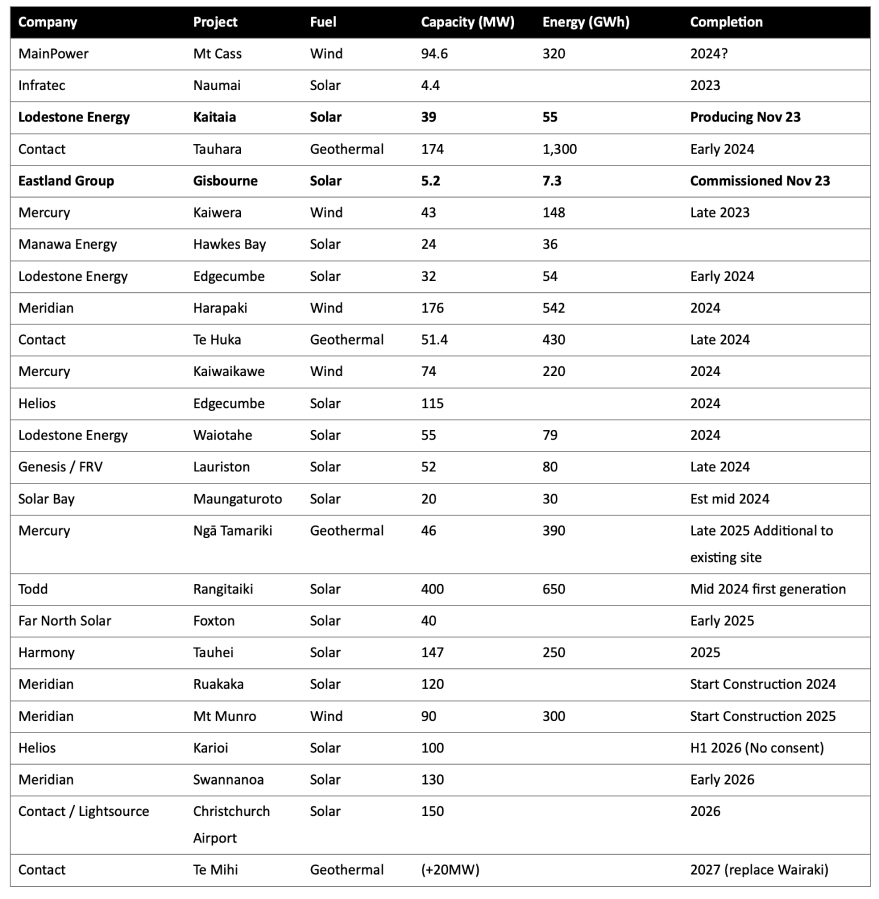
Known new generation projects are shown below (additions / removals highlighted in bold).
Hydro Storage
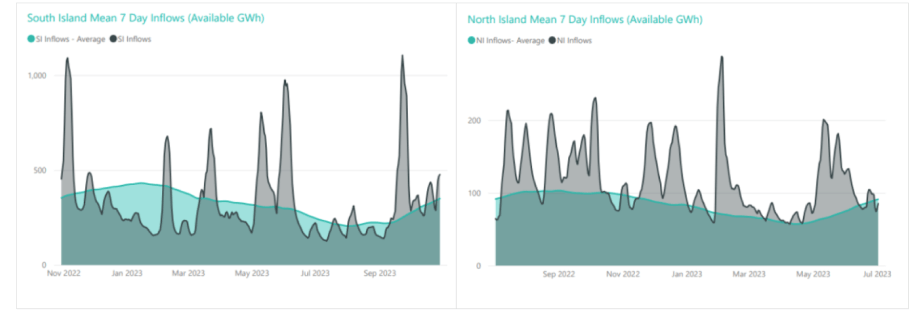
Inflows were below average in both the North and South Island through November as shown in the following charts.
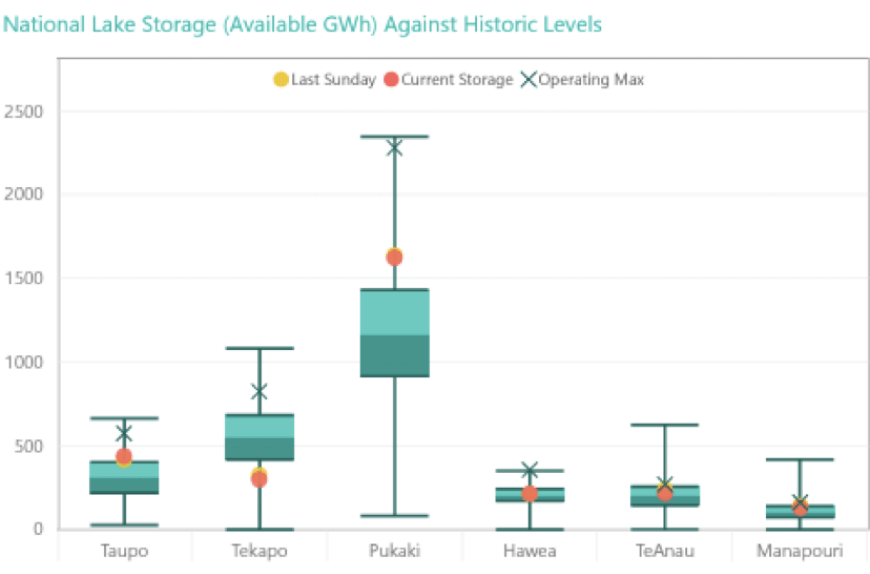
Below average November inflows resulted in energy storage levels in New Zealand’s main hydro storage lakes decreasing through the month. Storage ended the month at 2,838GWh or 64% full, down 177GWh. The following chart shows the latest breakdown of storage across the main hydro catchments.
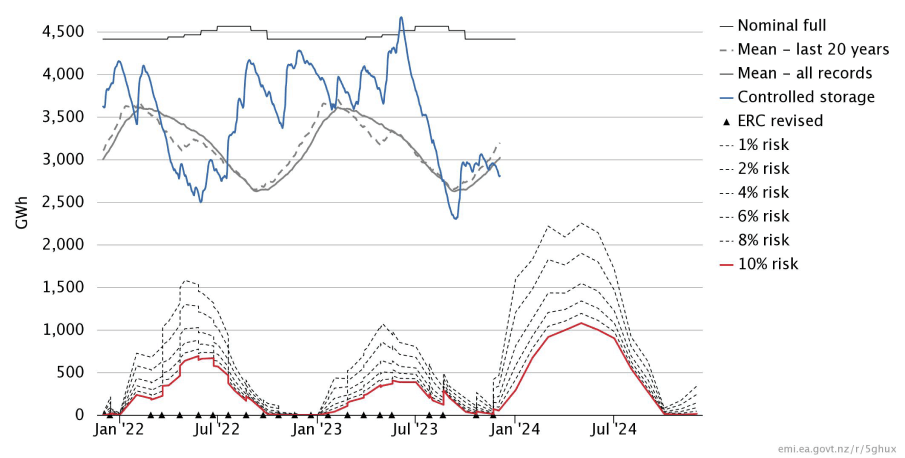
Security of supply risks increased in November with storage levels decreasing. We are now slightly below the level we would typically expect to see for this time of year; but remain well above the risk zones. This is shown in the following risk curves.
Snow Pack
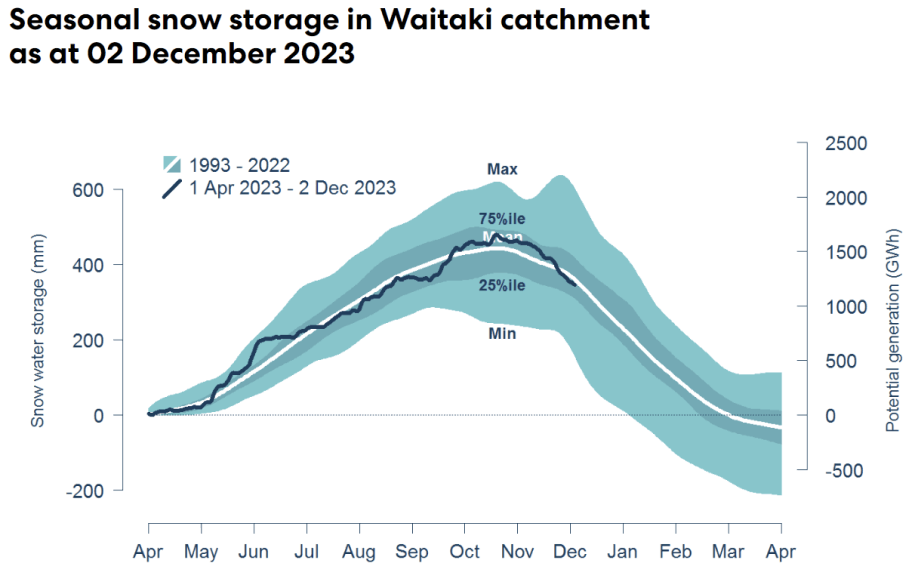
Snowpack is an important way that hydro energy is stored over the winter months and released as hydro inflows in the spring. The following graph shows that the snowpack in the important Waitaki catchment is currently slightly below mean levels seen in the last 30 years for this time of year.
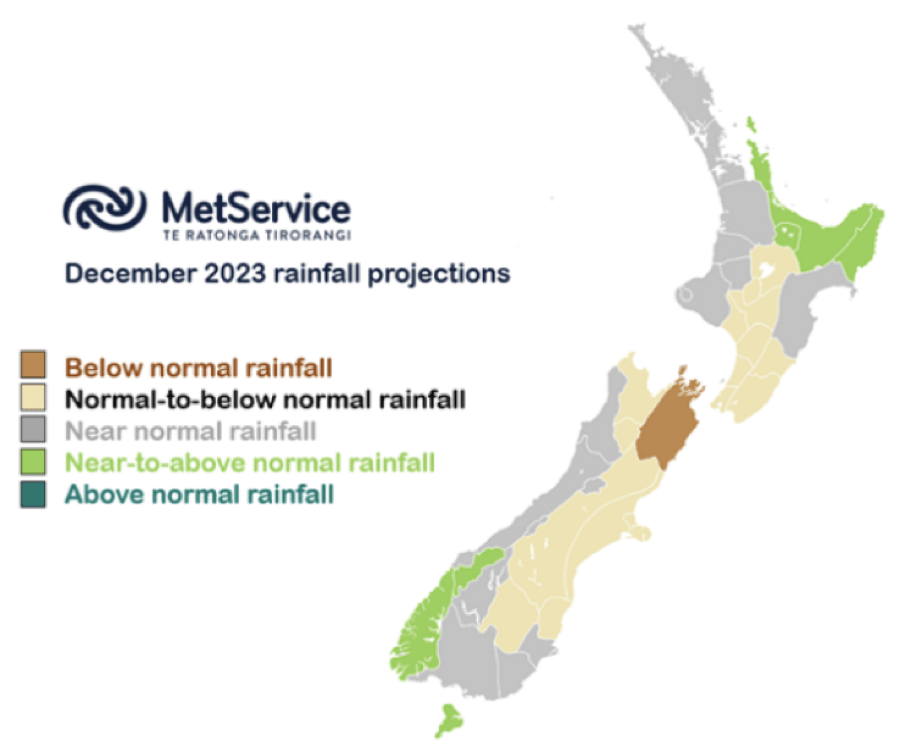
Climate outlook overview (from the MetService)
Climate Drivers — Whilst El Nino remains an important player for NZ, the Madden-Julian Oscillation (MJO), a climate driver tracked across the equator, looks set to help shake up the weather maps early in December, much like it did in November. A pulse of the MJO will move from the Maritime Continent (Southeast Asia) into the Western Pacific during the first half of the month. This will lead to more low pressure across the Australasian/NZ regions, with the belt of higher pressure likely displaced further southwards across South Island, similar to November, at least initially. El Nino is expected to peak in January 2024, continuing through into the autumn months. NZ typically sees the strongest effects of El Nino during late summer/early autumn.
December 2023 Outlook — As noted above, the MJO looks likely to help drive a rather unsettled opening to December, although the South Island might tap into drier weather under that southern ridge more often than not. A couple separate Tasman Sea low pressure systems from the weekend of the 2nd/3rd into the following week look likely to bring rainfall right across the country, but especially across North Island. If the second of these makes a connection with an increasingly active tropics to the north, we may well see some notably heavy falls for northern and northeastern portions of North Island too, but this remains far from certain at this early stage. Keeping a close eye on tropical developments to our north will be important through the first half of December. Heading beyond mid-month, higher than normal pressures are gradually favoured to return across the Tasman Sea, and to the north of New Zealand, with a more westerly pattern redeveloping across the South Island. This pattern is much more typical of El Nino, as the MJO pulse departs eastward. This will be welcome news for those of us across central and northern NZ who are hoping for some more prolonged sunshine as the summer holidays get started and hay-making season ramps up. These synoptic patterns even offer some early hope of a dry Christmas Day BBQ in these regions! Rainfall should become more frequent again for western and southern South Island though. With a predominantly westerly flow, eastern sections of South Island may well be in for some very hot early summer days alongside long dry runs too.
The Wholesale Gas Market
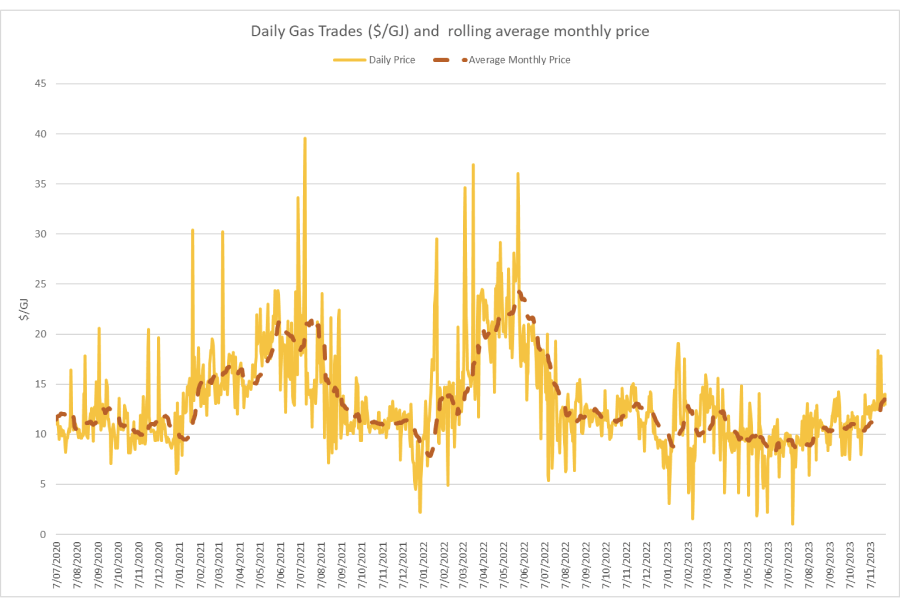
Spot gas prices jumped in November averaging $13.5/GJ – an increase of 27% in the month. Wholesale prices are now about 7% higher than they were at the same time last year.
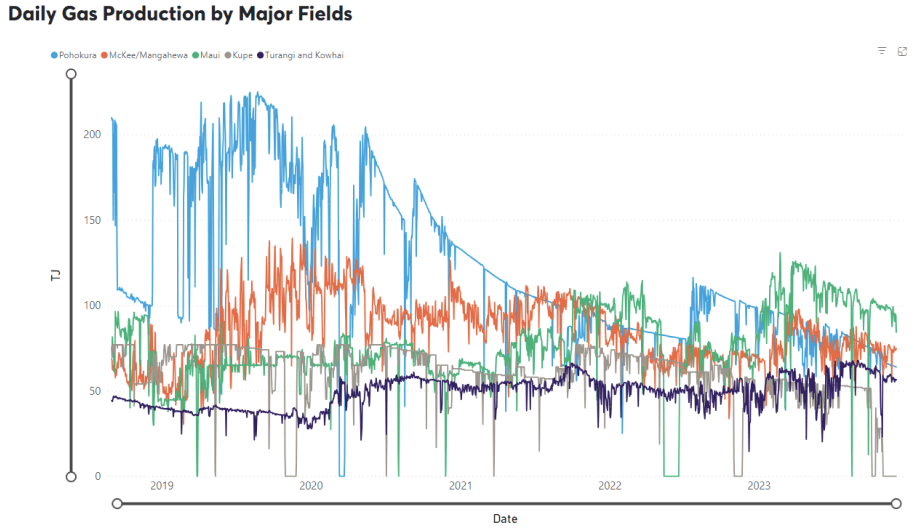
On the supply side the major constraint was the outage at Kupe taking production to zero for the whole of the month. All other fields had declining production through the month – Maui output averaging 97TJ/day (down 3%). Pohokura was down, averaging 66TJ/day (-7.5%), as was McKee / Mangahewa, down slightly at around 71.5TJ/day in November (-3% from October levels).
The following graph shows production levels from major fields over the last 4 years.
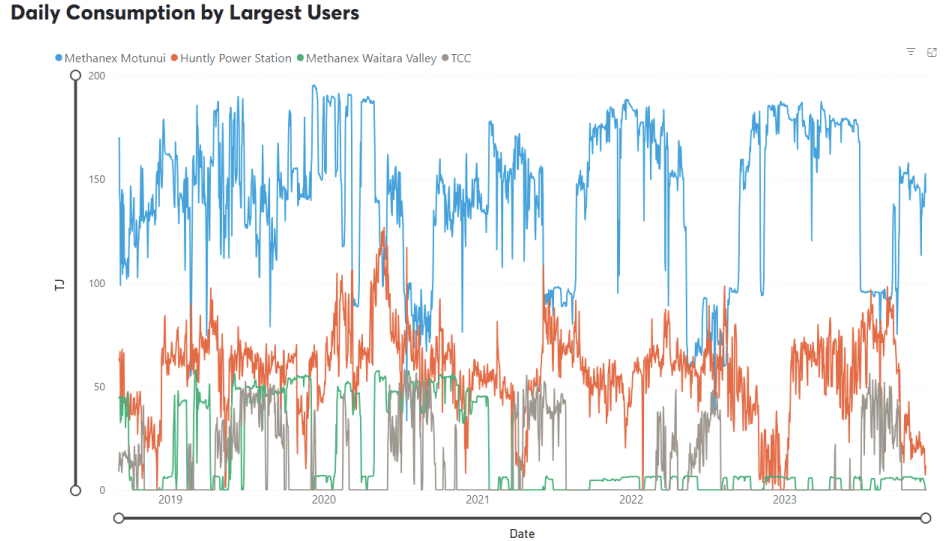
On the demand side, Methanex Motonui’s usage decreased in November to around 140TJ/day for most of the month. Huntly power station gas use reduced during the month, averaging 21TJ/day. TCC remained switched off all month.
The following graph shows trends in the major gas users over the last 4 years.
Internationally, LNG netback prices ended the month at $21.91GJ – up again 22% from last month. Forecast 2023 netback prices were also up marginally at $20 – + 1% on what the ACCC was forecasting in October. Forecast prices for 2024 fell sharply to $18.6 – down 20% compared to October.
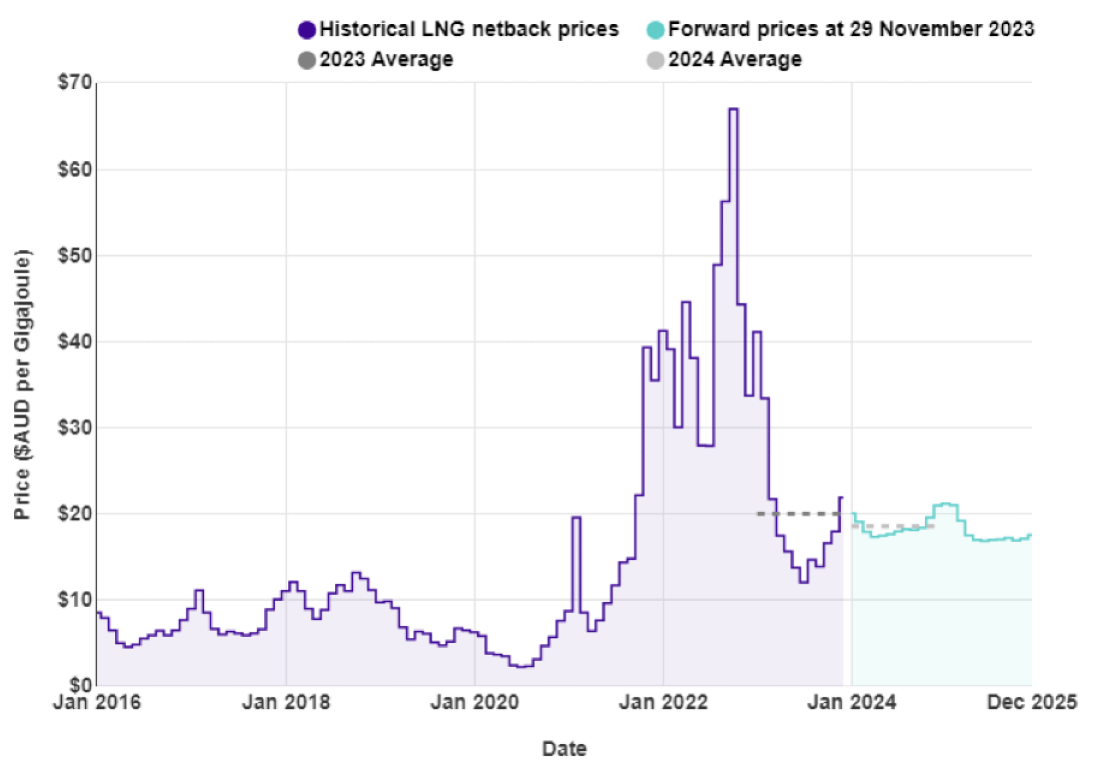
New Zealand does not have an LNG export market, so our domestic prices are not directly linked to global prices. However, some of our large gas users deal in international markets which are impacted by global gas prices, and they may try to produce more in NZ (increase demand) to take advantage of lower gas prices.
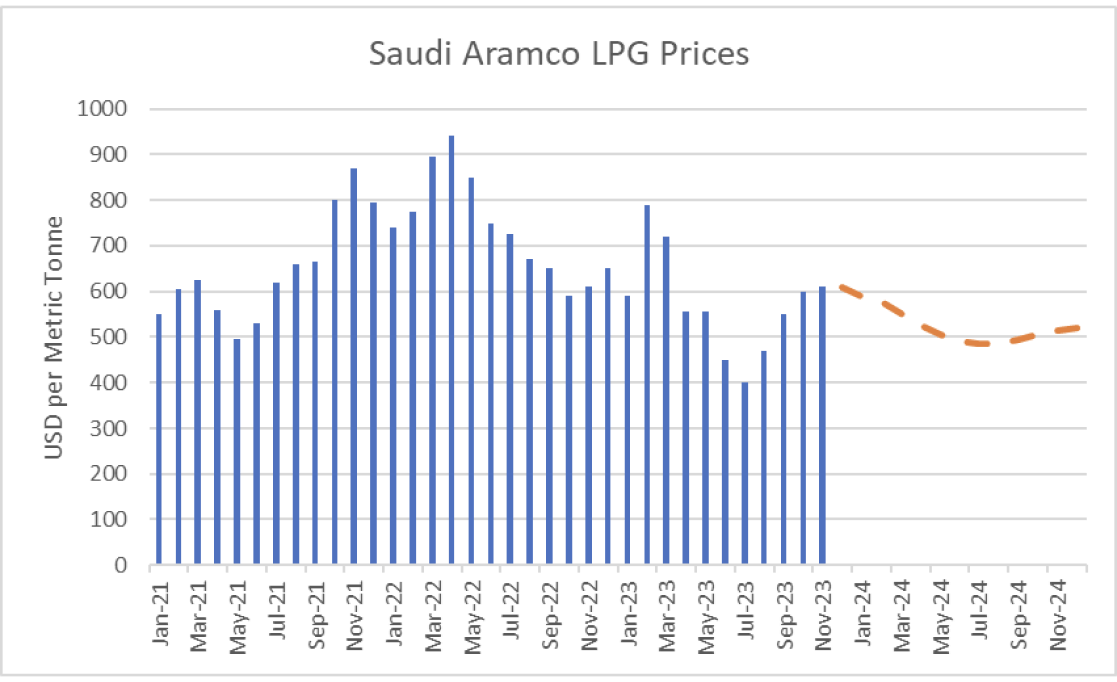
LPG is an important fuel for many large energy users, particularly in areas where reticulated natural gas is not available. The contract price of LPG is typically set by international benchmarks such as the Saudi Aramco LPG – normally quoted in US$ per metric tonne.
The following graph shows the Saudi Aramco LPG pricing for the last 3 years as well as forecast pricing for the year ahead.
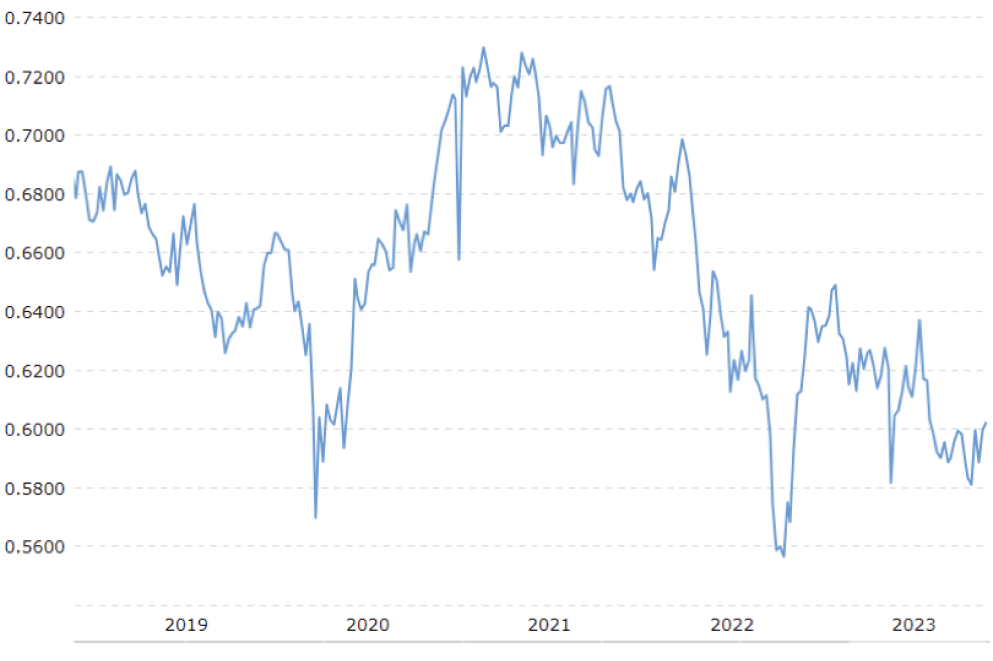
The other main contributing factor to LPG prices in New Zealand is the exchange rate against the USD. As shown below this has been falling over the last few years adding to domestic LPG prices.
The Coal Market
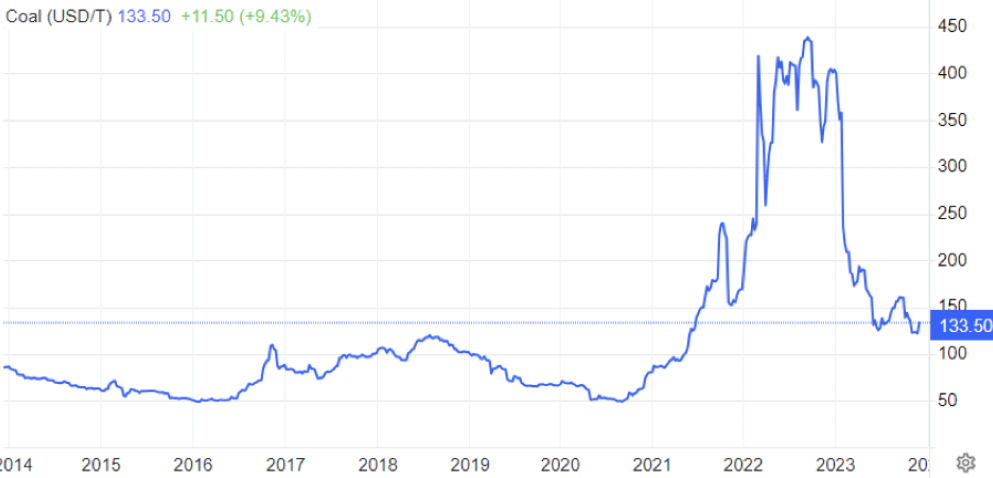
The global energy crisis has been as much about coal as it has gas. The war in the Ukraine has driven energy prices, including coal, up. Prices in November increased, ending the month at US$133.5/T – a 14% decrease on the October close. These prices, though well below the highs of the last 12 months, remain above what we expect to see as shown in the following graph of prices over the last 10 years.
Like gas, the price of coal can flow through and have an impact on the electricity market. However, coal stockpiles at Huntly are at the highest they have been for many years helping to assure the market that there is plenty of fuel available in the event of dry conditions in the hydro catchments.
Carbon Pricing
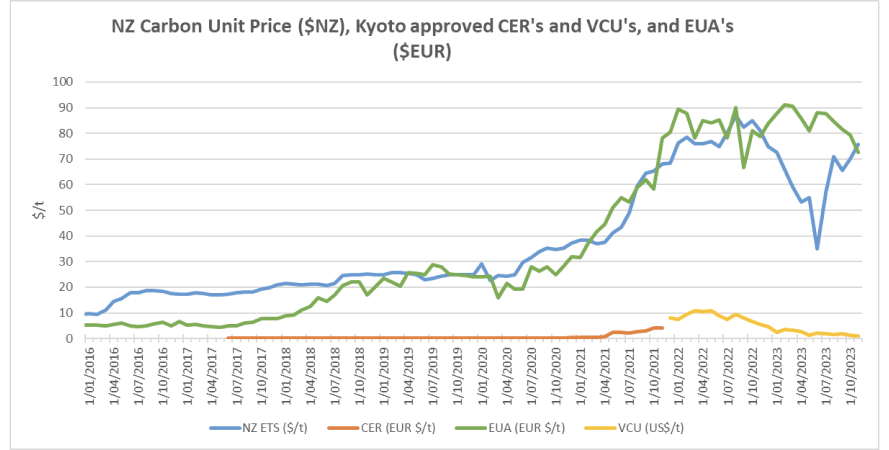
NZ has had an Emissions Trading Scheme (ETS) in place since 2008. It has been subsequently reviewed by several governments and is now an “uncapped” price scheme closely linked to international schemes. However, there are “upper and lower guard-rails” set up to prevent wild swings in carbon price that act as minimum and maximum prices. Currently these are set at $82 and $33 respectively, however they are going to increase in December after the Government recently accepted the Climate Change Commission’s recommendations to tighten the auction scheme. Carbon prices continued to increase in November, climbing a further 8% to $76.
As the carbon price rises, the cost of coal, gas or other fossil fuels used in process heat applications will naturally also rise. Electricity prices are also affected by a rising carbon price. Electricity prices are set by the marginal producing unit – in NZ this is currently typically coal or gas or hydro generators, with the latter valuing the cost of its water against the former. An increase in carbon price can lead to an increase in electricity prices in the short to medium term (as the marginal units set the price). A carbon price of $50/t is estimated to currently add about $25/MWh (or ~2.5c/kWh) to electricity prices. In the long term the impact should reduce as money is invested in more low-cost renewables and there is less reliance on gas and coal fired generation.
EU Carbon Permits decreased further in November to 72.5 Euro/tonne – down 9%.
About this Report
This energy market summary report provides information on wholesale price trends within the NZ Electricity Market.
Please note that all electricity prices are presented as a $ per MWh price and all carbon prices as a $ per unit price.
All spot prices are published by the Electricity Authority. Futures contract prices are sourced from ASX.
Further information can be found at the locations noted below.
- Transpower publishes a range of detailed information which can be found here: https://www.transpower.co.nz/power-system-live-data
- The Electricity Authority publishes a range of detailed information which can be found here: https://www.emi.ea.govt.nz/
- Weather and Climate data – The MetService publishes a range of weather-related information which can be found here: https://www.metservice.com/
Disclaimer
This document has been prepared for information and explanatory purposes only and is not intended to be relied upon by any person. This document does not form part of any existing or future contract or agreement between us. We make no representation, assurance, or guarantee as to the accuracy of the information provided. To the maximum extent permitted by law, none of Smart Power Ltd, its related companies, directors, employees or agents accepts any liability for any loss arising from the use of this document or its contents or otherwise arising out or, or in connection with it. You must not provide this document or any information contained in it to any third party without our prior consent.
About Smart Power
Smart Power is a full-service Energy Management consultancy. Apart from Energy Procurement, Smart Power can also provide:
- Technical Advice on how to reduce your energy use/emissions
- Sustainability Reporting
- Invoice Management services.
We also offer boutique energy and water billing service for landlords/property developers.
Contact us at https://smartpower1.wpenginepowered.com/contact/ or ring one of our offices to talk to one of our experienced staff about how we can assist you with achieving your energy goals.
© Copyright, 2023. Smart Power Ltd