
The Wholesale Electricity Market
Spot prices in the wholesale electricity market increased again in January. Average spot prices ranged from $183 in the lower South Island (up from $169 in December), up to $204 in the upper North Island (up from $184).

The following chart shows average weekly spot prices over the last 2 years. Prices rose steeply at the start of January before falling towards the end of the month. The recent see-sawing in prices can be clearly seen to the right of the graph.

Electricity Demand
Electricity demand in January is at the high end compared to recent years as shown below.

Electricity Generation Mix
Lower holiday period demand meant that hydro generation could be reduced allowing for storage to be conserved early in January. As demand picked up later in the month thermal generation increased as did hydro reflecting some increased inflows.

HVDC Transfer
Power transfers on the HVDC link connecting the North and South Islands are important both in showing relative hydro positions and the reliance on thermal power to meet demand. High northward flow tends to indicate a good SI hydro position, whereas the reverse indicates a heavy reliance on thermal power to make up for hydro shortages.
January saw northward transfer reduce and southward transfer increase to conserve SI hydro storage .

The Electricity Futures Market
The Futures Market provides an indication of where market participants see the spot market moving in the future. They are based on actual trades between participants looking to hedge their positions (as both buyers and sellers) into the future against potential spot market volatility. They are also a useful proxy for the direction of retail contracts.
The following graph shows Futures pricing for CY 2024, 2025, 2026 and 2027 at Otahuhu (Auckland) for the last 2 years.

Note that $100/MWh equates to 10c/kWh.
Forward prices were flat in January for all future years. CY 2025 was down slightly at $162 (-0.5%). CY 2026 price was unchanged at $152 while CY 2027 closed up slightly at $140/MWh (+0.5%).
Known new generation projects are shown below (additions / removals highlighted in bold).

Hydro Storage
Inflows were above average in the NI at the start of January and below average in the SI as shown in the following charts. SI Inflows did increase towards the end of the month (not shown in the charts).

Above average January inflows resulted in energy storage levels in the NI’s main hydro storage lake (Taupo) increasing through the month to close to maximum levels. In the SI, low inflows at the start of the month caused storage to fall before some substantial inflows later in the month brought storage back above average levels for this time of the year. NZ storage ended the month at 3,734GWh or 85% full, up 734GWh. The following chart shows the latest breakdown of storage across the main hydro catchments.

Security of supply risks decreased in January with storage levels increasing. We are currently slightly above the level we would typically expect to see for this time of year; and remain well above the risk zones. This is shown in the following risk curves.

Snowpack
Snowpack is an important way that hydro energy is stored over the winter months and released as hydro inflows in the spring. The following graph shows that the snowpack in the important Waitaki catchment is currently below mean levels seen in the last 30 years for this time of year.

Climate outlook overview (from the MetService)
Climate Drivers — As expected, the Madden-Julian Oscillation (MJO) became active over the tropics during the second half of the month and helped fire up TC Kirrily, which moved onto Australia’s Queensland coast late on the 25th. Ultimately, high pressure over the Tasman Sea kept this system away from NZ, but we did see sub-tropical moisture feed onto NZ at times during the second half of January, aiding some large rainfall events later in the month. The tropics look likely to remain active until mid-February and further named storms are possible over coming weeks, but there are increasing signs that these systems will remain well to the north of NZ. Warm sea surface temperatures associated with El Nino in the central Pacific have now peaked and the atmosphere could now play catch up through late summer and autumn.
February 2024 Outlook — As kids across NZ head back to school, it looks like the weather maps have been studying hard over the summer break with a textbook El Nino month on the cards this February. After El Nino impacts stuttered a bit through the first couple months of summer an enhanced westerly regime, with high pressure ridging persistent across northern NZ and regular fronts washing through south of the high (this is a classic signal during an El Nino summer), is likely to dominate over the next month. The high might win out across South Island at times too, but not as much as we have seen through early summer, and a more unsettled, windier outlook is favoured for the SW corner of New Zealand than over recent months. Near to above normal rainfall is expected for the west and south of the South Island, with the strongest signal for wetter conditions in Fiordland. Fronts should occasionally intrude into the dominant high pressure over the North Island, but any moisture these bring to western areas will likely be rapidly sucked out of the ground by persistent windy days. Eastern and northern areas are expected to be drier than normal, especially during the first half of the month. A cool start to the month, but temperatures should rebound around Waitangi Day. The second half of the month should see regular fluctuations with plenty of warm days still, but interspersed with cooler outbreaks, before an overall downwards trend towards the tail end of summer.

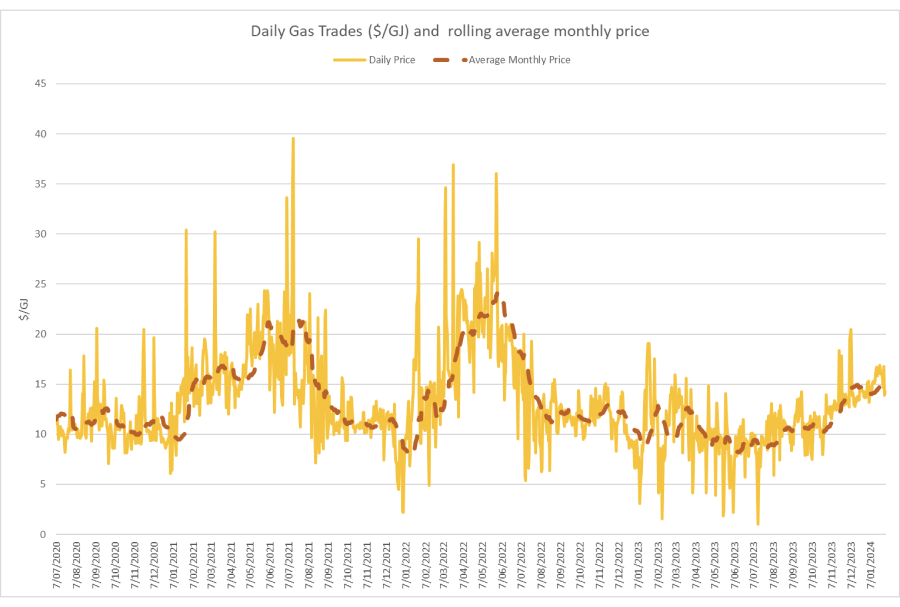
The Wholesale Gas Market
Spot gas prices increased again in January averaging $15.2/GJ – up 5% in the month. Wholesale prices are now about 43% higher than they were at the same time last year.
On the supply side the gradual decline in output across most fields continued through January. Maui started the month producing just under 100TJ per day, reducing to mid to low 80s by the end of the month. Pohokura started at around 62TJ, reducing to high 50s by months end. McKee / Mangahewa went from 70+TJ per day down to mid 60TJs across January. Kupe was the exception with production increasing from 40TJ at the start of the month, jumping to 50TJ and then again to 55TJ at the end of the month.
The following graph shows production levels from major fields over the last 4 years.

On the demand side, Methanex Motonui’s usage was flat through January at just below 150TJ/day for most of the month. Huntly power station gas use was also static during the month, averaging 44TJ/day, while TCC averaged around 35TJ per day until the end of the month when high inflows enabled it to be shut down.
The following graph shows trends in the major gas users over the last 4 years.

Methanex reported earnings during January when it was noted that their NZ production was forecast to be lower this year, at least partly due to expected gas supply constraints.
Internationally, LNG netback prices ended the month at $13.95/GJ – down 27% from last month. Forecast prices for 2024 fell again to $13.95 – down another 5% compared to December. Forecast prices for 2025 were also down 3% at $14.5/GJ.

New Zealand does not have an LNG export market, so our domestic prices are not directly linked to global prices. However, some of our large gas users deal in international markets which are impacted by global gas prices, and they may try to produce more in NZ (increase demand) to take advantage of lower gas prices.
LPG is an important fuel for many large energy users, particularly in areas where reticulated natural gas is not available. The contract price of LPG is typically set by international benchmarks such as the Saudi Aramco LPG – normally quoted in US$ per metric tonne.
The following graph shows the Saudi Aramco LPG pricing for the last 3 years as well as forecast pricing for the year ahead.

The other main contributing factor to LPG prices in New Zealand is the exchange rate against the USD. As shown below this has been falling over the last few years adding to domestic LPG prices.

The Coal Market
The global energy crisis has been as much about coal as it has gas. The war in the Ukraine has driven energy prices, including coal, up. Prices in January decreased, ending the month at US$116/T – a 22% drop on the December close. These prices are finally returning to levels close to what we expect to see as shown in the following graph of prices over the last 10 years.

Like gas, the price of coal can flow through and have an impact on the electricity market. However, coal stockpiles at Huntly are at the highest they have been for many years helping to assure the market that there is plenty of fuel available in the event of dry conditions in the hydro catchments.
Carbon Pricing
NZ has had an Emissions Trading Scheme (ETS) in place since 2008. It has been subsequently reviewed by several governments and is now an “uncapped” price scheme closely linked to international schemes. However, there are “upper and lower guard-rails” set up to prevent wild swings in carbon price that act as minimum and maximum prices. These increased in December 2023 to $173 and $64 respectively. Carbon prices increased 7% in January to $73.1.

As the carbon price rises, the cost of coal, gas or other fossil fuels used in process heat applications will naturally also rise. Electricity prices are also affected by a rising carbon price. Electricity prices are set by the marginal producing unit – in NZ this is currently typically coal or gas or hydro generators, with the latter valuing the cost of its water against the former. An increase in carbon price can lead to an increase in electricity prices in the short to medium term (as the marginal units set the price). A carbon price of $50/t is estimated to currently add about $25/MWh (or ~2.5c/kWh) to electricity prices. In the long term the impact should reduce as money is invested in more low-cost renewables and there is less reliance on gas and coal fired generation.
EU Carbon Permits decreased in January to 64 Euro/tonne – down 21%.
About this Report
This energy market summary report provides information on wholesale price trends within the NZ Electricity Market.
Please note that all electricity prices are presented as a $ per MWh price and all carbon prices as a $ per unit price.
All spot prices are published by the Electricity Authority. Futures contract prices are sourced from ASX.
Further information can be found at the locations noted below.
- Transpower publishes a range of detailed information which can be found here: https://www.transpower.co.nz/power-system-live-data
- The Electricity Authority publishes a range of detailed information which can be found here: https://www.emi.ea.govt.nz/
- Weather and Climate data – The MetService publishes a range of weather-related information which can be found here: https://www.metservice.com/
Disclaimer
This document has been prepared for information and explanatory purposes only and is not intended to be relied upon by any person. This document does not form part of any existing or future contract or agreement between us. We make no representation, assurance, or guarantee as to the accuracy of the information provided. To the maximum extent permitted by law, none of Smart Power Ltd, its related companies, directors, employees or agents accepts any liability for any loss arising from the use of this document or its contents or otherwise arising out or, or in connection with it. You must not provide this document or any information contained in it to any third party without our prior consent.
About Smart Power
Smart Power is a full-service Energy Management consultancy. Apart from Energy Procurement, Smart Power can also provide:
- Technical Advice on how to reduce your energy use/emissions
- Sustainability Reporting
- Invoice Management services.
We also offer boutique energy and water billing service for landlords/property developers.
Contact us at https://www.smartpower.co.nz/contact or ring one of our offices to talk to one of our experienced staff about how we can assist you with achieving your energy goals.
© Copyright, 2024. Smart Power Ltd


