
The Wholesale Electricity Market
Spot prices in the wholesale electricity market remained very high through April. Average spot prices ranged from $211 in the lower South Island (down from $224 in March), up to $232 in the upper North Island (up from $220).

The following chart shows average weekly spot prices over the last 2 years. Prices started the month high, reduced with some high inflows in the middle of the month before climbing again at the end of the month. The recent high prices can be clearly seen to the right of the graph.

Electricity Demand
Electricity demand through April remained above levels seen in recent years as shown below.

Electricity Generation Mix
Through April thermal generation was able to back off slightly with some increased hydro generation.

HVDC Transfer
Power transfers on the HVDC link connecting the North and South Islands are important both in showing relative hydro positions and the reliance on thermal power to meet demand. High northward flow tends to indicate a good SI hydro position, whereas the reverse indicates a heavy reliance on thermal power to make up for hydro shortages.
April saw increased SI inflows allow for more northward transfer while southward transfer decreased to close to zero.

The Electricity Futures Market
The Futures Market provides an indication of where market participants see the spot market moving in the future. They are based on actual trades between participants looking to hedge their positions (as both buyers and sellers) into the future against potential spot market volatility. They are also a useful proxy for the direction of retail contracts.
The following graph shows Futures pricing for CY 2024, 2025, 2026 and 2027 at Otahuhu (Auckland) for the last 2 years.

Note that $100/MWh equates to 10c/kWh.
Forward prices were up again in April for all future years. CY 2025 ended the month up 8% at $188.5. CY 2026 price was up 4% at $166 while CY 2027 closed up marginally at $148.5/MWh (+0.3%).
Known new generation projects are shown below (additions / removals / changes highlighted in bold).

Hydro Storage
Inflows were above average in both islands in April as shown in the following charts. The South Island had a large inflow event in the middle of the month.

Above average April inflows resulted in energy storage levels increasing. NZ storage ended the month at 3,436GWh or 77% full, up 357GWh. The following chart shows the latest breakdown of storage across the main hydro catchments.

Security of supply risks decreased in April with storage levels increasing. This is shown in the following risk curves.

Snowpack
Snowpack is an important way that hydro energy is stored over the winter months and released as hydro inflows in the spring. The following graph shows that the snowpack in the important Waitaki catchment is currently close to the mean levels seen in the last 30 years for this time of year.

Climate outlook overview (from the MetService)
Climate Drivers — Key oceanic markers are now below El Nino thresholds, and as we head towards neutral territory in the central and eastern tropical Pacific Ocean the 23-24 event is drawing to a close. However, it will still have a diminishing say on our weather maps through the rest of Autumn, with the atmosphere and weather often lagging the oceans. This means our enhanced southwest flows of March and April are still expected to be with us for a little while longer. Neutral El Nino Southern Oscillation (ENSO) conditions are expected through Winter, and this would typically see increased variability on our weather maps as shorter-term climate drivers take precedence. There is a growing signal that La Nina will develop into early Spring. Any effects from La Nina are unlikely to be seen until the summer and will be very dependent on its strength, which remains far from certain. The end of April also marks the end of the Southwest Pacific Tropical Cyclone Season. While Tropical Cyclones have been known to form in May in the past, this year the risk is considered Very Low to Low.
May 2024 Outlook — May 2023 was the warmest May on record in New Zealand as northerly airmasses plagued the weather maps, with a widespread marine heatwave in the waters surrounding the country. Fast-forward one year, and one El Nino event, and we are looking at a much-changed picture in the waters around New Zealand, with cool anomalies emerging right around the country and in the Southern Ocean to our south. With the weather maps expected to continue to sing off the Nino hymn sheet for a couple more months yet (albeit increasingly out of tune!) enhanced south-westerly winds are still likely to continue with us throughout May, often dragging in some very cold air from the south. With this air moving over much cooler seas this May than last, cool snaps are likely to have some notable bite to them over the final month of Autumn, making for a very different feel to this time last year. This will especially be the case over the opening fortnight of May where very cold southerly winds will be persistent, as high pressure sits slow-moving west of the South Island. While the odd front will move through, it is likely that our opening cold front on May 1st will bring the best of any rainfall for the majority of the country in the first half of the month. This front saw some very heavy falls for Wellington in particular, where 40-80mm fell in just 12 hours. Lots of dry Autumnal days with crisp sunshine are expected to develop during these opening two weeks, especially across the bulk of South Island, with only really Southland and Clutha tapping into more frequent southerly showers. Whenever winds are brisker, especially on those exposed coasts, woolly hats will be essential! The second half of May sees the axis of highest-pressure shift northwards into the northern Tasman Sea, opening the door to increased volatility and more regular frontal visitors from the west or southwest. This is your standard Autumnal fare, with two or three fronts a week moving quickly across the country, generally fading as they move over the North Island. A few of these fronts could pack a punch in terms of rainfall, especially for western and southern areas of New Zealand, so whilst the umbrellas might gather some dust early in May, it’ll pay to keep them handy from mid-month. With the increased volatility, temperatures should bounce around a bit more with some milder weather a possibility at times.

The Wholesale Gas Market
Spot gas prices increased significantly again in April averaging $21.85/GJ – up 12% in the month. Wholesale prices are now 145% higher than they were at the same time last year.

On the supply side there was a little relief with some increased output from some fields, though still not fully recovering to the levels of a few months ago. Pohokura increased mid-month from 36TJ/day to close to 50TJ/day – still below the pre-shutdown output of 57TJ per day. Maui maintained output through the month at around 77TJ/day. McKee / Mangahewa averaged low 60TJs across the month. Kupe also maintained output at 47.5TJ per day.
The following graph shows production levels from major fields over the last 6 years.

On the demand side, Methanex Motonui’s usage remained at the lower levels experienced in March providing the buffer for the reduced supply. Usage averaged close to 80TJ/day through April. Huntly power station decreased slightly, averaging 43TJ/day, while TCC shut down on the 10th April and remained that way for the rest of the month.
The following graph shows trends in the major gas users over the last 6 years.

Internationally, LNG netback prices ended the month at $12.56/GJ – up 15% from last month. Forecast prices for 2024 increased marginally to $13.62 – up 2% compared to March. Forecast prices for 2025 were also up 4% at $14.71/GJ.

New Zealand does not have an LNG export market, so our domestic prices are not directly linked to global prices. However, some of our large gas users deal in international markets which are impacted by global gas prices, and they may try to produce more in NZ (increase demand) to take advantage of lower gas prices when they occur.
LPG is an important fuel for many large energy users, particularly in areas where reticulated natural gas is not available. The contract price of LPG is typically set by international benchmarks such as the Saudi Aramco LPG – normally quoted in US$ per metric tonne.
The following graph shows the Saudi Aramco LPG pricing for the last 3 years as well as forecast pricing for the year ahead.

The other main contributing factor to LPG prices in New Zealand is the exchange rate against the USD. As shown below this has been falling over the last few years adding to domestic LPG prices.

The Coal Market
The global energy crisis has been as much about coal as it has gas. The war in the Ukraine has driven energy prices, including coal, up. Prices in April were up, ending the month at US$145/T – a 20% increase on the March close. These prices are finally returning to levels close to what we expect to see as shown in the following graph of prices over the last 10 years.

Like gas, the price of coal can flow through and have an impact on the electricity market. Last month Genesis reported that coal stockpiles had been reducing over the last couple of years. The Huntly coal stockpile held 624,000 tonnes at 31 March 2024, down from 731,000 tonnes at 31 December 2023, 859,000 tonnes at 30 September 2023, and 968,000 tonnes a year earlier.
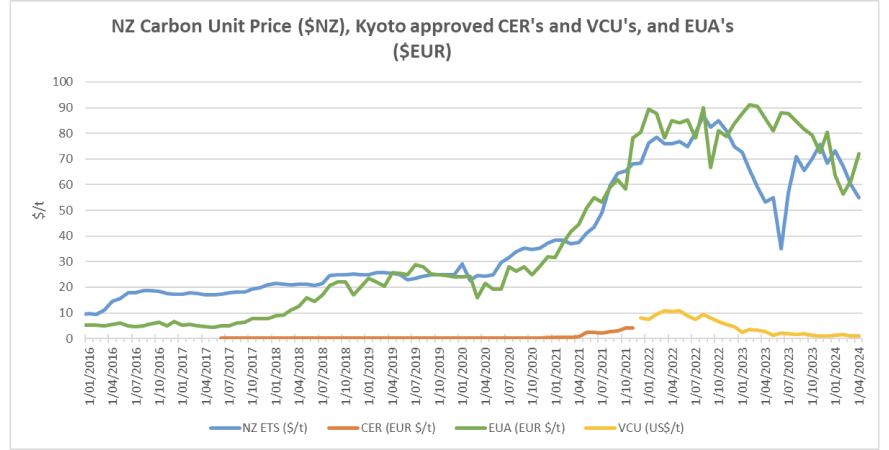
Carbon Pricing
NZ has had an Emissions Trading Scheme (ETS) in place since 2008. It has been subsequently reviewed by several governments and is now an “uncapped” price scheme closely linked to international schemes. However, there are “upper and lower guard-rails” set up to prevent wild swings in carbon price that act as minimum and maximum prices. These increased in December 2023 to $173 and $64 respectively. Carbon prices decreased a further 8% in April to $55.
As the carbon price rises, the cost of coal, gas or other fossil fuels used in process heat applications will naturally also rise. Electricity prices are also affected by a rising carbon price. Electricity prices are set by the marginal producing unit – in NZ this is currently typically coal or gas or hydro generators, with the latter valuing the cost of its water against the former. An increase in carbon price can lead to an increase in electricity prices in the short to medium term (as the marginal units set the price). A carbon price of $50/t is estimated to currently add about $25/MWh (or ~2.5c/kWh) to electricity prices. In the long term the impact should reduce as money is invested in more low-cost renewables and there is less reliance on gas and coal fired generation.
EU Carbon Permits increased in April to 72 Euro/tonne – up 17%.
About this Report
This energy market summary report provides information on wholesale price trends within the NZ Electricity Market.
Please note that all electricity prices are presented as a $ per MWh price and all carbon prices as a $ per unit price.
All spot prices are published by the Electricity Authority. Futures contract prices are sourced from ASX.
Further information can be found at the locations noted below.
- Transpower publishes a range of detailed information which can be found here: https://www.transpower.co.nz/power-system-live-data
- The Electricity Authority publishes a range of detailed information which can be found here: https://www.emi.ea.govt.nz/
- Weather and Climate data – The MetService publishes a range of weather-related information which can be found here: https://www.metservice.com/
Disclaimer
This document has been prepared for information and explanatory purposes only and is not intended to be relied upon by any person. This document does not form part of any existing or future contract or agreement between us. We make no representation, assurance, or guarantee as to the accuracy of the information provided. To the maximum extent permitted by law, none of Smart Power Ltd, its related companies, directors, employees or agents accepts any liability for any loss arising from the use of this document or its contents or otherwise arising out or, or in connection with it. You must not provide this document or any information contained in it to any third party without our prior consent.
About Smart Power
Smart Power is a full-service Energy Management consultancy. Apart from Energy Procurement, Smart Power can also provide:
- Technical Advice on how to reduce your energy use/emissions
- Sustainability Reporting
- Invoice Management services.
We also offer boutique energy and water billing service for landlords/property developers.
Contact us at https://www.smartpower.co.nz/contact or ring one of our offices to talk to one of our experienced staff about how we can assist you with achieving your energy goals.
© Copyright, 2024. Smart Power Ltd


