
Market Update March 2024
The Wholesale Electricity Market
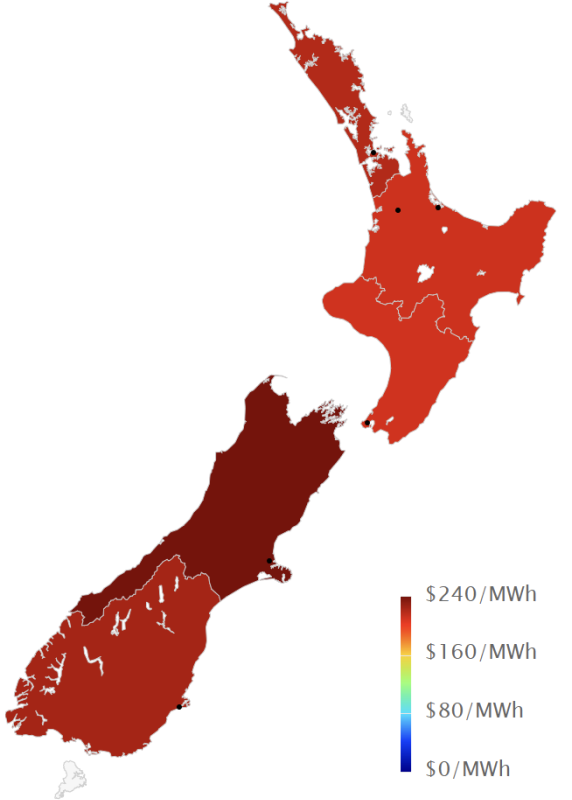
Spot prices in the wholesale electricity market increased significantly in March. Average spot prices ranged from $211 in the lower North Island (up from $153 in February), up to $245 in the upper South Island (up from $145).
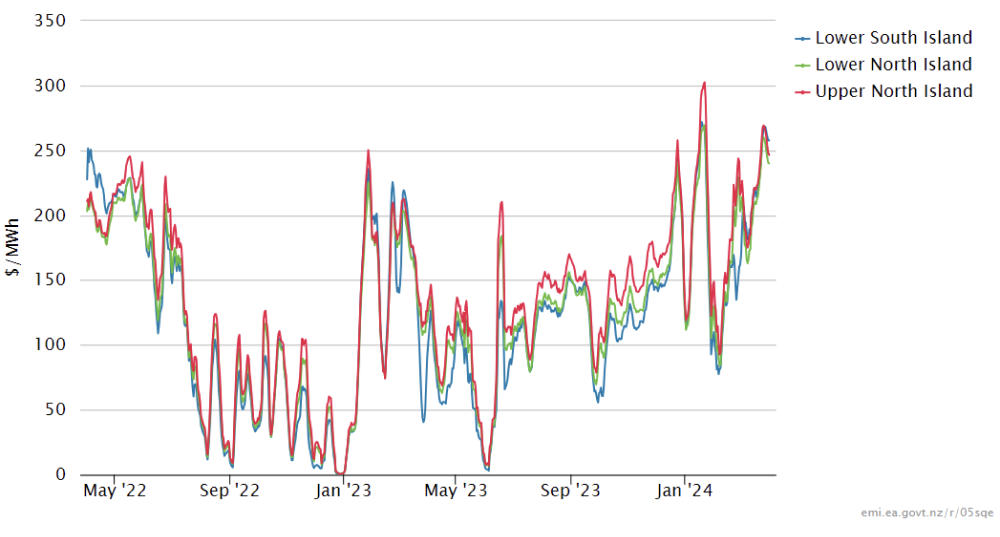
The following chart shows average weekly spot prices over the last 2 years. After a small fall at the start of March, prices rose steadily throughout the rest of the month. The recent upward trend in prices can be clearly seen to the right of the graph.
Electricity Demand
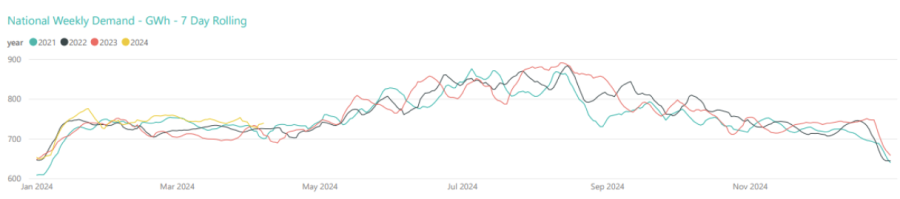
Electricity demand through March remained at the high end and above recent years as shown below.
Electricity Generation Mix
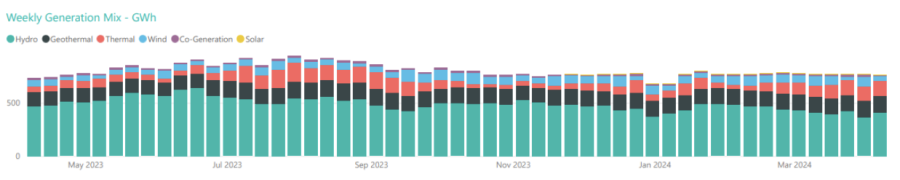
Throughout March thermal generation has picked up displacing hydro to try to conserve hydro storage.
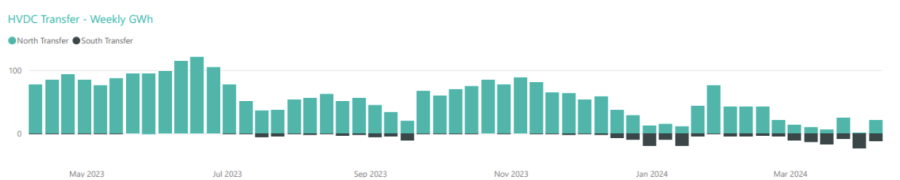
HVDC Transfer
Power transfers on the HVDC link connecting the North and South Islands are important both in showing relative hydro positions and the reliance on thermal power to meet demand. High northward flow tends to indicate a good SI hydro position, whereas the reverse indicates a heavy reliance on thermal power to make up for hydro shortages.
March saw northward transfer reduce and southward transfer increase to conserve SI hydro storage.
The Electricity Futures Market
The Futures Market provides an indication of where market participants see the spot market moving in the future. They are based on actual trades between participants looking to hedge their positions (as both buyers and sellers) into the future against potential spot market volatility. They are also a useful proxy for the direction of retail contracts.
The following graph shows Futures pricing for CY 2024, 2025, 2026 and 2027 at Otahuhu (Auckland) for the last 2 years.
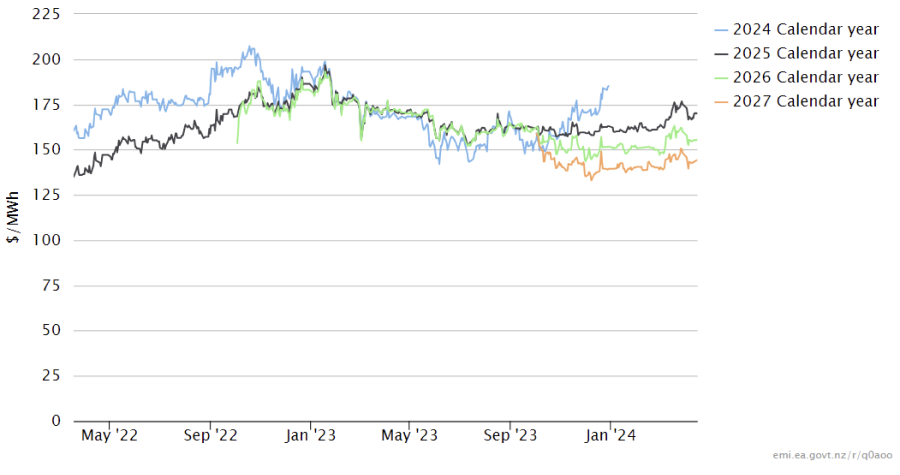
Note that $100/MWh equates to 10c/kWh.
Forward prices were up in March for all future years. CY 2025 ended the month up 7% at $175. CY 2026 price was up 9% at $160 while CY 2027 closed up at $148/MWh (+6%).
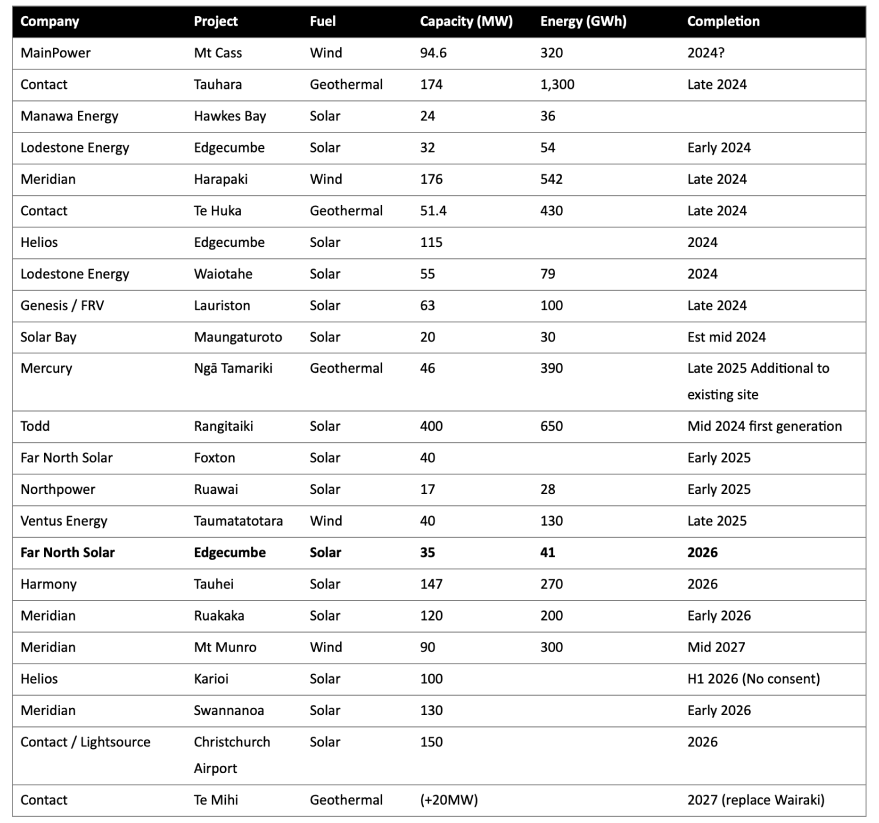
Known new generation projects are shown below (additions / removals highlighted in bold).
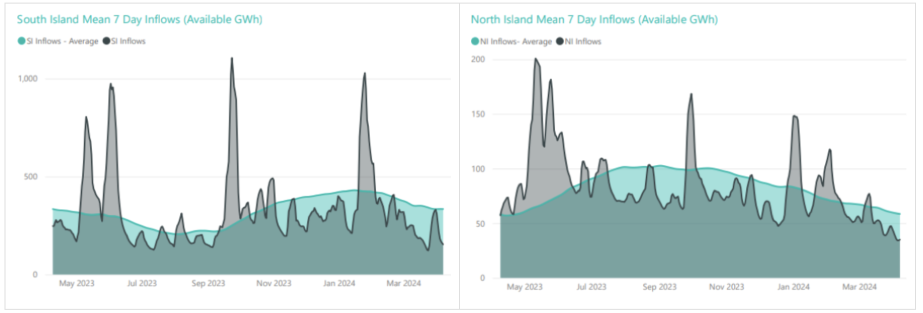
Hydro Storage
Inflows were below average in both islands for most of March as shown in the following charts.
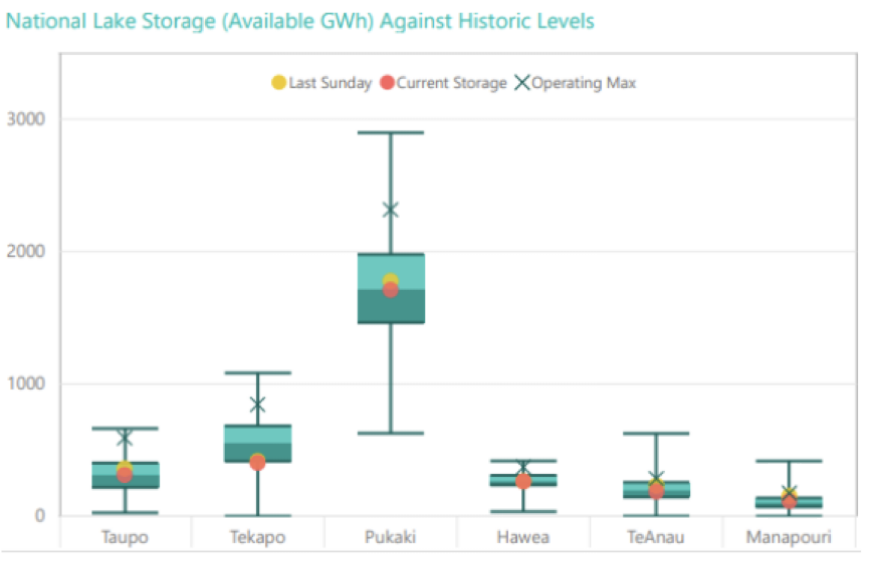
Below average March inflows resulted in energy storage levels falling. NZ storage ended the month at 3,079GWh or 69% full, down 375GWh. The following chart shows the latest breakdown of storage across the main hydro catchments.
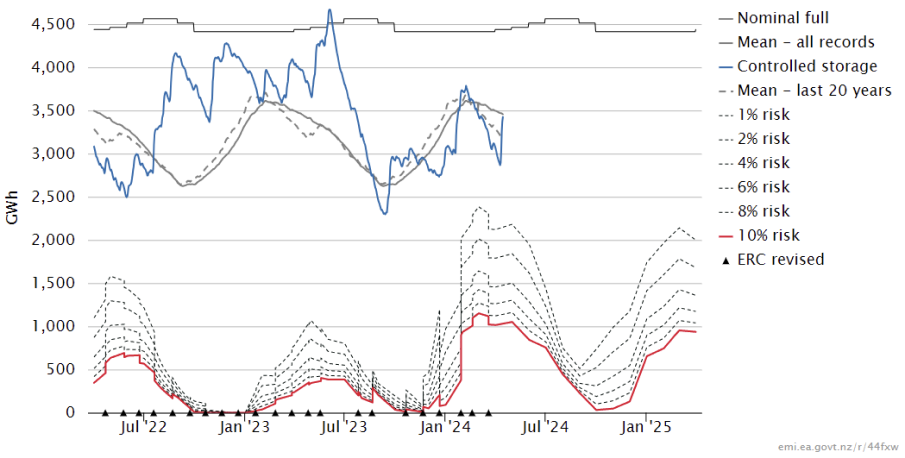
Security of supply risks increased in March with storage levels decreasing. Note that since the start of April significant inflows have occurred which have brought storage back to close to the level we would typically expect to see for this time of year; and well above the risk zones. This is shown in the following risk curves.
Snowpack
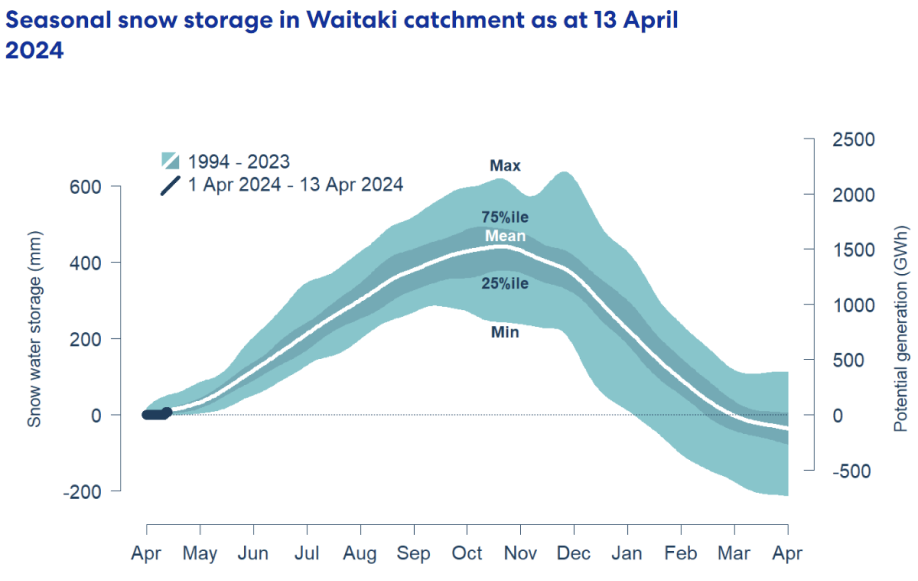
Snowpack is an important way that hydro energy is stored over the winter months and released as hydro inflows in the spring. The following graph shows that the snowpack in the important Waitaki catchment is currently close to the mean levels seen in the last 30 years for this time of year.
Climate outlook overview (from the MetService)
Climate Drivers — El Nino is nearly at its end, with equatorial sea surface temperatures likely to return to neutral conditions in the next two months. However, as atmospheric markers generally lag oceanic indicators, New Zealand is still likely to see periods of enhanced westerly flows through much of autumn. Models are split evenly between keeping a neutral El Nino state or developing a weak La Nina over the coming months, and any effects are unlikely to be seen until the summer. The next pulse of Madden-Julian Oscillation (MJO) is expected from the middle of April, though early indications are downplaying its intensity in favour of maintaining an active westerly flow across the country. Regardless, there remains a slightly increased risk of tropical influence from mid-month, particularly across the upper North Island.
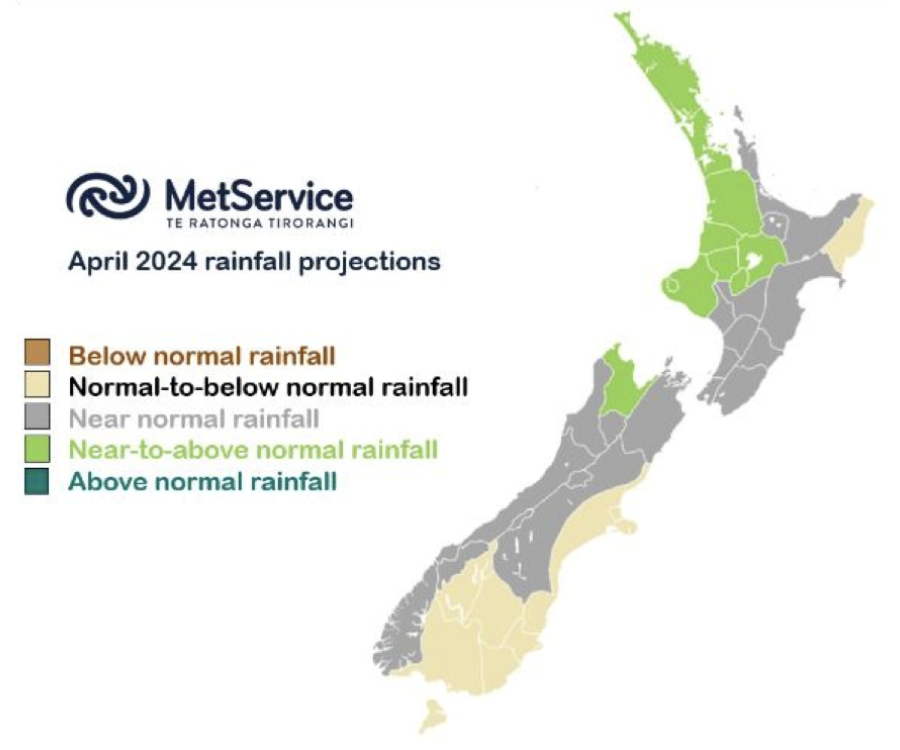
April 2024 Outlook — Cooler conditions prevail during the first week of April as a weakening front brings a burst of heavy rain to parts of western South Island, while the remainder of New Zealand remains largely dry with gradually warming afternoon temperatures but chilly mornings. A more active weather pattern emerges next week, with a hybrid system approaching from both the Tasman Sea and Southern Ocean. This is likely to be the wettest week this month across many regions, with some heavy rain and potential for downpours. This could also be the warmest period of April across the North Island if a large-scale northerly wind stalls over the country. The strong low pressure anomaly stalls southeast of New Zealand by mid-month, with a heightened risk of south-to-southeasterly winds delivering much colder conditions across the board. Frosts may become commonplace about inland areas during this time, and the odd hard frost cannot be ruled out about the South Island high country. Rainfall should trend close to normal under passing showers, though western South Island is at-risk of seeing below-normal precipitation. The final week of April sees very little in the way of rainfall or temperature anomalies, with a likely mix of weakening fronts spreading across the country alongside passing highs.
The Wholesale Gas Market
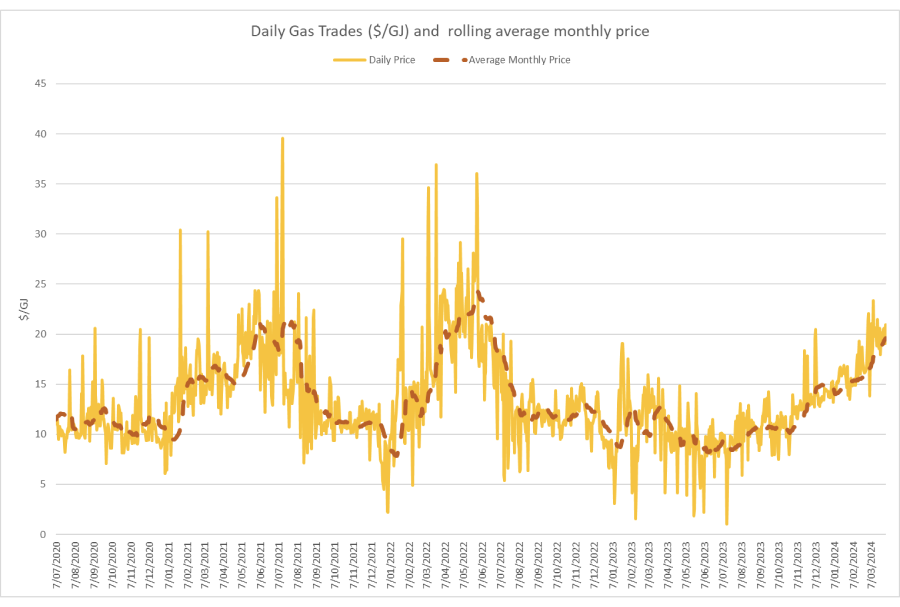
Spot gas prices increased significantly in March averaging $19.5/GJ – up 22% in the month. Wholesale prices are now about 59% higher than they were at the same time last year.
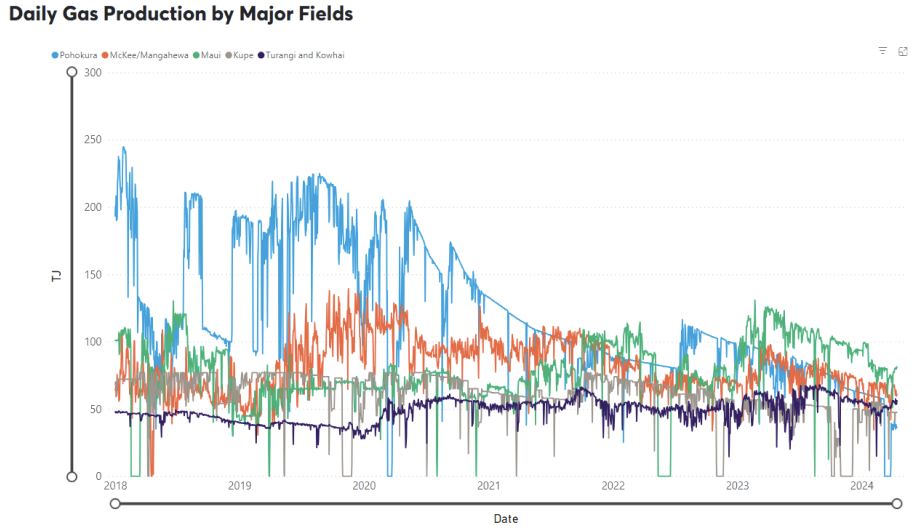
On the supply side the gradual decline in output across most fields continued through March, exacerbated by an 18 day shutdown at Pohokura, followed by a significant drop in output on its return. Maui started the month producing just under 80TJ per day, reducing to mid 70s by the end of the month. Pohokura started the month averaging 57TJ per day, returning after its shutdown averaging mid 30TJ per day. McKee / Mangahewa averaged low 60TJs across the month. Kupe also dropped away during the month from mid- 50s at the start of the month to 47.5TJ per day at the end of the month.
The following graph shows production levels from major fields over the last 6 years.
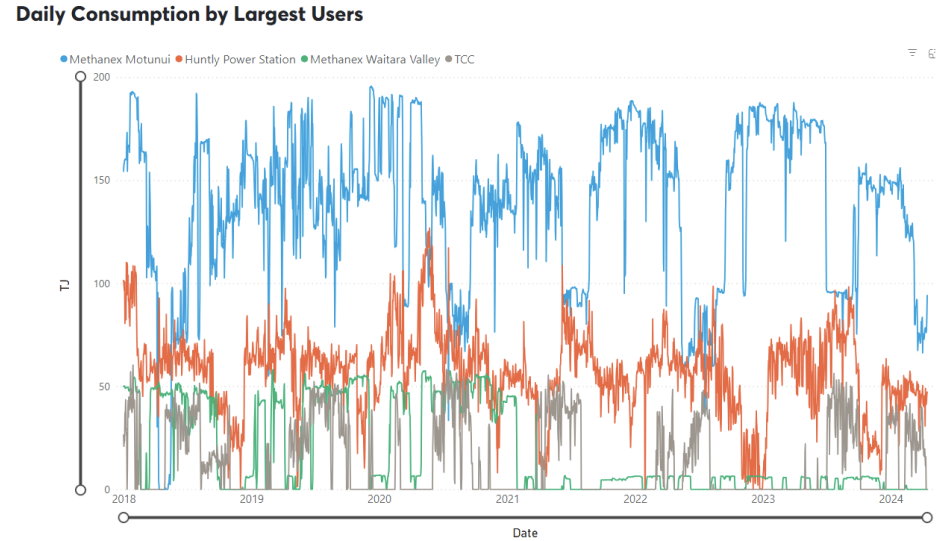
On the demand side, Methanex Motonui’s usage declined through March providing the buffer for the reduced supply. Usage started the month in the low 120TJ/day, dropping to close to 80TJ/day for the rest of the month – even after Pohokura returned. Huntly power station decreased slightly, averaging 46TJ/day, while TCC operated throughout the whole month, averaging 25TJ per day.
The following graph shows trends in the major gas users over the last 6 years.
Internationally, LNG netback prices ended the month at $10.94/GJ – down a further 9% from last month. Forecast prices for 2024 increased to $13.32 – up 4% compared to February. Forecast prices for 2025 were also up 5% at $14.1/GJ.
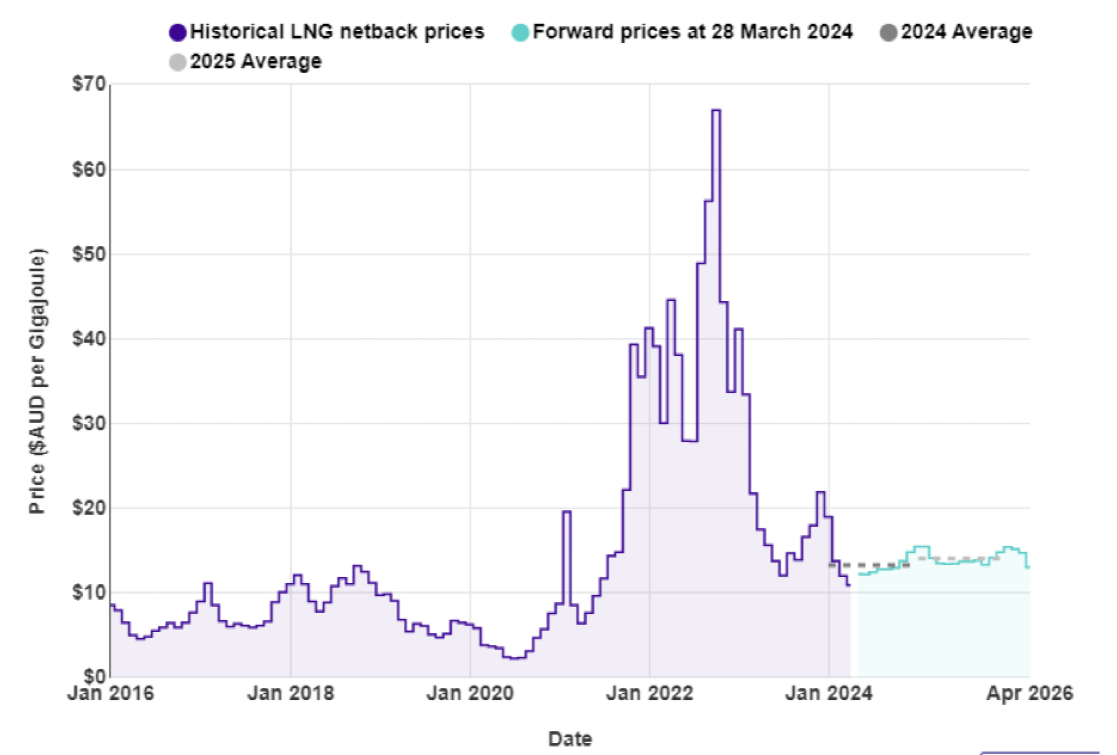
New Zealand does not have an LNG export market, so our domestic prices are not directly linked to global prices. However, some of our large gas users deal in international markets which are impacted by global gas prices, and they may try to produce more in NZ (increase demand) to take advantage of lower gas prices when they occur.
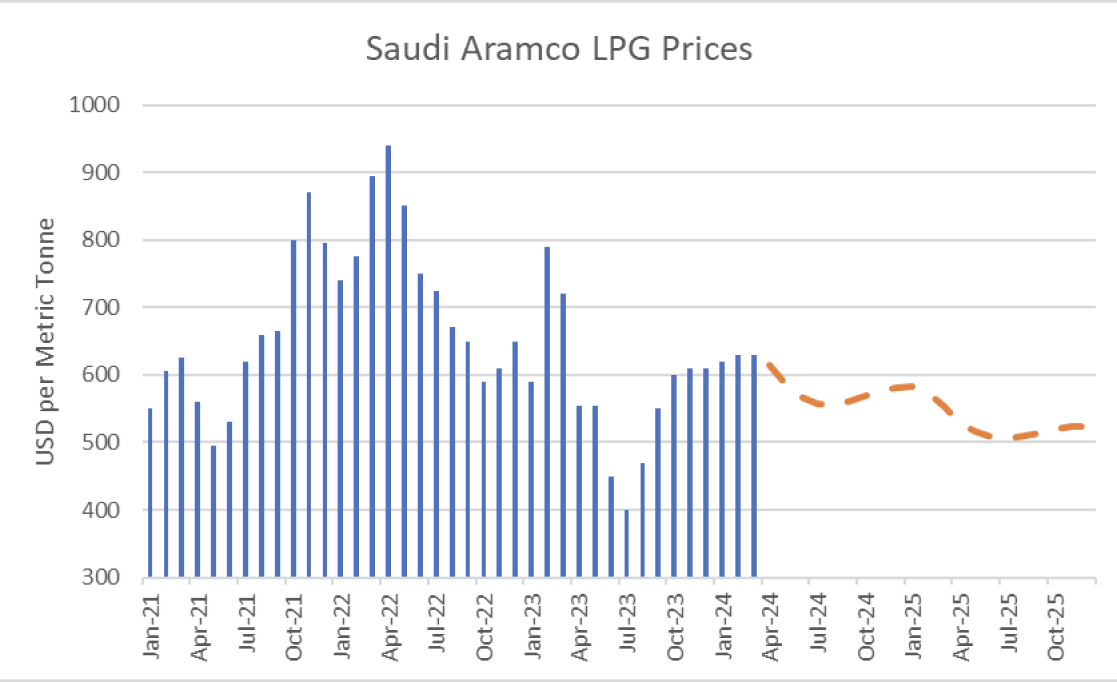
LPG is an important fuel for many large energy users, particularly in areas where reticulated natural gas is not available. The contract price of LPG is typically set by international benchmarks such as the Saudi Aramco LPG – normally quoted in US$ per metric tonne.
The following graph shows the Saudi Aramco LPG pricing for the last 3 years as well as forecast pricing for the year ahead.
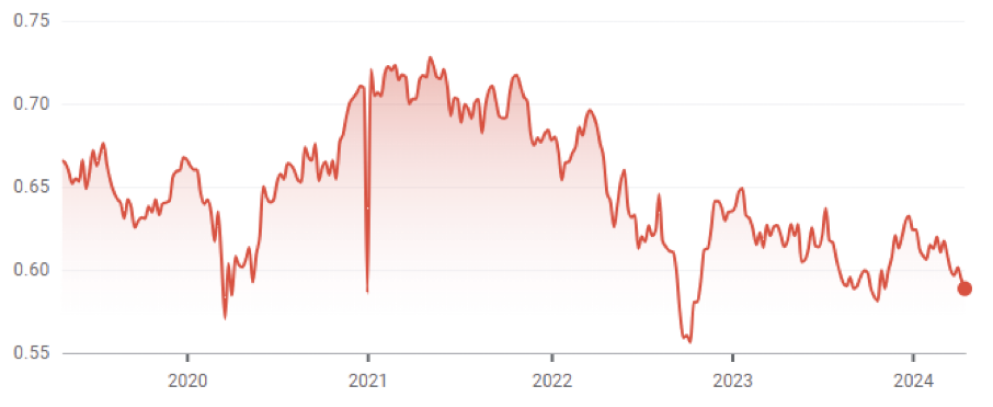
The other main contributing factor to LPG prices in New Zealand is the exchange rate against the USD. As shown below this has been falling over the last few years adding to domestic LPG prices.
The Coal Market
The global energy crisis has been as much about coal as it has gas. The war in the Ukraine has driven energy prices, including coal, up. Prices in March were down slightly, ending the month at US$121/T – an 8% drop on the February close. These prices are finally returning to levels close to what we expect to see as shown in the following graph of prices over the last 10 years.
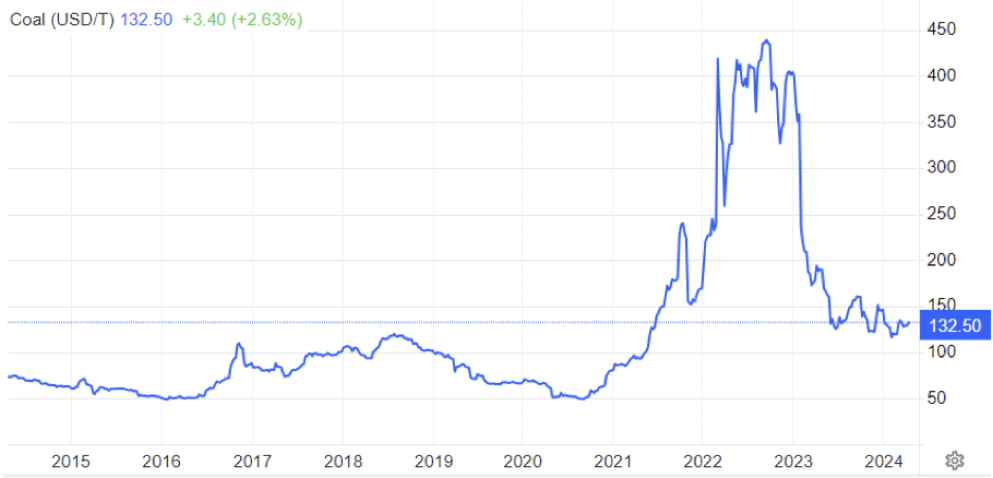
Like gas, the price of coal can flow through and have an impact on the electricity market. However, coal stockpiles at Huntly are at the highest they have been for many years helping to assure the market that there is plenty of fuel available in the event of dry conditions in the hydro catchments.
Carbon Pricing
NZ has had an Emissions Trading Scheme (ETS) in place since 2008. It has been subsequently reviewed by several governments and is now an “uncapped” price scheme closely linked to international schemes. However, there are “upper and lower guard-rails” set up to prevent wild swings in carbon price that act as minimum and maximum prices. These increased in December 2023 to $173 and $64 respectively. Carbon prices decreased a further 11% in March to $60.
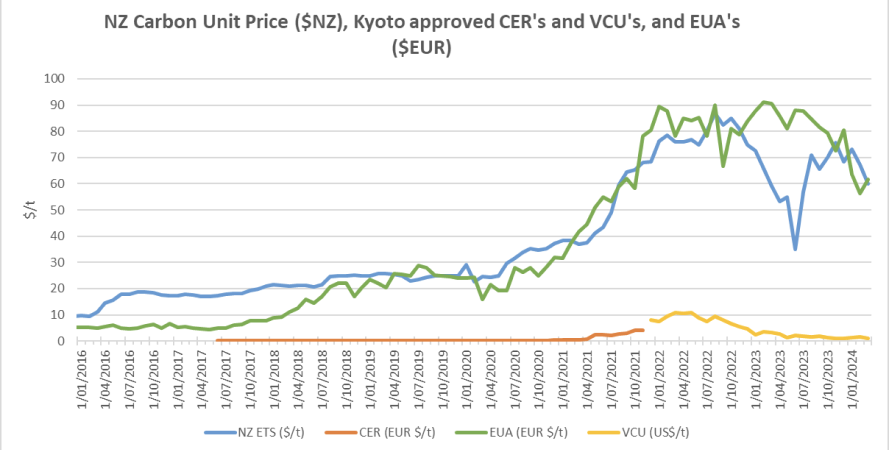
As the carbon price rises, the cost of coal, gas or other fossil fuels used in process heat applications will naturally also rise. Electricity prices are also affected by a rising carbon price. Electricity prices are set by the marginal producing unit – in NZ this is currently typically coal or gas or hydro generators, with the latter valuing the cost of its water against the former. An increase in carbon price can lead to an increase in electricity prices in the short to medium term (as the marginal units set the price). A carbon price of $50/t is estimated to currently add about $25/MWh (or ~2.5c/kWh) to electricity prices. In the long term the impact should reduce as money is invested in more low-cost renewables and there is less reliance on gas and coal fired generation.
EU Carbon Permits Increased in March to 62 Euro/tonne – up 10%.
About this Report
This energy market summary report provides information on wholesale price trends within the NZ Electricity Market.
Please note that all electricity prices are presented as a $ per MWh price and all carbon prices as a $ per unit price.
All spot prices are published by the Electricity Authority. Futures contract prices are sourced from ASX.
Further information can be found at the locations noted below.
- Transpower publishes a range of detailed information which can be found here: https://www.transpower.co.nz/power-system-live-data
- The Electricity Authority publishes a range of detailed information which can be found here: https://www.emi.ea.govt.nz/
- Weather and Climate data – The MetService publishes a range of weather-related information which can be found here: https://www.metservice.com/
Disclaimer
This document has been prepared for information and explanatory purposes only and is not intended to be relied upon by any person. This document does not form part of any existing or future contract or agreement between us. We make no representation, assurance, or guarantee as to the accuracy of the information provided. To the maximum extent permitted by law, none of Smart Power Ltd, its related companies, directors, employees or agents accepts any liability for any loss arising from the use of this document or its contents or otherwise arising out or, or in connection with it. You must not provide this document or any information contained in it to any third party without our prior consent.
About Smart Power
Smart Power is a full-service Energy Management consultancy. Apart from Energy Procurement, Smart Power can also provide:
- Technical Advice on how to reduce your energy use/emissions
- Sustainability Reporting
- Invoice Management services.
We also offer boutique energy and water billing service for landlords/property developers.
Contact us at https://smartpower1.wpenginepowered.com/contact/ or ring one of our offices to talk to one of our experienced staff about how we can assist you with achieving your energy goals.
© Copyright, 2024. Smart Power Ltd