
Tag: NZ Electricity Market
Market Update April 2025
The Wholesale Electricity Market
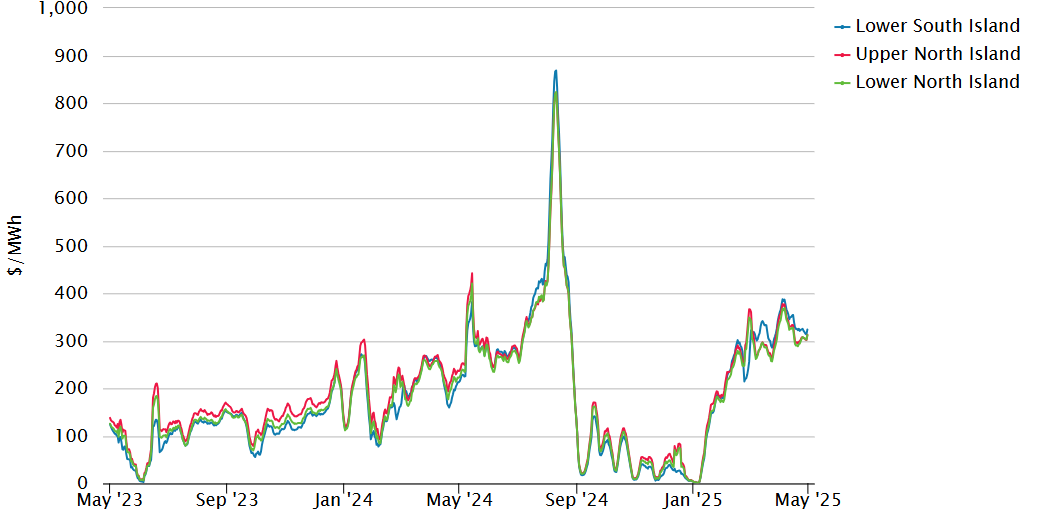
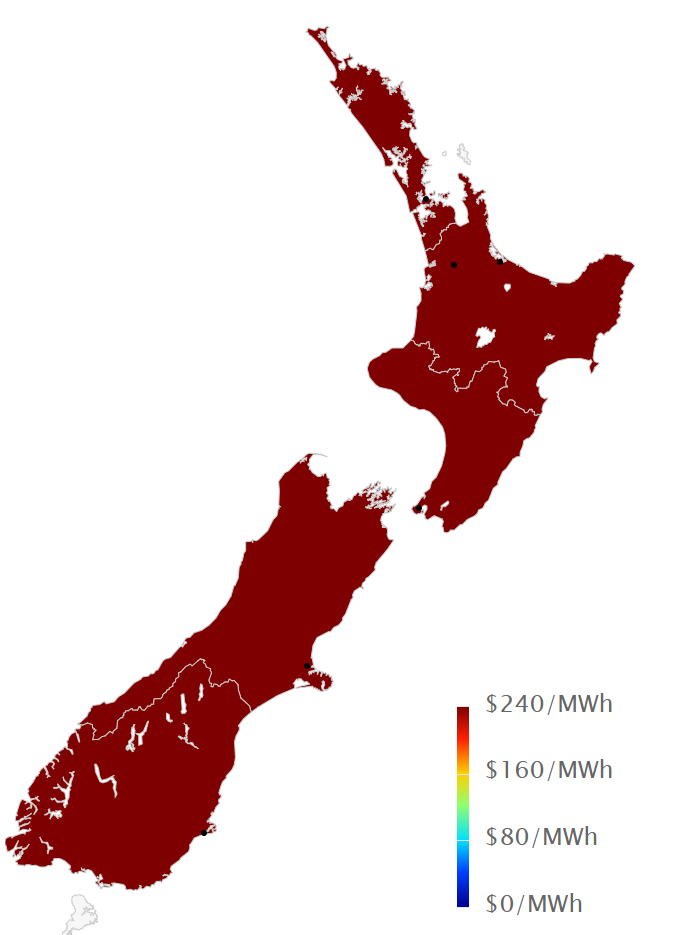
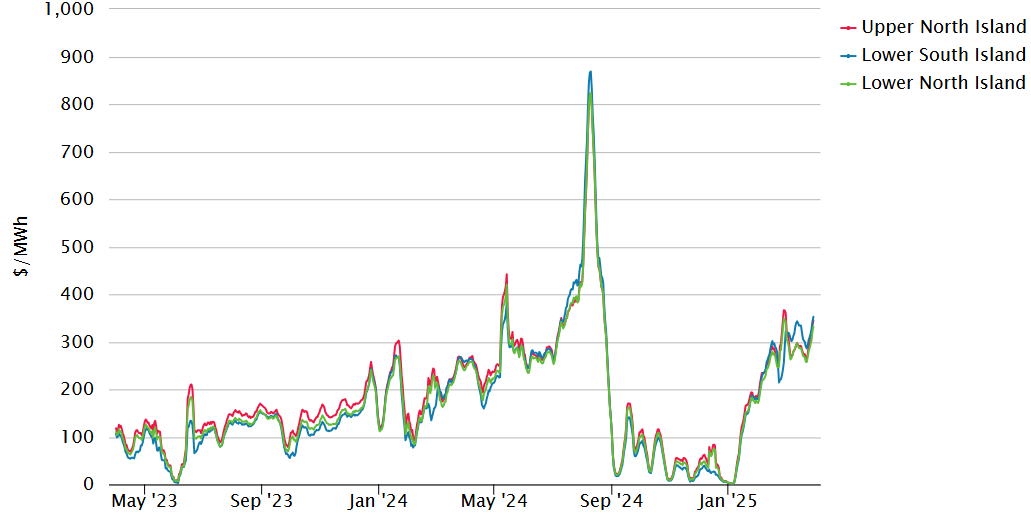
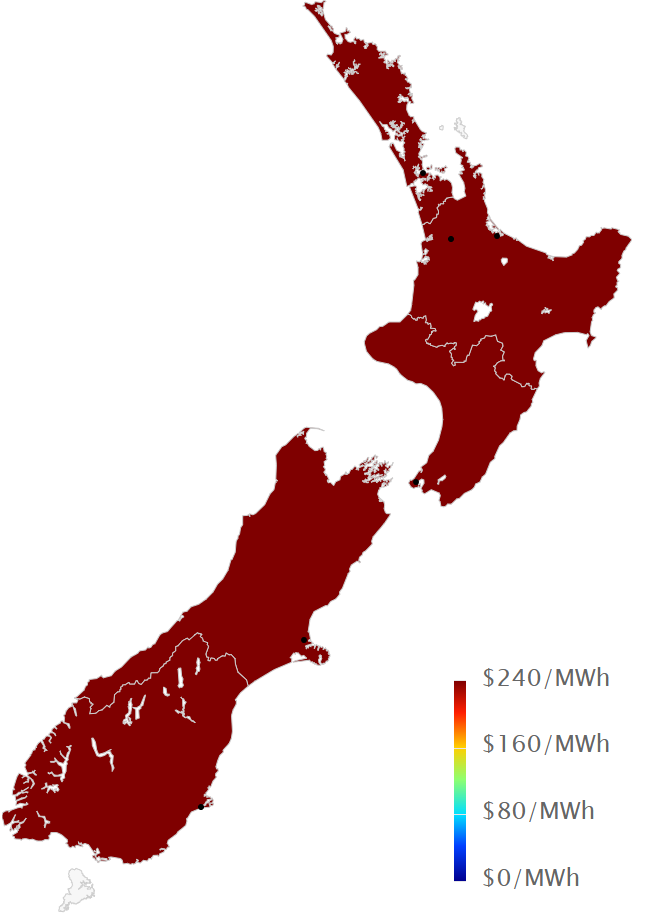
Spot prices in the wholesale electricity market for April increased again from March’s already very high levels. Average spot prices for the month ranged from $308 in the central North Island (up from $272 in March) to $350 in the upper South Island ($320 in March).

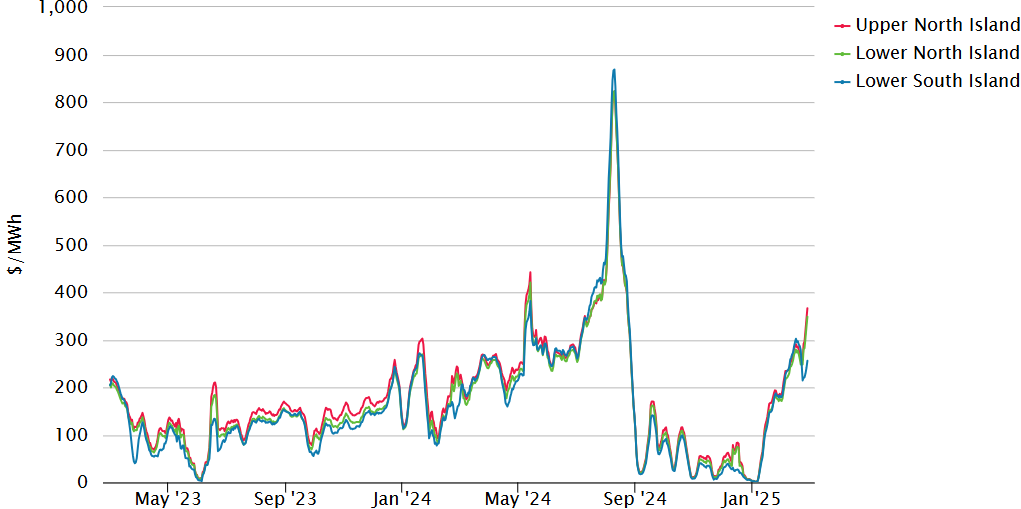
The following chart shows average weekly spot prices over the last 2 years. The large increase since January can be clearly seen.
Electricity Demand
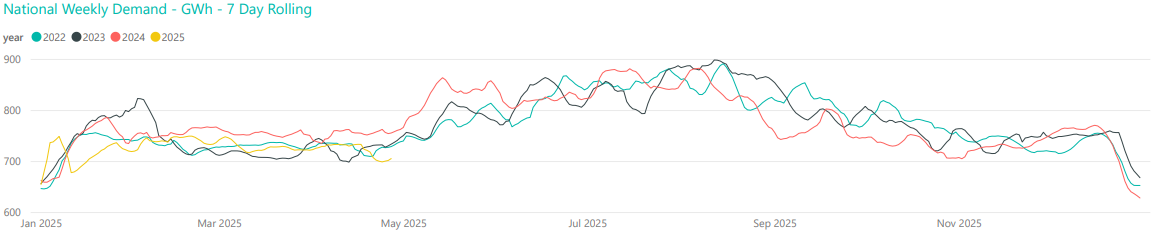
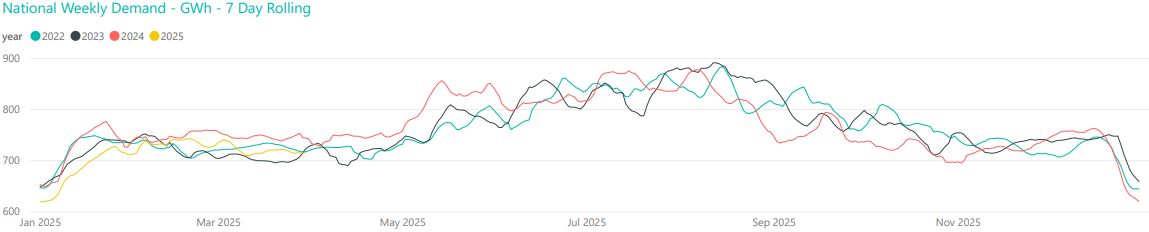
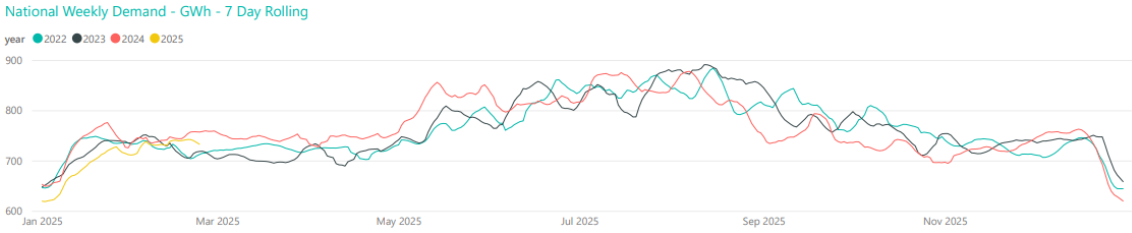
Electricity demand in April was close to average for most of the month, compared to what we have seen in recent years, but dropped to below average towards the end of the month, as shown below.
Electricity Generation Mix
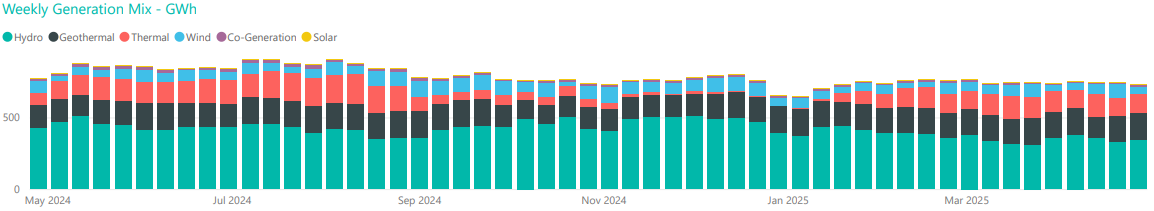
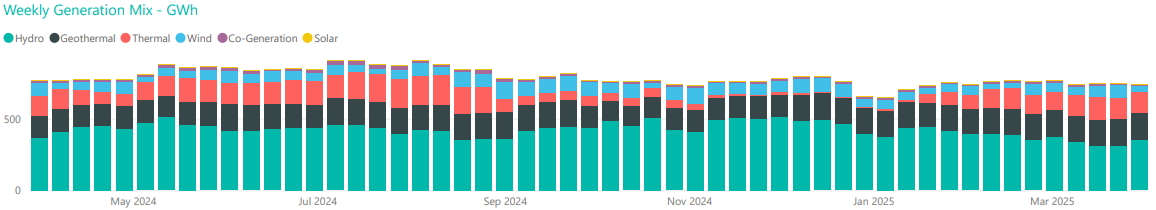
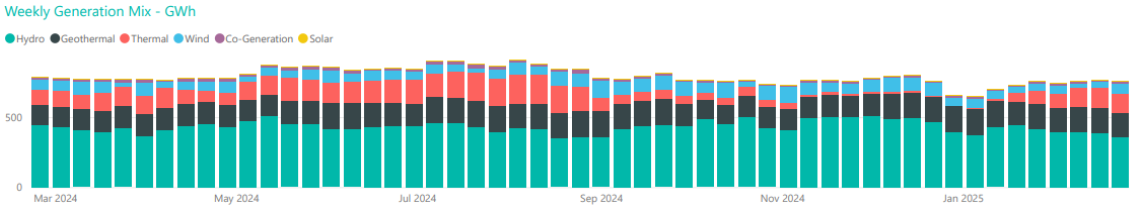
Some reasonable inflows allowed for increased hydro generation at the start of April, though this reduced throughout the month. Thermal generation increased in week 2; however, increased wind in week 3 and geothermal in weeks 3 and 4 allowed thermal to back off a little.
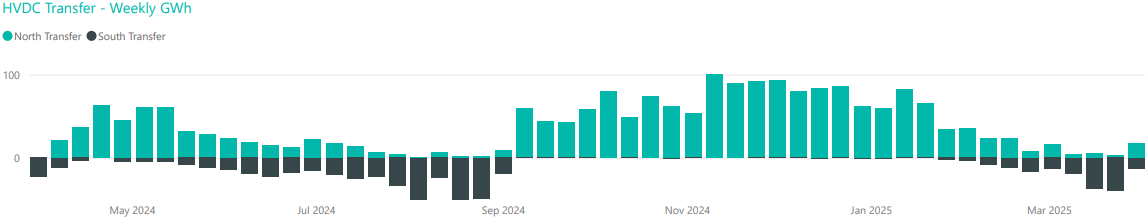
HVDC Transfer
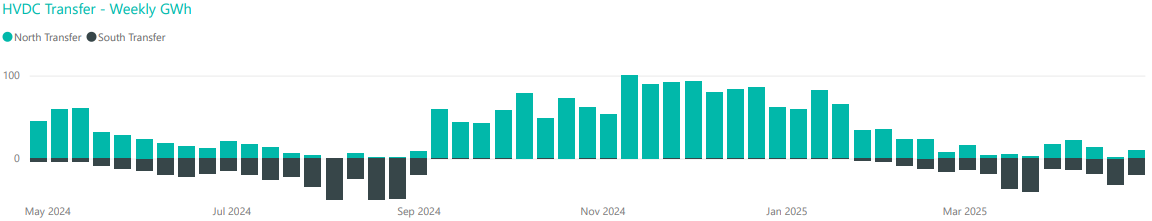
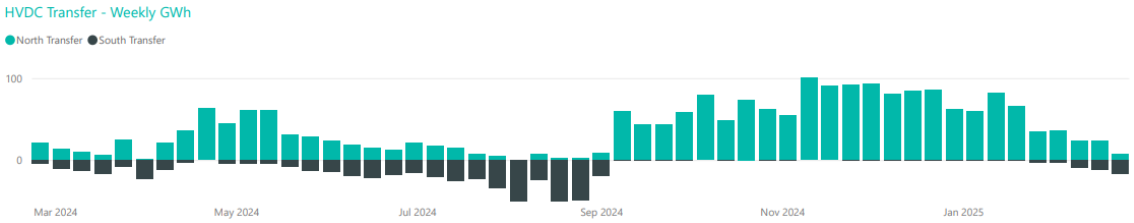
Power transfers on the HVDC link connecting the North and South Islands are important both in showing relative hydro positions and the reliance on thermal power to meet demand. High northward flow tends to indicate a good SI hydro position, whereas the reverse indicates a heavy reliance on thermal power to make up for hydro shortages.
With some increased South Island inflows early in the month, April saw some net northward transfer at the start of the month, however, that reversed later in the month, returning to net southward transfer.
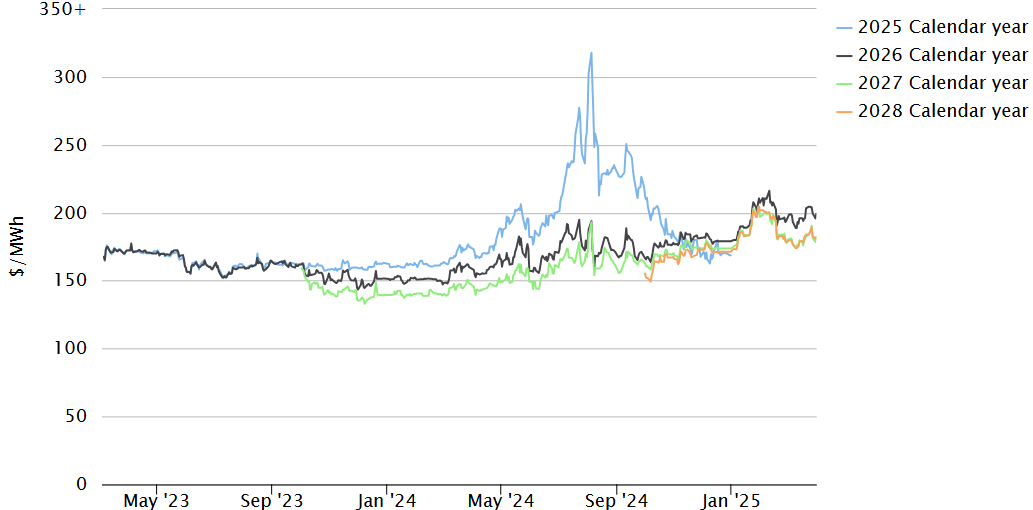
The Electricity Futures Market
The Futures Market provides an indication of where market participants see the spot market moving in the future. They are based on actual trades between participants looking to hedge their positions (as both buyers and sellers) into the future against potential spot market volatility. They are also a useful proxy for the direction of retail contracts.
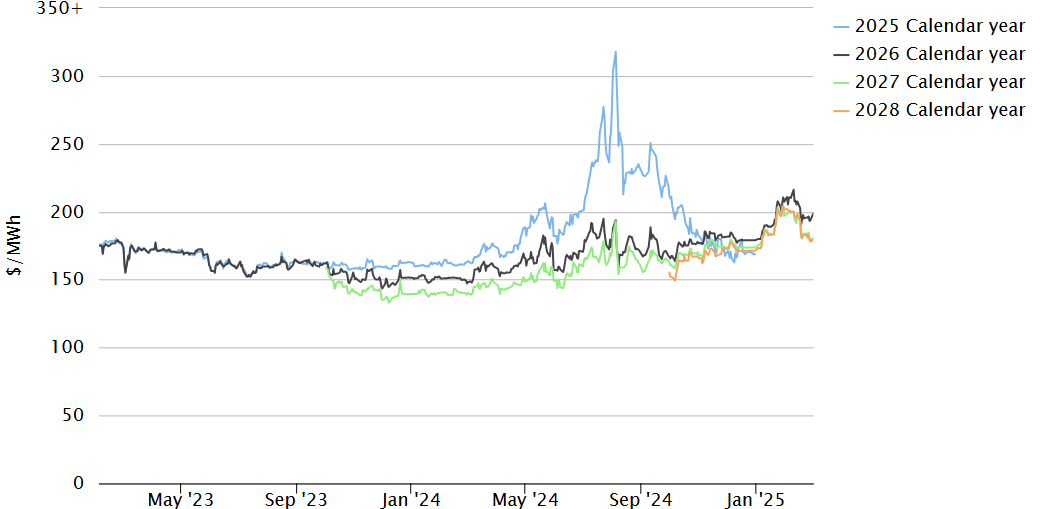
The following graph shows Futures pricing for CY 2025, 2026, 2027 and 2028 at Otahuhu (Auckland) for the last 2 years.
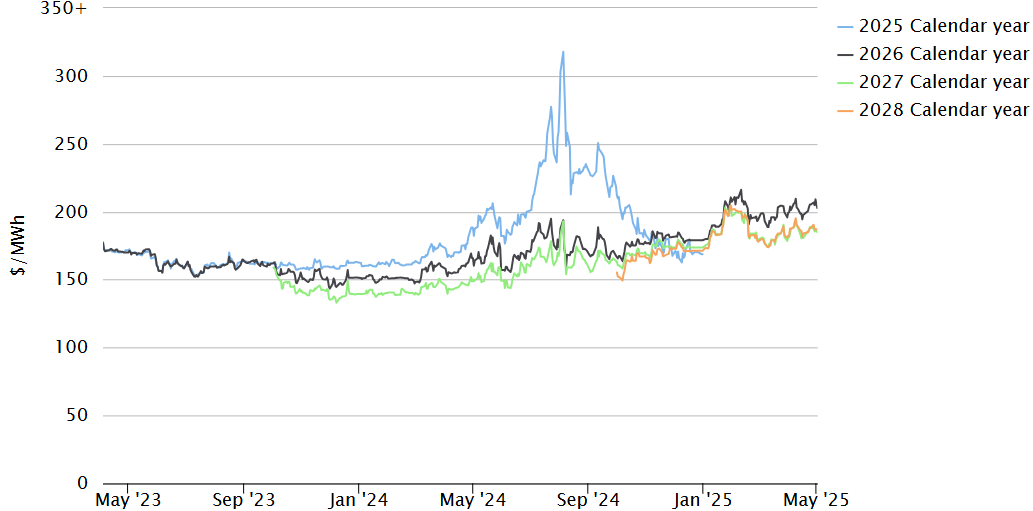
Note that $100/MWh equates to 10c/kWh.
Forward prices were up for all years through April. CAL 2026 ended the month at $209/MWh – up 7% over the month. CY 2027 price was up 4% at $186.5 while CY 2028 increased 3% at $186.
Known new generation projects are shown below (additions / removals / changes highlighted in bold).

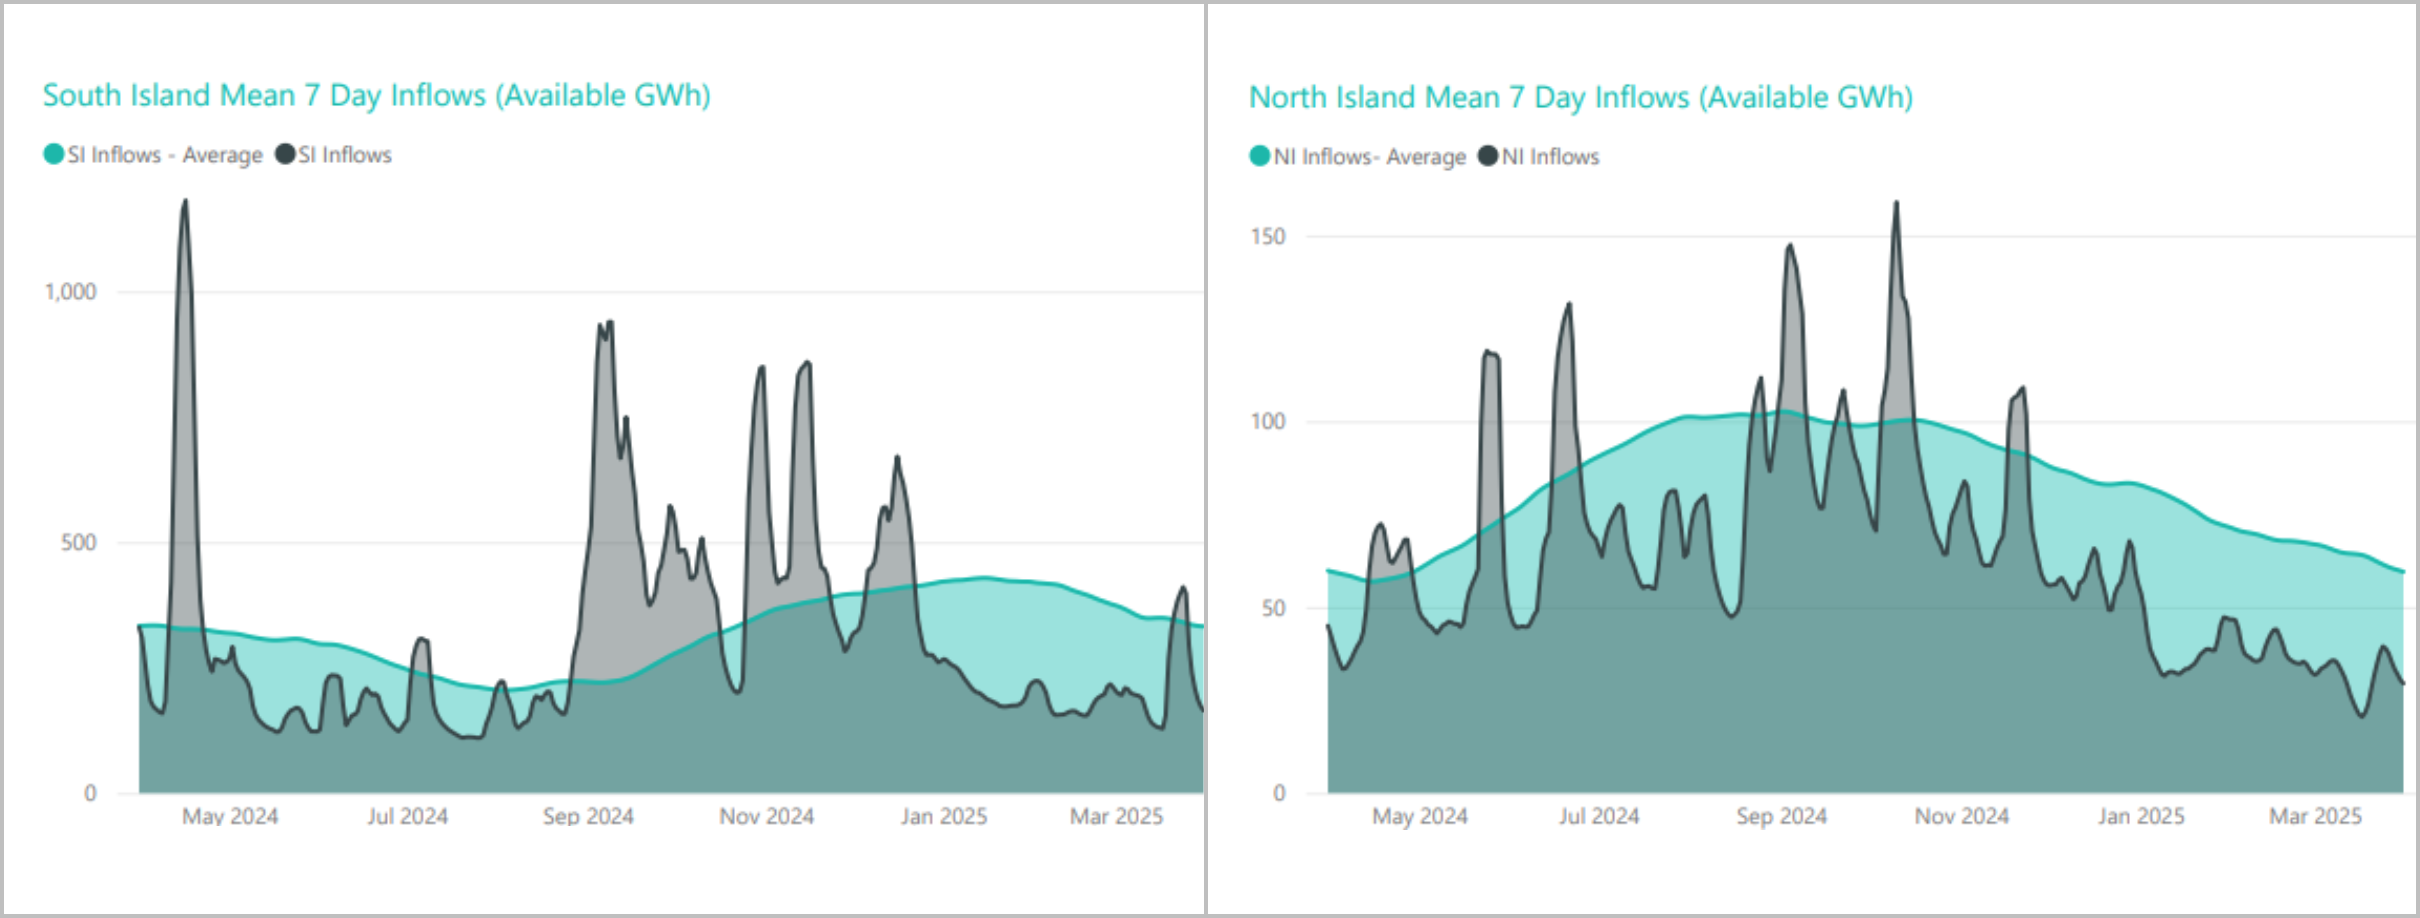
Hydro Storage
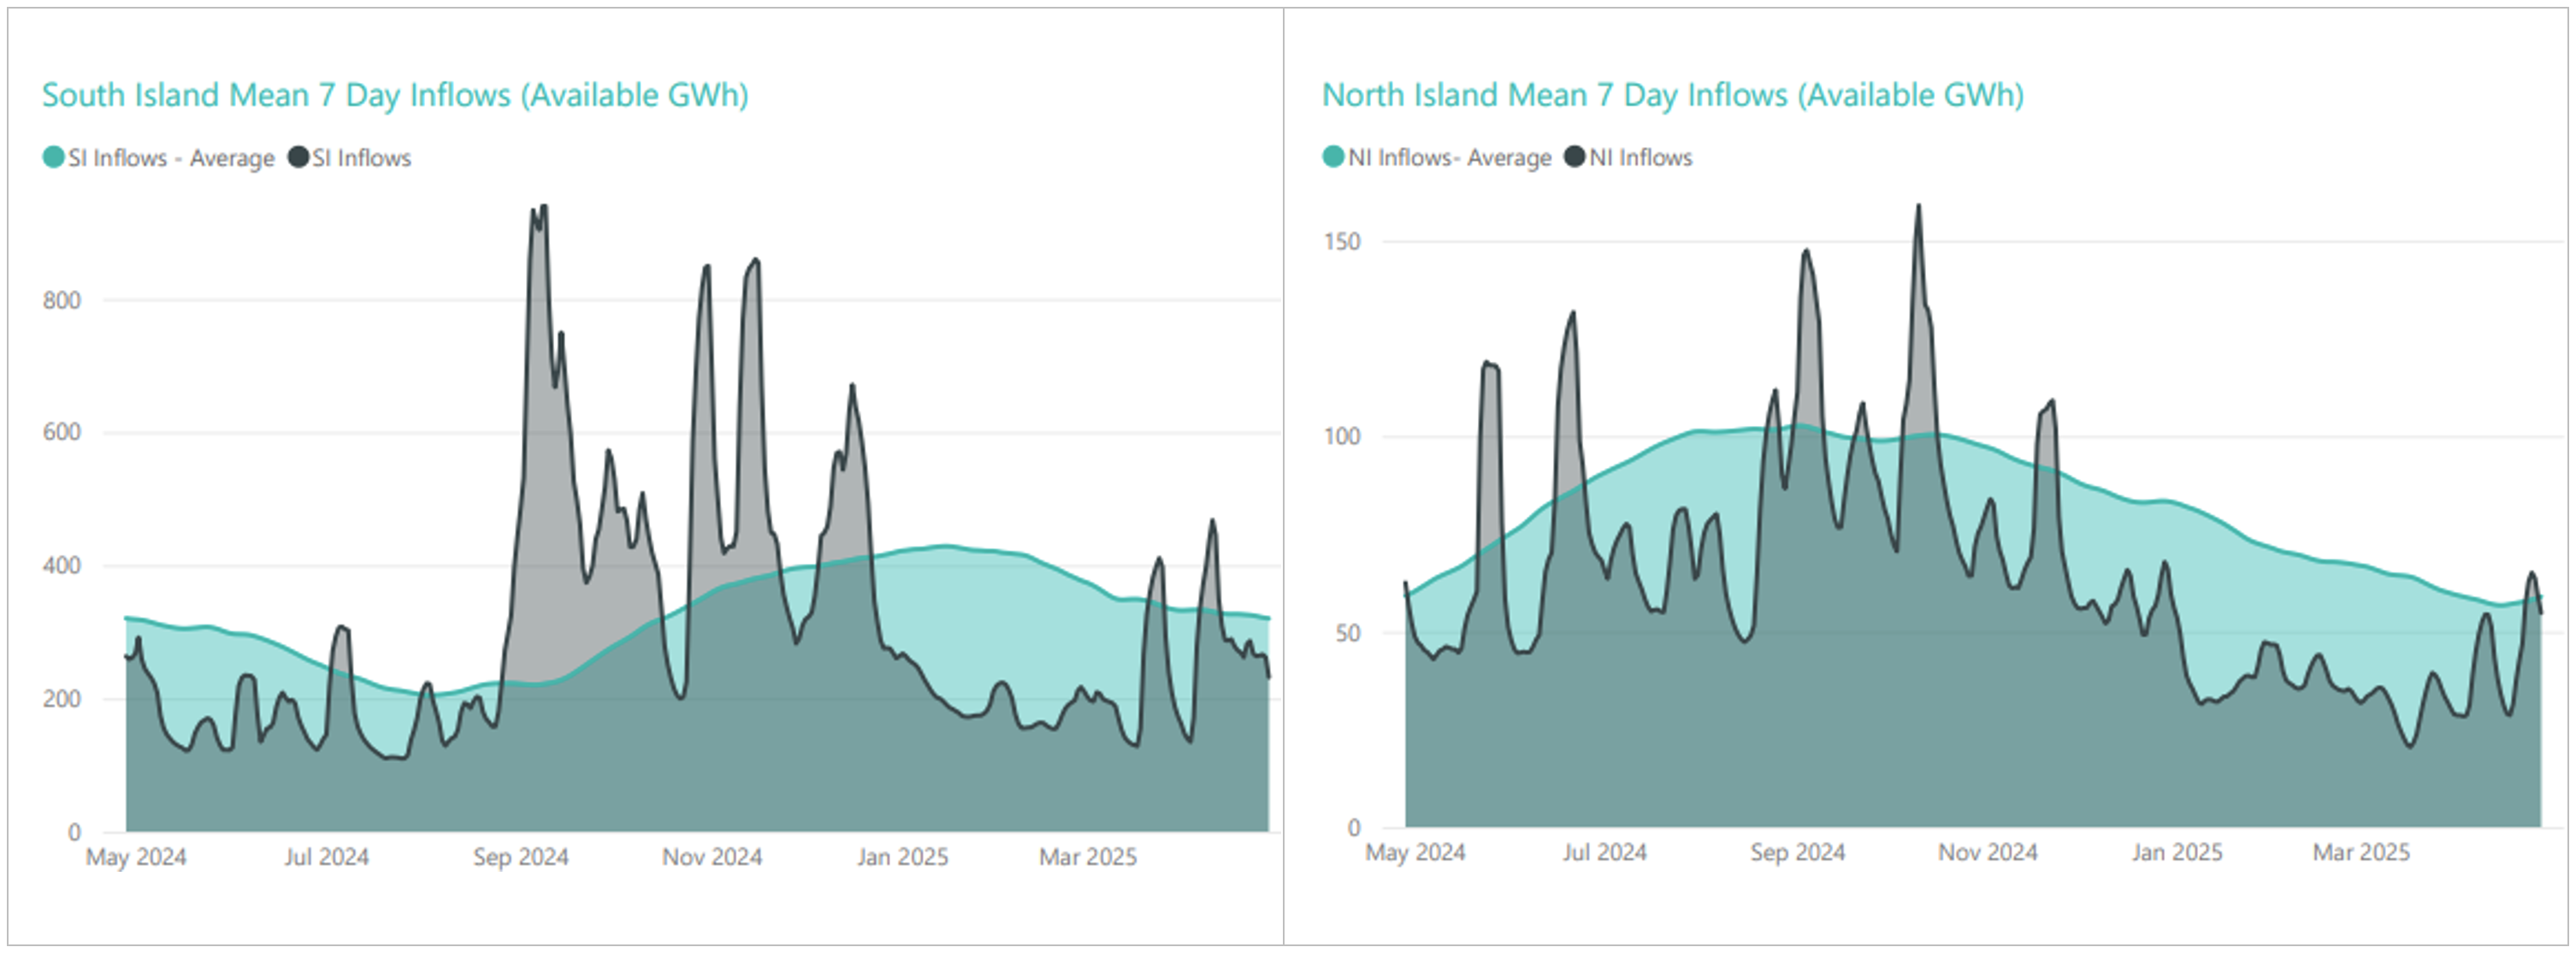
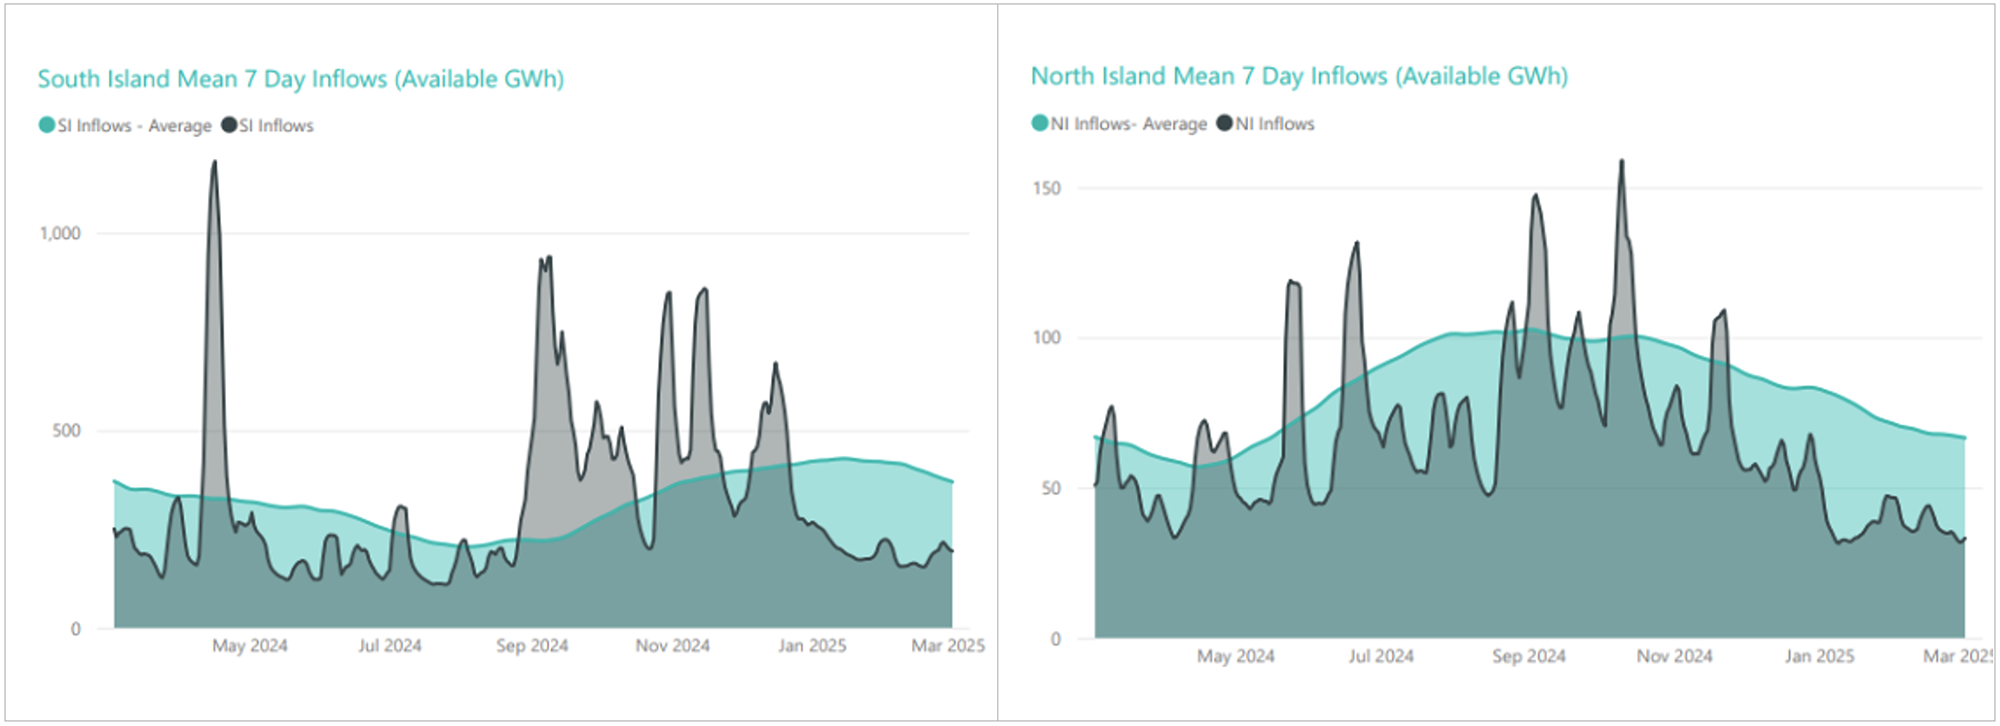
Inflows in both the North and South Islands increased in April, though the North Island remained below average. The South Island inflows were above average at the start of the month before returning to below average later in the month.
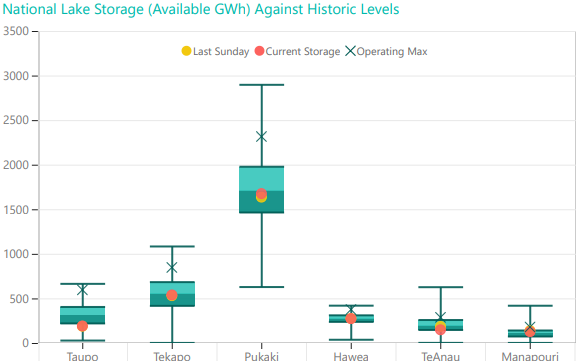
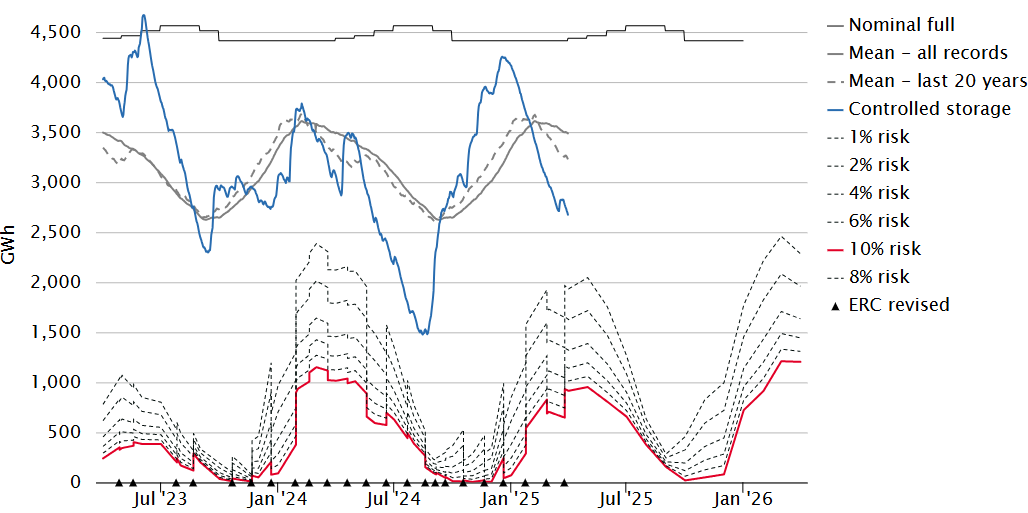
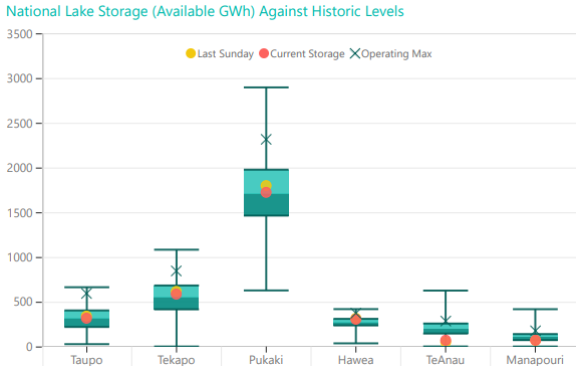
These inflows resulted in energy storage levels increasing 105GWh through the month to end at 2,780GWh (62% full). Storage remains well below the average level seen at this time of year. The following chart shows the latest breakdown of storage across the main hydro catchments.
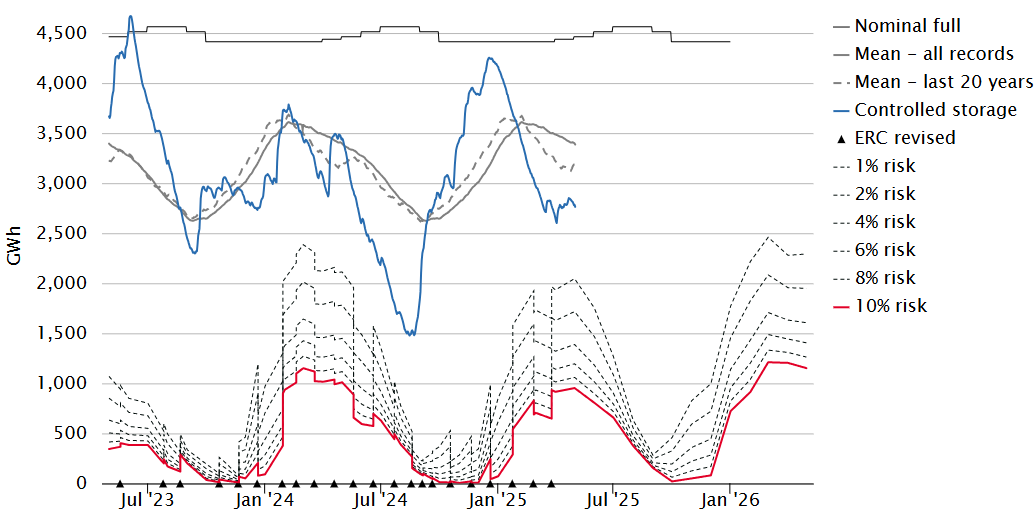
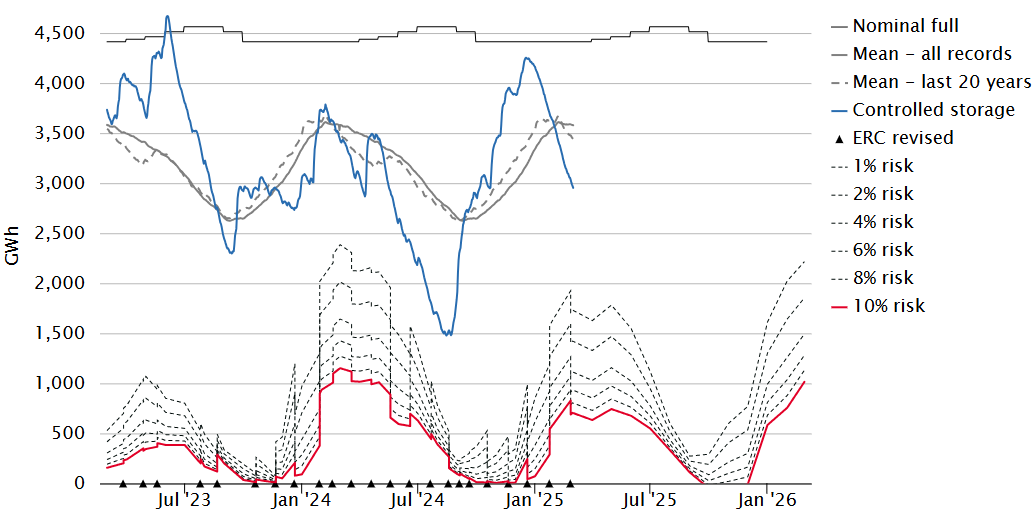
Security of supply risks decreased through April with storage levels increasing as shown below.
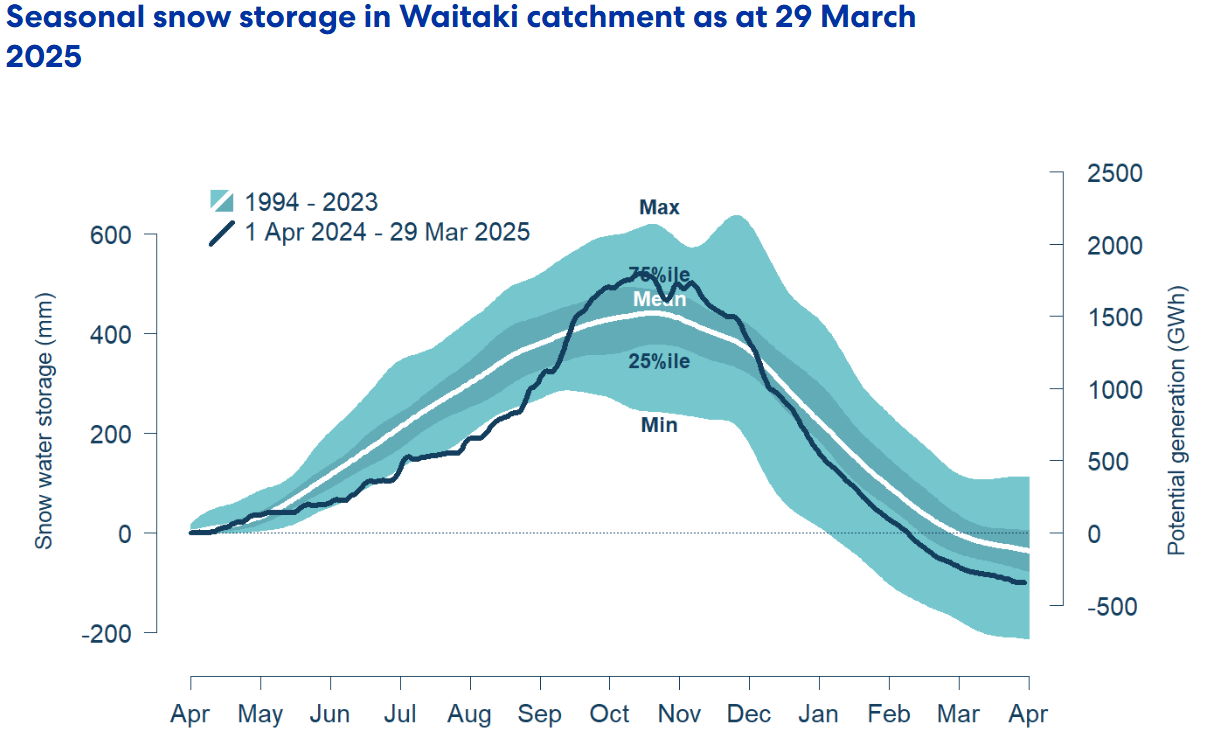
Snowpack
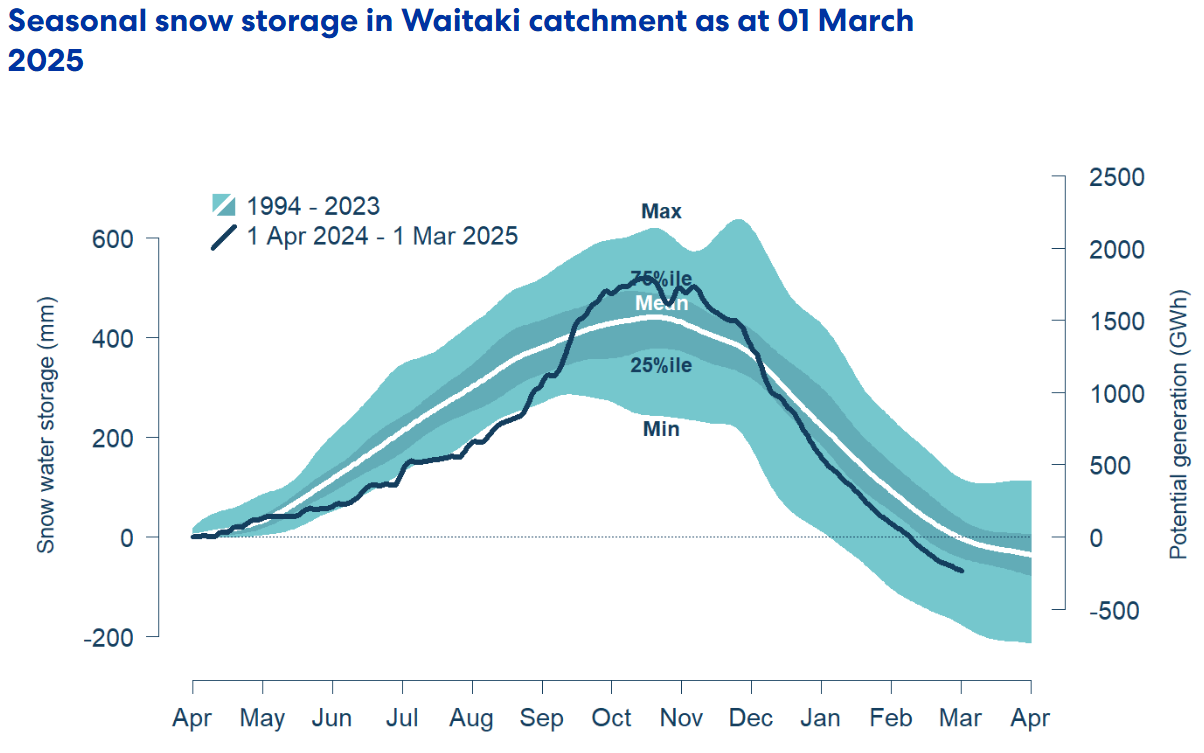
Snowpack is an important way that hydro energy is stored over the winter months and released as hydro inflows in the spring. The following graph shows that the snowpack in the important Waitaki catchment stayed at minimal levels through April, and it is currently (on the 26th April) near the minimum levels seen in the last 30 years for this time of year.

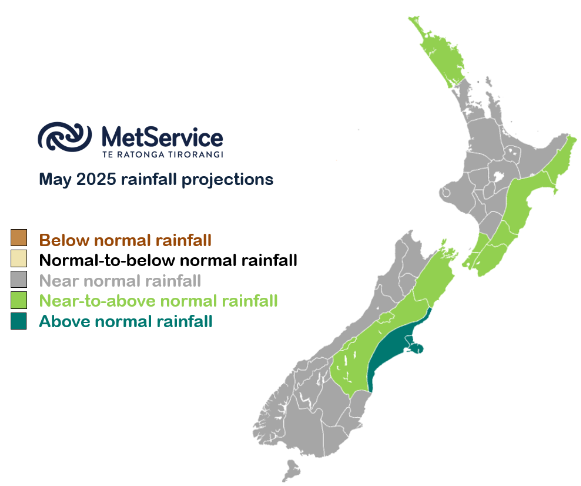
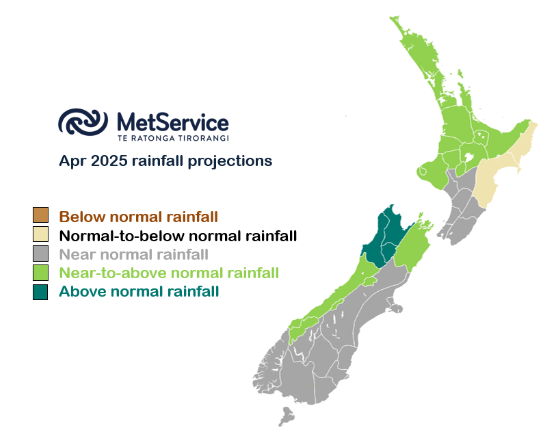
Climate Outlook Overview (from the MetService)
Climate Drivers — The El Niño-Southern Oscillation (ENSO) index is now firmly at neutral levels as sea surface temperatures around the eastern Equatorial Pacific return to normal. However, atmospheric conditions in these regions still exhibit La Niña-like traits (e.g. more northerly lows), though this is forecast to gradually ease away as we head into winter.
Both the Tasman Sea Index (TSI) and Southern Annular Mode (SAM) are currently in negative territory given the ongoing low-pressure system, but these are both forecast to trend much more positive (settled) from this weekend and persist through mid-month. The risk for tropical development also eases by mid-May.
Sea Surface Temperatures (SST) are much warmer than average, particularly surrounding the South Island, which may add fuel to the ongoing rain event.
May 2025 Outlook — An intense low-pressure system affects the country this week, delivering large amounts of rainfall to eastern regions with Christchurch and parts of Canterbury in the firing line, and the strongest southerly wind burst across the lower North Island since the June 2013 storm. With winter soon on its way, a rush of heavy snow is also expected for the Canterbury High Country, with snow already settling at higher stations. A State of Emergency has already been declared for the Selwyn District, and more rain is on the way before easing this evening. Expect gradually improving conditions through this weekend as the low moves away.
Next week sees high pressure build across the country with warming afternoons but chilly mornings, with largely dry weather. Fiordland may still cop the occasional passing Southern Ocean cold front with above normal rainfall, but any feature should significantly weaken as it spreads northwards. However, there are signals for another northerly low late in the week, so keep an eye to the sky for any further development.
High pressure moves east and weakens around mid-month, allowing for the return of a more seasonal progression of quick-moving fronts across the country. The North Island should trend near average or slightly drier-than-average, but conditions further south are looking close to normal with a passing front or two.
The last two weeks of autumn see more seasonable conditions (e.g. near-average rainfall) across most of the motu, but a strengthening westerly flow across the Southern Ocean hints at higher rainfall across Westland and Fiordland, while the odd northerly low will remain possible. With winter right around the corner, it will become increasingly important to be mindful that any southerly change accompanying a frontal passage would bring a short but sharp cold snap with potential for snow.
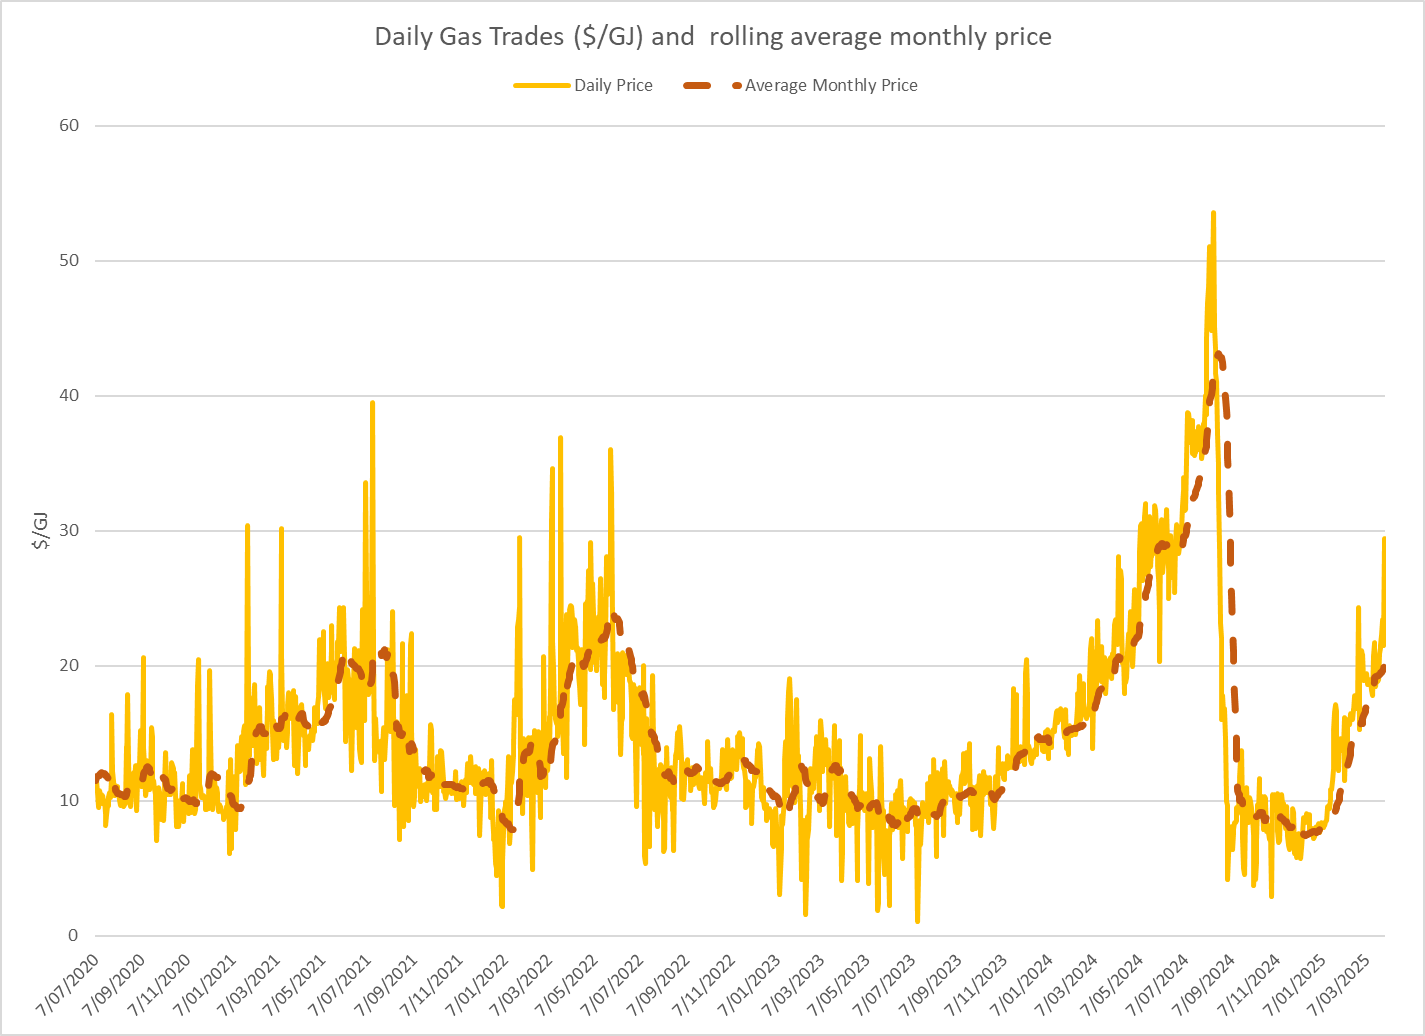
The Wholesale Gas Market
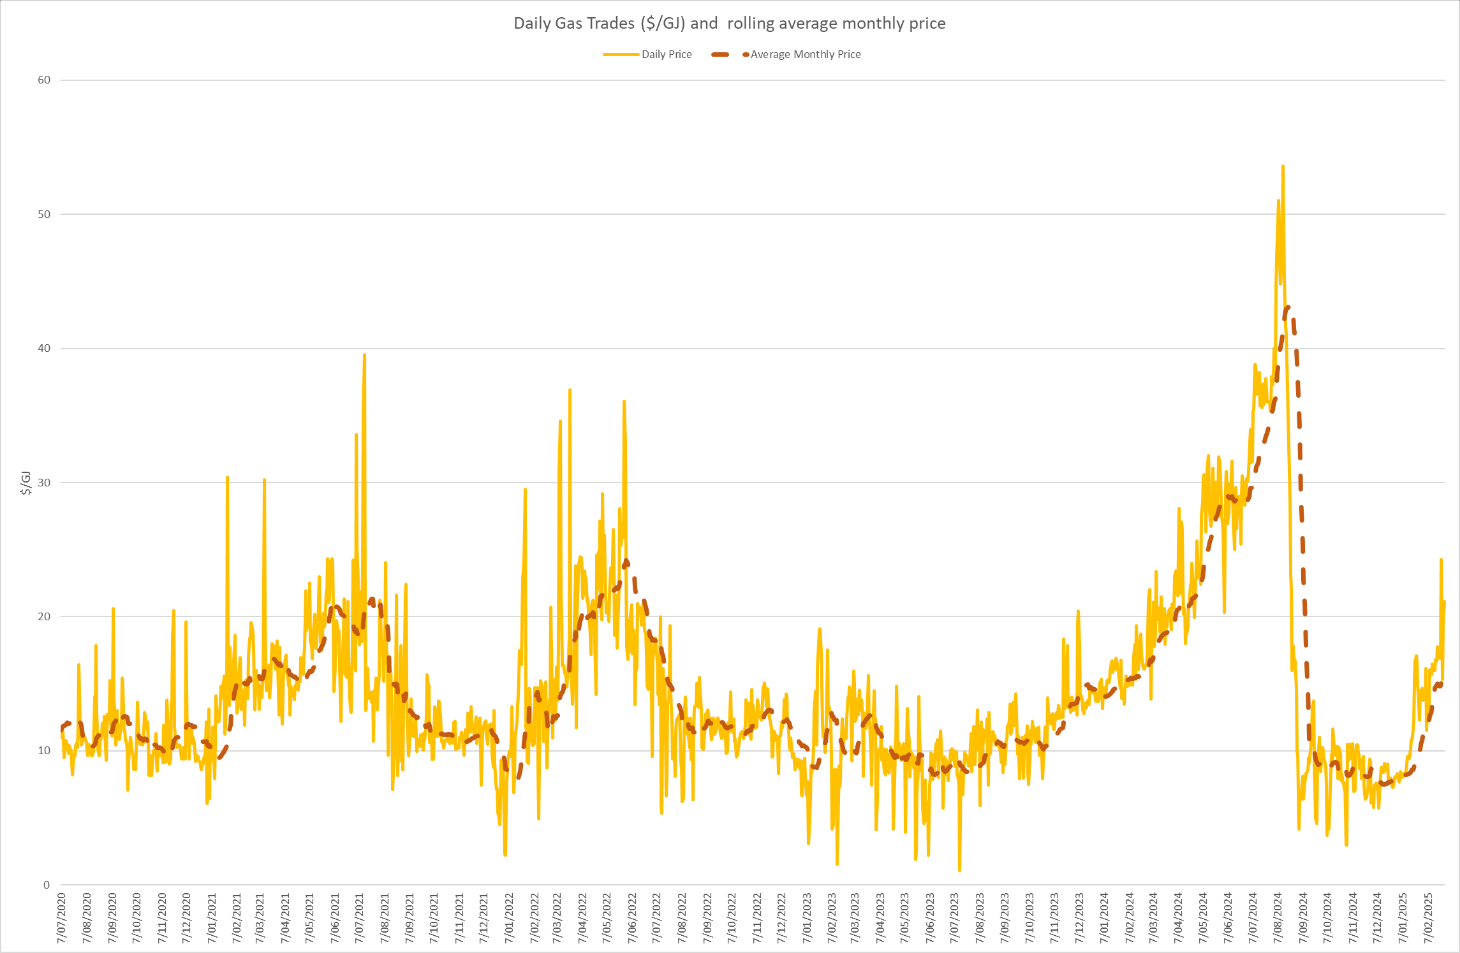
Spot gas prices in April remained close to the very high levels seen last month. Prices for the month averaged $20.6/GJ – a 2% increase compared to March. Average prices were 5% below what they were at the same time last year.

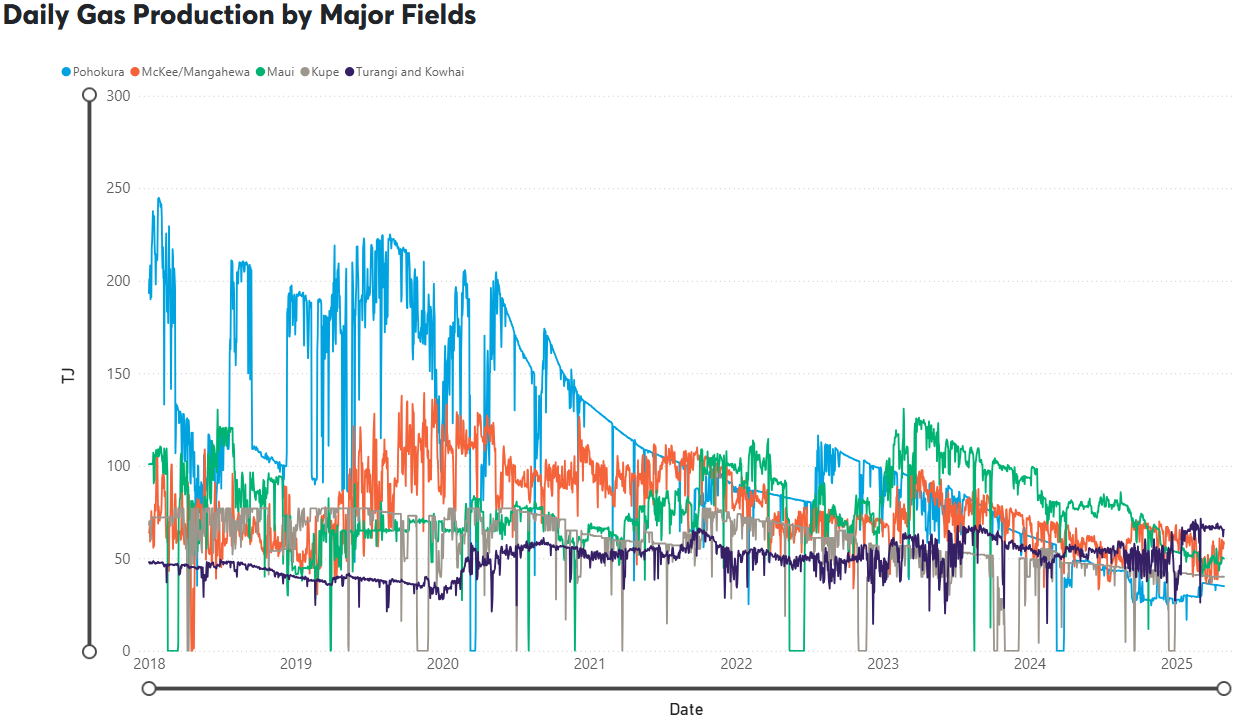
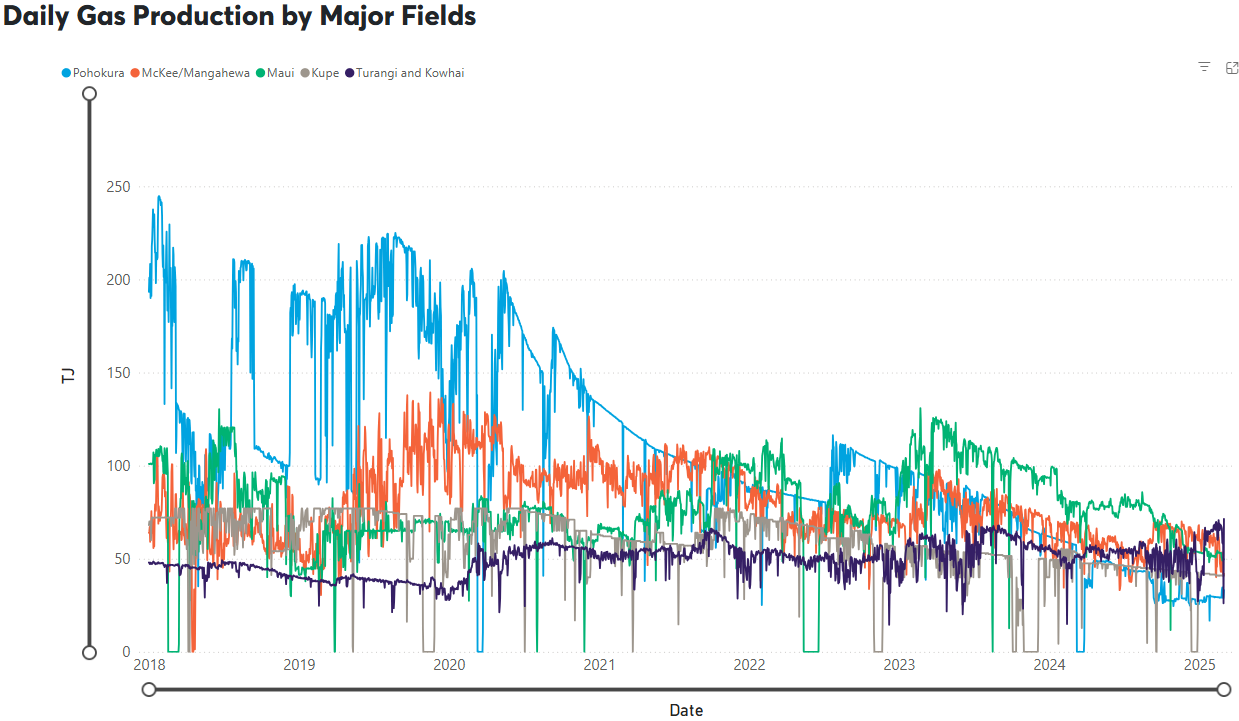
On the supply side, McKee / Mangahewa was the only producer to increase output – up from 44TJ per day in March to around close to 60TJ/day by the end of April. Turangi and Kowhai maintained the higher output seen since late January, averaging 66.5TJ/day through April. Maui production reduced slightly over the month, falling to 49TJ/day. Pohokura also decreased output slightly, averaging around 35TJ/day. Kupe also reduced slightly to 40TJ/day.
The following graph shows production levels from major fields over the last seven years.
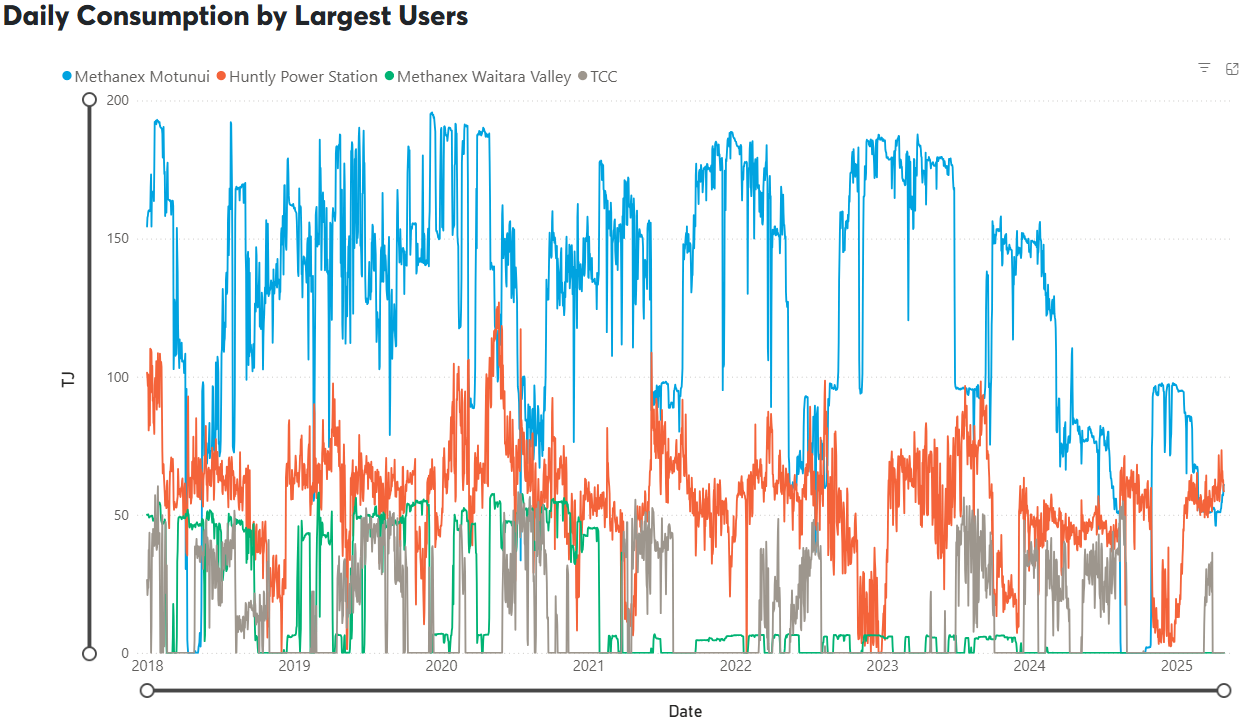
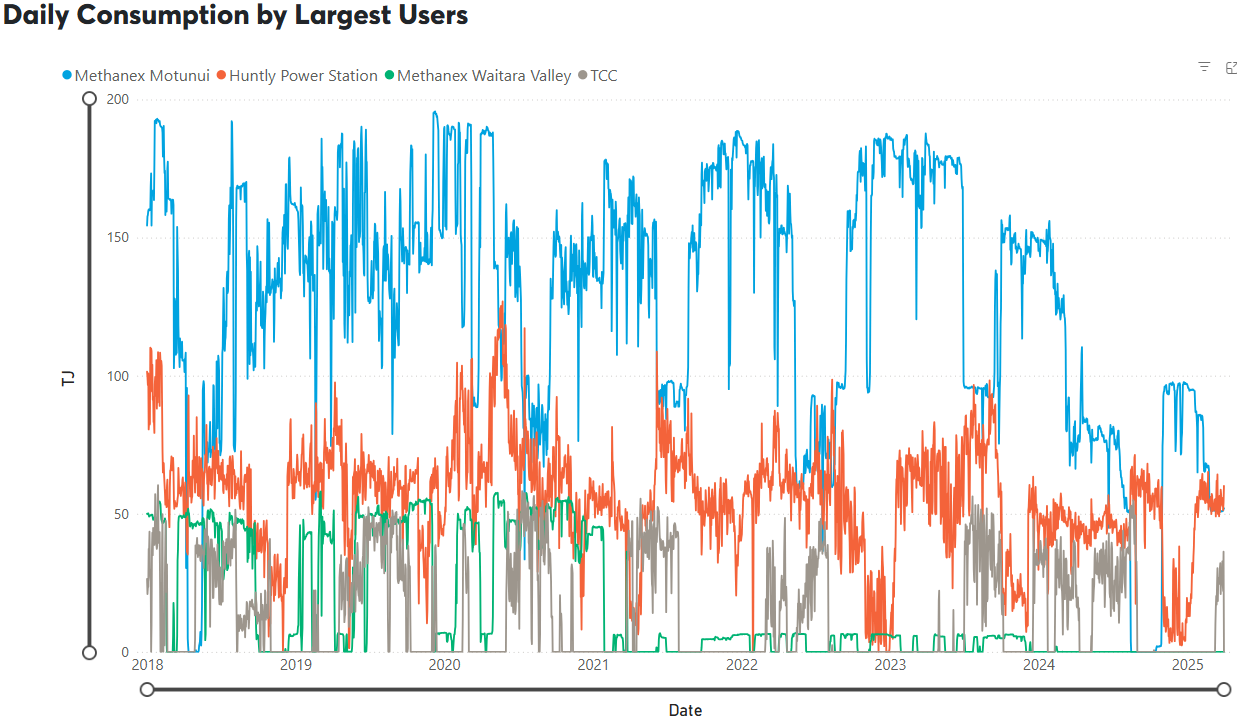
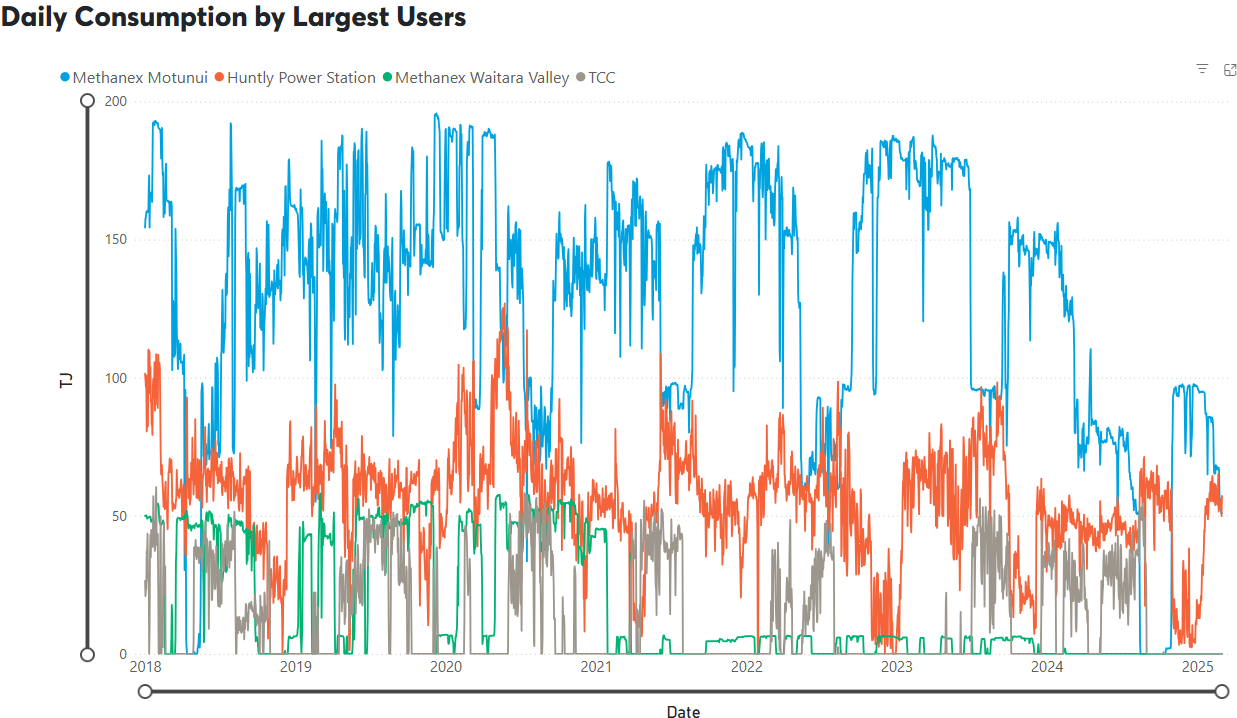
Methanex gas usage maintained the reduced level seen in March, averaging close to 50TJ/day before increasing to around 60TJ per day in the last week of April. Huntly usage increased in April, averaging over 60TJ/day. After running for most of March, TCC shut down and did not operate at all in April.
The following graph shows trends in the major gas users over the last seven years.
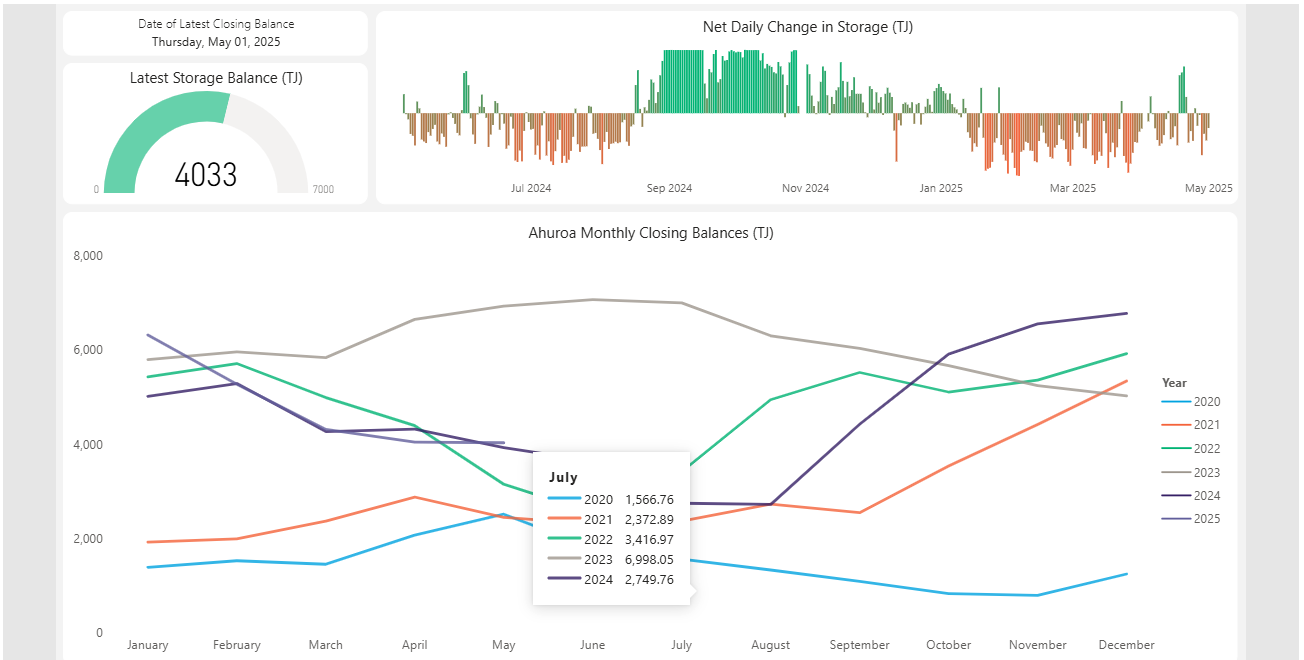
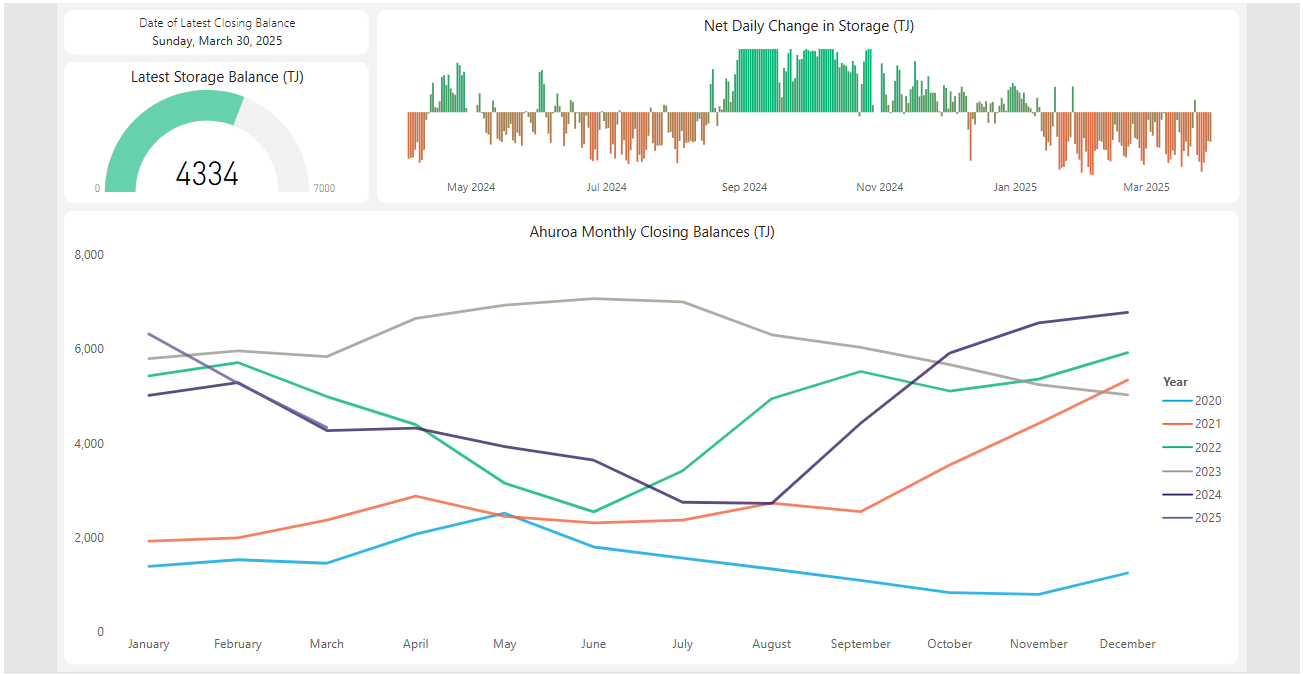
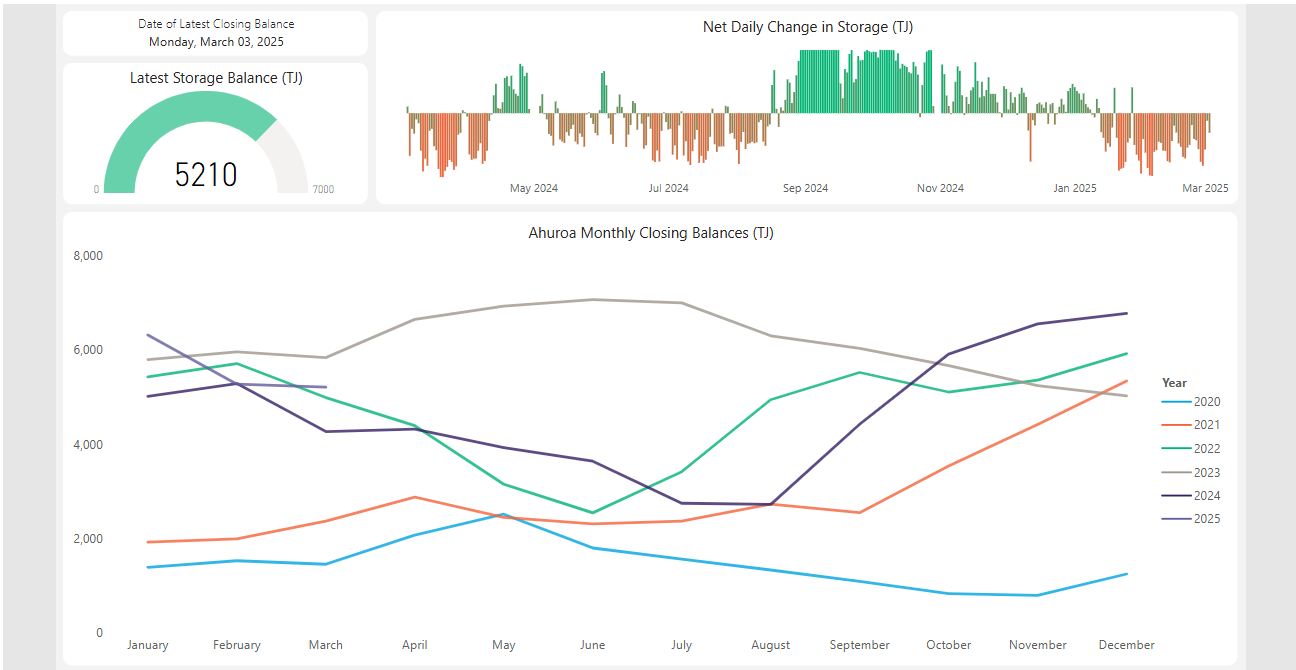
Gas storage is becoming increasingly important as falling production coincides with more variable demand, particularly from gas-fired electricity generation. The following chart shows how storage at Ahuroa maintained its level through April. It remains above average levels seen at this time of year over the last few years.
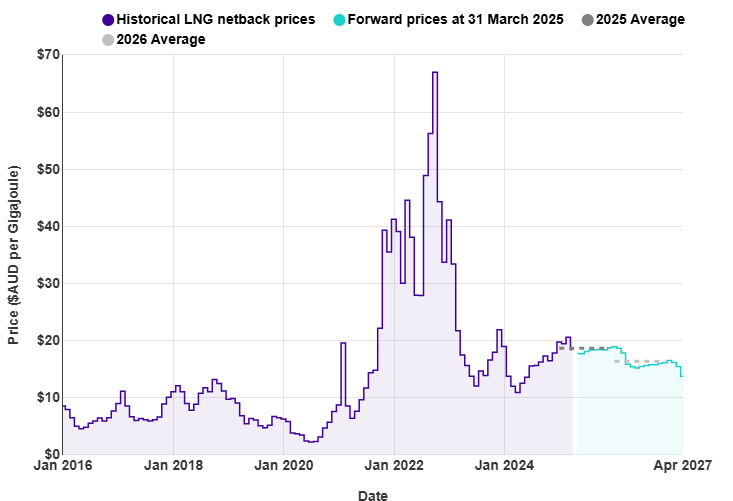
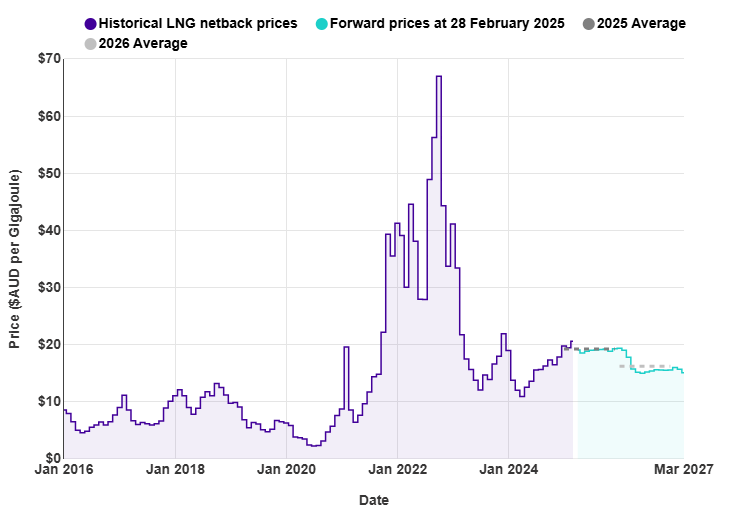
Internationally, LNG netback prices ended the month at $16.88/GJ – down 8.5% from last month. Forecast prices for 2025 were down 10% at $16.76/GJ. Forward prices for 2026 were also down 10% at $14.71/GJ. (Note that netback prices are indicative of international prices – they are produced by the ACCC and quoted in Australian dollars. They are net of the estimated costs to convert from pipeline gas in Australia to LNG, hence the term “netback”)
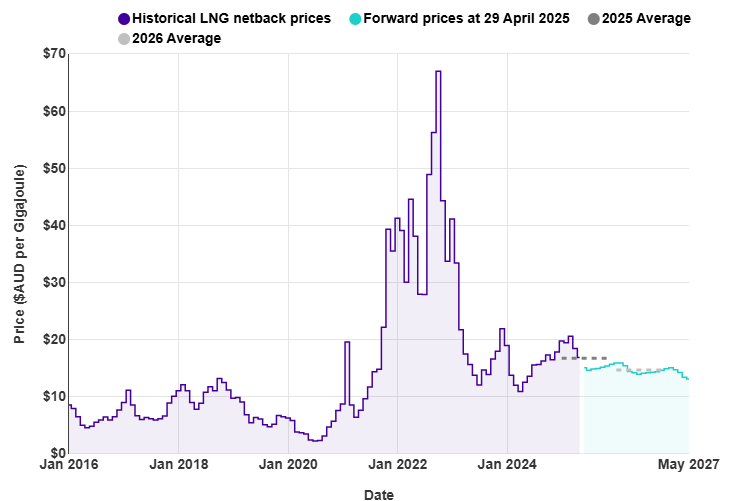
New Zealand does not (yet) have an LNG export/import market, so our domestic prices are not directly linked to global prices. With recent gas supply issues, the Government is now talking about the possibility of facilitating the building of an LNG import facility.
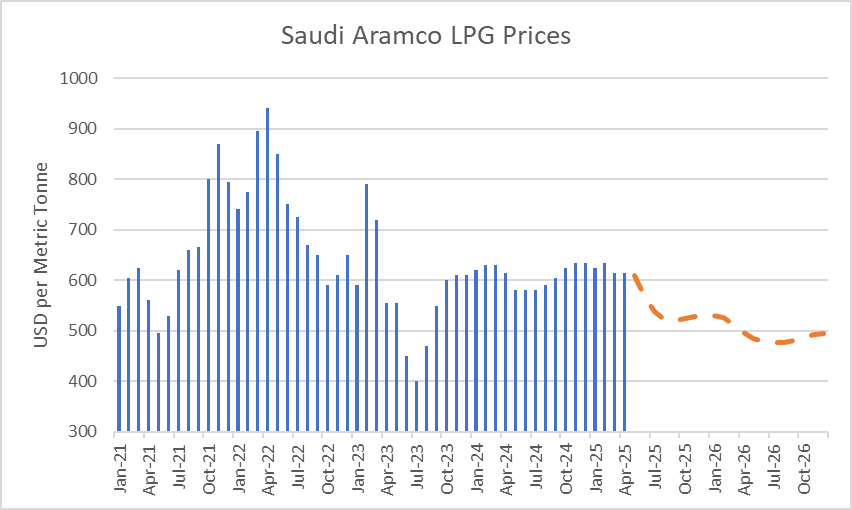
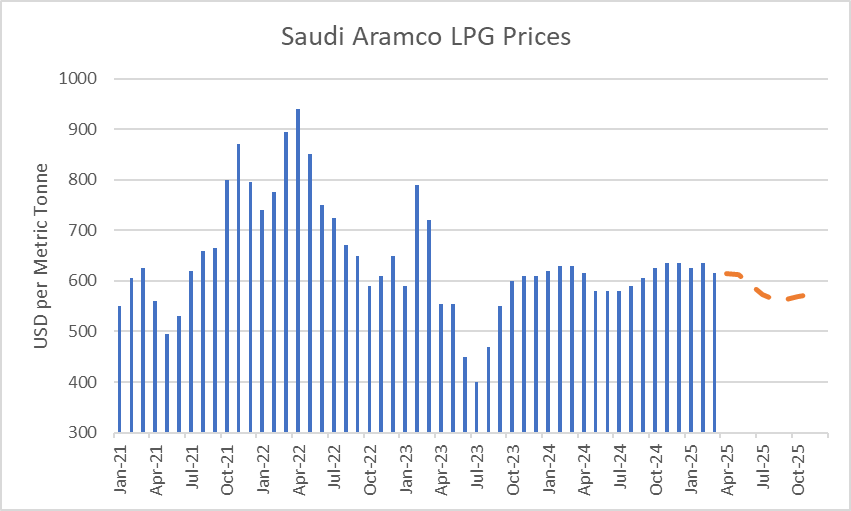
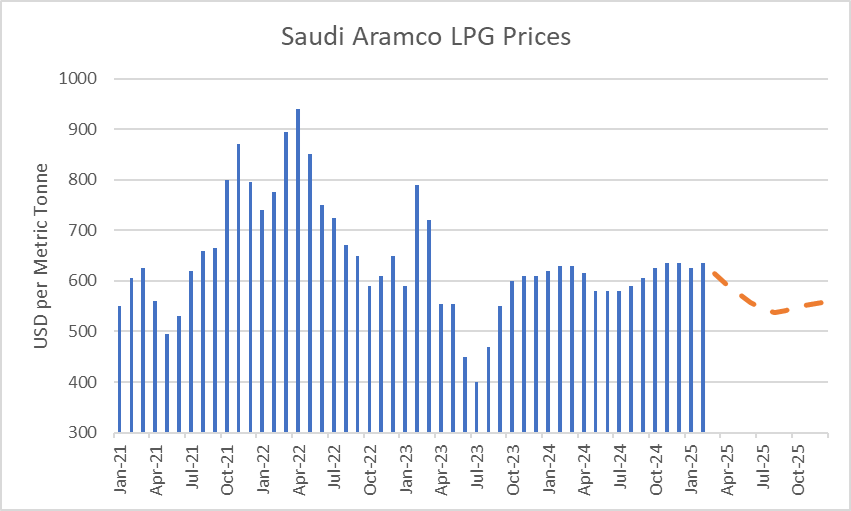
LPG is an important fuel for many large energy users, particularly in areas where reticulated natural gas is not available. The contract price of LPG is typically set by international benchmarks such as the Saudi Aramco LPG – normally quoted in US$ per metric tonne.
The following graph shows the Saudi Aramco LPG pricing for the last 4 years as well as forecast pricing for the year ahead. Futures pricing were down over the last month and are trending down through 2026.
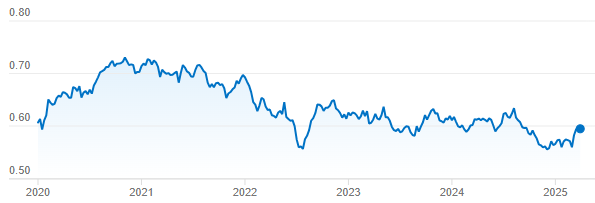
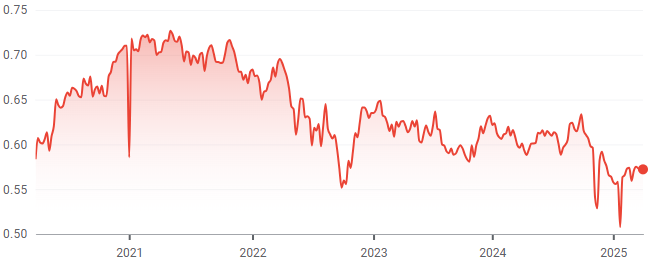
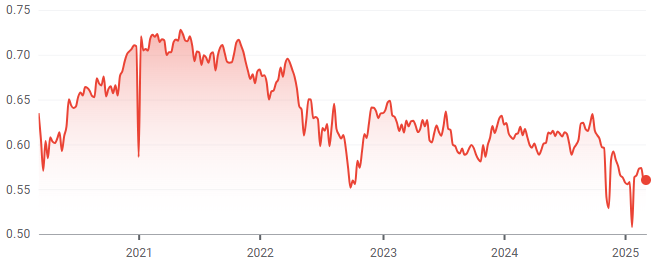
The other main contributing factor to LPG prices in New Zealand is the exchange rate against the USD. The exchange rate was volatile during April, dropping as low as 0.55 but closing near its monthly high of 0.59. This remains near the lowest levels seen in recent years. This would tend to push up LPG prices when quoted in NZD.
The Coal Market
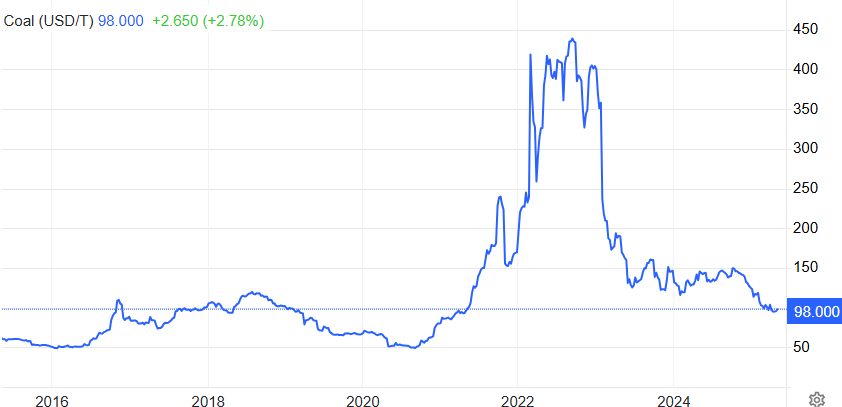
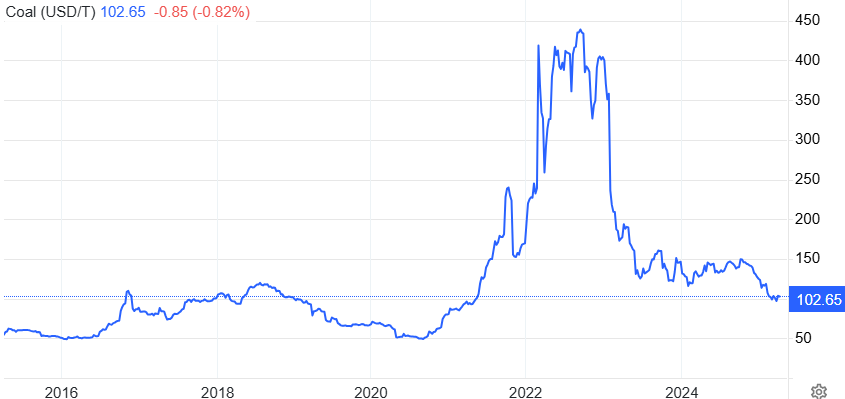
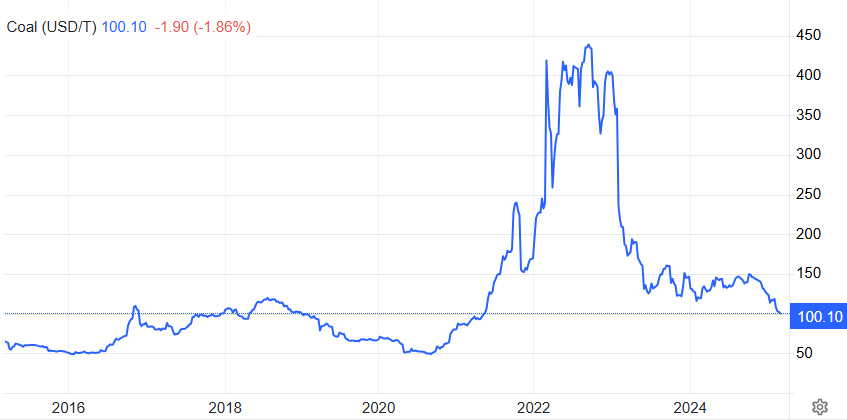
The global energy crisis has been as much about coal as it has gas. The war in the Ukraine has driven energy prices, including coal, up. Prices in April fell to a low of US$93/T before picking up to end the month at US$98/T – a 2% fall over the month. These prices are finally returning to levels close to what we expect to see, as shown in the following graph of prices over the last 10 years.
Like gas, the price of coal can flow through and have an impact on the electricity market. In March, Genesis reported that it expects to import about 630,000 tonnes of coal between now and September. The company says it currently holds about 515,000 tonnes at Huntly and has plans in place to make a third dual-fuel Rankine unit there available this winter if gas supplies and lake storage remain tight. Genesis says that 500,000 tonnes is the equivalent of about 1,000GWh of electricity storage or 22% of maximum hydro storage in NZ.
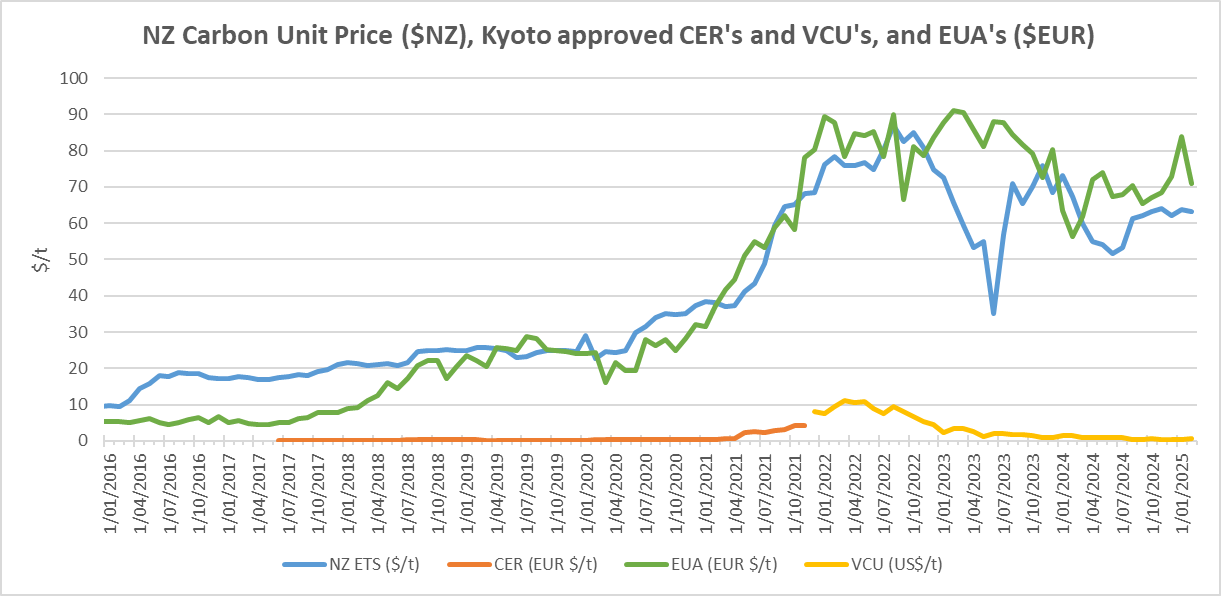
Carbon Pricing
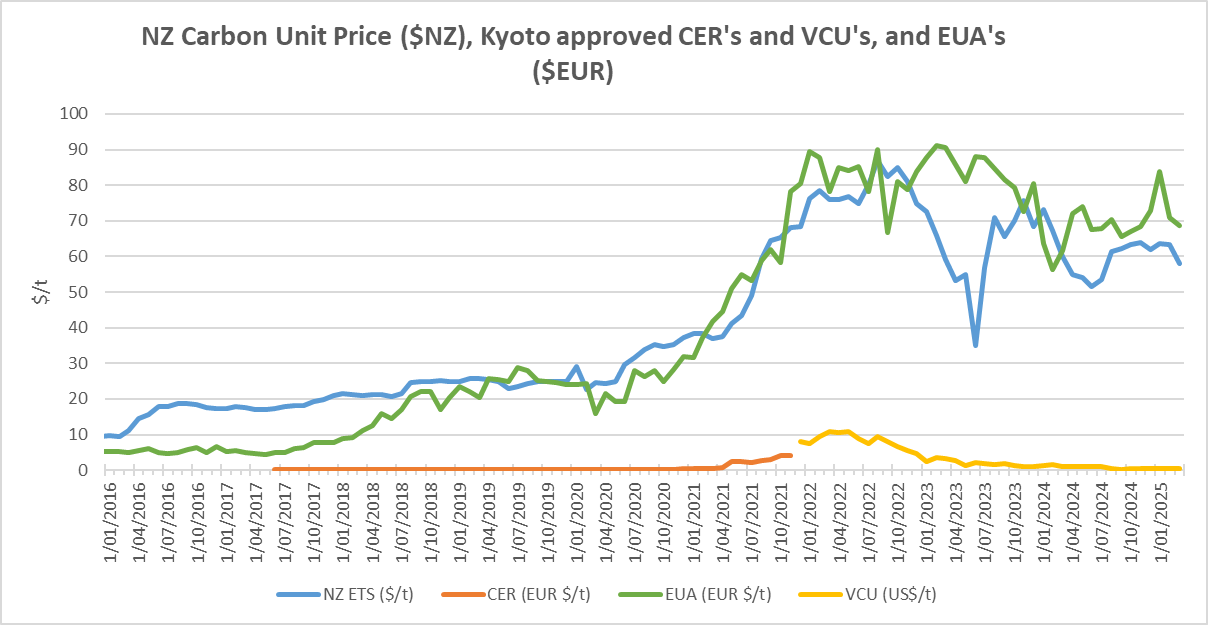
NZ has had an Emissions Trading Scheme (ETS) in place since 2008. It has been subsequently reviewed by several governments and is now an “uncapped” price scheme closely linked to international schemes. However, there are “upper and lower guardrails” set up to prevent wild swings in carbon price that act as minimum and maximum prices. These increased in December 2023 to $173 and $64 respectively. Carbon prices decreased 15% in April to $49.

As the carbon price rises, the cost of coal, gas or other fossil fuels used in process heat applications will naturally also rise. Electricity prices are also affected by a rising carbon price. Electricity prices are set by the marginal producing unit – in NZ this is currently typically coal or gas or hydro generators, with the latter valuing the cost of its water against the former. An increase in carbon price can lead to an increase in electricity prices in the short to medium term (as the marginal units set the price). A carbon price of $50/t is estimated to currently add about $25/MWh (or ~2.5c/kWh) to electricity prices. In the long term the impact should reduce as money is invested in more low-cost renewables and there is less reliance on gas and coal-fired generation.
EU Carbon units decreased in April to 66 Euro/tonne – down 3%.
About this Report:
This energy market summary report provides information on wholesale price trends within the NZ Electricity Market. Please note that all electricity prices are presented as a $ per MWh price and all carbon prices as a $ per unit price. All spot prices are published by the Electricity Authority. Futures contract prices are sourced from ASX.
Further information can be found at the locations noted below.
- Transpower publishes a range of detailed information, which can be found here: https://www.transpower.co.nz/power-system-live-data
- The Electricity Authority publishes a range of detailed information, which can be found here: https://www.emi.ea.govt.nz/
- Weather and Climate data – The MetService publishes a range of weather-related information, which can be found here: https://www.metservice.com/
Disclaimer: This document has been prepared for informational and explanatory purposes only and is not intended to be relied upon by any person. This document does not form part of any existing or future contract or agreement between us. We make no representation, assurance, or guarantee as to the accuracy of the information provided. To the maximum extent permitted by law, none of Smart Power Ltd, its related companies, directors, employees or agents accepts any liability for any loss arising from the use of this document or its contents or otherwise arising out of or in connection with it. You must not provide this document or any information contained in it to any third party without our prior consent.
About Smart Power:
Smart Power is a full-service Energy Management consultancy. Apart from Energy Procurement, Smart Power can also provide:
- Technical advice on how to reduce your energy use & emissions
- Sustainability Reporting
- Invoice Management Services
We also offer boutique energy and water billing services for landlords/property developers.
Contact us here or call one of our offices to talk to our experienced staff about how we can assist you with achieving your energy goals.
© Copyright, 2025. Smart Power Ltd
Market Update March 2025
The Wholesale Electricity Market
Spot prices in the wholesale electricity market for March continued to climb from February’s already very high levels. Average spot prices for the month ranged from $272 in the central North Island up to $320 in the upper South Island.
The following chart shows average weekly spot prices over the last 2 years. The large increase over the last few months can be clearly seen.
Electricity Demand
Electricity demand in March was close to average compared to what we have seen in recent years as shown below.
Electricity Generation Mix
Through most of March as hydro inflows remained low and hydro storage continued to fall, dropped off, there was a continued decline in hydro generation and a corresponding increase in thermal generation. The last week of March saw some increased inflows resulting in a small uptick in hydro generation.
HVDC Transfer
Power transfers on the HVDC link connecting the North and South Islands are important both in showing relative hydro positions and the reliance on thermal power to meet demand. High northward flow tends to indicate a good SI hydro position, whereas the reverse indicates a heavy reliance on thermal power to make up for hydro shortages.
With declining South Island hydro storage levels, March saw increasing net southward transfer until the last week in the month when some higher SI inflows allowed some greater northward transfer.
The Electricity Futures Market
The Futures Market provides an indication of where market participants see the spot market moving in the future. They are based on actual trades between participants looking to hedge their positions (as both buyers and sellers) into the future against potential spot market volatility. They are also a useful proxy for the direction of retail contracts.
The following graph shows Futures pricing for CY 2025, 2026, 2027 and 2028 at Otahuhu (Auckland) for the last 2 years.
Note that $100/MWh equates to 10c/kWh.
Forward prices had small increases or were flat for all years through March. CAL 2026 ended the month at $196/MWh – up 1% over the month. CY 2027 price was unchanged at $179 while CY 2028 was up 1.5% at $181.
Known new generation projects are shown below (additions / removals / changes highlighted in bold).

Hydro Storage
Inflows in both the North and South Islands remained well below average for most of March, though there was an uptick in SI inflows towards the end of the month.
These low inflows resulted in energy storage levels falling 313GWh through the month to end at 2,675GWh (60% full). Storage remains well below the average level seen at this time of year. The following chart shows the latest breakdown of storage across the main hydro catchments.

Security of supply risks increased through March with storage levels decreasing as shown below.
Snowpack
Snowpack is an important way that hydro energy is stored over the winter months and released as hydro inflows in the spring. The following graph shows that the snowpack in the important Waitaki catchment decreased through March, and it is currently below the 25th percentile levels seen in the last 30 years for this time of year.
Climate Outlook Overview (from the MetService)
Climate Drivers — The El Niño-Southern Oscillation (ENSO) index is now firmly at neutral levels as sea surface temperatures around the eastern Equatorial Pacific continue to warm. However, atmospheric conditions in these regions still exhibit La Niña-like traits, which may persist through much of autumn due to the typical lag in ocean-atmosphere responses.
After a prolonged settled spell in March, both the Tasman Sea and Southern Ocean should see one or two unsettled bursts. The Tasman Sea Index (TSI) is trending negative (unsettled) with a low-pressure system quickly deepening to the west of New Zealand this working week. This will be followed by a burst of negative Southern Annular Mode (SAM) next week, bringing the potential for a few more cold fronts to sweep across the South Island. While both of these are expected to turn more positive again for most of the month, there are some indications of a subtropical system near mid-month to the north of the country. How this could play out remains uncertain at this stage.
An active Madden-Julian Oscillation (MJO) pulse is currently moving eastward across the western Pacific. Once it moves away, the MJO is not expected to play a major role for much of the remainder of the month.
April 2025 Outlook — As we head deeper into autumn, the weather follows suit with a shift to more unsettled conditions. A potent Tasman Sea low brings a warm and humid northerly flow with heavy rainfall to western and northern regions this week; areas that have seen little meaningful rainfall lately. The significance of this rainfall will depend on smaller-scale frontal features, but the heaviest totals and intensities may cause some issues with very dry soils, particularly for the upper South Island where the bulk of the rain should be focussed. However, for most places this is likely a very welcome return of rainfall after a dry 2025 so far.
Next week sees windy westerlies return across the South Island with brief influxes of rain in the south and west, and smaller amounts elsewhere. High pressure shifts closer to the North Island, with any systems weakening as they move northwards. Temperatures should decrease closer towards the April average, bringing some relief from the warm overnight temperatures in the North Island, although frosty mornings may become more common in the south.
While high pressure is likely to dominate again in the following days, there are hints of a subtropical northerly low nearing mid-month. While the exact track of this system (and whether it will bring another surge of meaningful rain) remain uncertain, the northern regions are most at-risk.
Late April is showing signs of unsettled weather for most places and increased chances of rainfall. Which areas have the best chance of rainfall will depend on the direction of the incoming system, but the month is looking to end much like it began, with a roar.
The Wholesale Gas Market
Spot gas prices in March continued to climb. Prices for the month averaged $20.2/GJ – a 27% increase compared to February. Average prices were 4% above what they were at the same time last year.
On the supply side Turangi and Kowhai maintained the higher output seen since late January, averaging 65.5TJ/day through March. Maui production reduced slightly over the month, falling below 50TJ/day. Pohokura increased output, averaging around 36TJ/day. Kupe held its output at around 41TJ/day. McKee / Mangahewa also maintained output through the month, averaging 44TJ per day.
The following graph shows production levels from major fields over the last seven years.

Methanex gas usage maintained the reduced level seen at the end of last month, averaging close to 50TJ/day in March. Huntly usage maintained the increased levels seen since the end of January, averaging 54TJ/day. TCC started up in early March, averaging over 25TJ/day usage by the end of the month.
The following graph shows trends in the major gas users over the last seven years.
Gas storage is becoming increasingly important as falling production coincides with more variable demand, particularly from gas-fired electricity generation. The following chart shows how storage at Ahuroa decreased through March. It remains above average levels seen at this time of year over the last few years.
Internationally, LNG netback prices ended the month at $18.45/GJ – down 10% from last month. Forecast prices for 2025 were down 3% at $18.69/GJ. Forward prices for 2026 were up 1% at $16.41/GJ. (Note that netback prices are indicative of international prices – they are produced by the ACCC and quoted in Australian dollars. They are net of the estimated costs to convert from pipeline gas in Australia to LNG, hence the term “netback”)
New Zealand does not (yet) have an LNG export/import market, so our domestic prices are not directly linked to global prices. With recent gas supply issues, the Government is now talking about the possibility of facilitating the building of an LNG import facility.
LPG is an important fuel for many large energy users, particularly in areas where reticulated natural gas is not available. The contract price of LPG is typically set by international benchmarks such as the Saudi Aramco LPG – normally quoted in US$ per metric tonne.
The following graph shows the Saudi Aramco LPG pricing for the last four years as well as forecast pricing for the year ahead. Futures pricing were up over the last month.
The other main contributing factor to LPG prices in New Zealand is the exchange rate against the USD. The exchange rate increased slightly during March to close to 0.57 but remained near the lowest levels seen in recent years. This would tend to push up LPG prices when quoted in NZD.
The Coal Market
The global energy crisis has been as much about coal as it has gas. The war in the Ukraine has driven energy prices, including coal, up. Prices in March were flat, ending the month at US$100/T. These prices are finally returning to levels close to what we expect to see as shown in the following graph of prices over the last 10 years.
Like gas, the price of coal can flow through and have an impact on the electricity market. In March, Genesis reported that it expects to import about 630,000 tonnes of coal between now and September. The company says it currently holds about 515,000 tonnes at Huntly and has plans in place to make a third dual-fuel Rankine unit there available this winter if gas supplies and lake storage remain tight. Genesis says that 500,000 tonnes is the equivalent of about 1,000GWh of electricity storage or 22% of maximum hydro storage in NZ.
Carbon Pricing
NZ has had an Emissions Trading Scheme (ETS) in place since 2008. It has been subsequently reviewed by several governments and is now an “uncapped” price scheme closely linked to international schemes. However, there are “upper and lower guard-rails” set up to prevent wild swings in carbon price that act as minimum and maximum prices. These increased in December 2023 to $173 and $64 respectively. Carbon prices decreased 8% in March to $57.9.
As the carbon price rises, the cost of coal, gas or other fossil fuels used in process heat applications will naturally also rise. Electricity prices are also affected by a rising carbon price. Electricity prices are set by the marginal producing unit – in NZ this is currently typically coal or gas or hydro generators, with the latter valuing the cost of its water against the former. An increase in carbon price can lead to an increase in electricity prices in the short to medium term (as the marginal units set the price). A carbon price of $50/t is estimated to currently add about $25/MWh (or ~2.5c/kWh) to electricity prices. In the long term, the impact should reduce as money is invested in more low-cost renewables and there is less reliance on gas and coal-fired generation.
EU Carbon units decreased in March to 69 Euro/tonne – down 3%.
About this Report:
This energy market summary report provides information on wholesale price trends within the NZ Electricity Market. Please note that all electricity prices are presented as a $ per MWh price and all carbon prices as a $ per unit price. All spot prices are published by the Electricity Authority. Futures contract prices are sourced from ASX.
Further information can be found at the locations noted below.
- Transpower publishes a range of detailed information, which can be found here: https://www.transpower.co.nz/power-system-live-data
- The Electricity Authority publishes a range of detailed information, which can be found here: https://www.emi.ea.govt.nz/
- Weather and Climate data – The MetService publishes a range of weather-related information, which can be found here: https://www.metservice.com/
Disclaimer: This document has been prepared for informational and explanatory purposes only and is not intended to be relied upon by any person. This document does not form part of any existing or future contract or agreement between us. We make no representation, assurance, or guarantee as to the accuracy of the information provided. To the maximum extent permitted by law, none of Smart Power Ltd, its related companies, directors, employees or agents accepts any liability for any loss arising from the use of this document or its contents or otherwise arising out of or in connection with it. You must not provide this document or any information contained in it to any third party without our prior consent.
About Smart Power:
Smart Power is a full-service Energy Management consultancy. Apart from Energy Procurement, Smart Power can also provide:
- Technical advice on how to reduce your energy use & emissions
- Sustainability Reporting
- Invoice Management Services
We also offer boutique energy and water billing services for landlords/property developers.
Contact us here or call one of our offices to talk to our experienced staff about how we can assist you with achieving your energy goals.
© Copyright, 2025. Smart Power Ltd
Market Update February 2025
The Wholesale Electricity Market
Spot prices in the wholesale electricity market for February continued to climb rapidly from January’s levels. Average spot prices for the month ranged from $249 in the lower South Island (up from $110 in January) to $275 in the upper North Island ($122 last month).
The following chart shows average weekly spot prices over the last two years. The recent large increase can clearly be seen.
Electricity Demand
Electricity demand in February started off lower than what we have seen in recent years but increased later in the month to be close to average as shown below.
Electricity Generation Mix
Through February, as hydro inflows remained low and hydro storage continued to fall, there was a decline in hydro generation and a corresponding increase in thermal generation.
HVDC Transfer
Power transfers on the HVDC link connecting the North and South Islands are important both in showing relative hydro positions and the reliance on thermal power to meet demand. High northward flow tends to indicate a good SI hydro position, whereas the reverse indicates a heavy reliance on thermal power to make up for hydro shortages.
With declining South Island hydro storage levels, February saw a further decline in northward transfer with a switch to net southward transfer by the end of the month.
The Electricity Futures Market
The Futures Market indicates where market participants see the spot market moving in the future. They are based on actual trades between participants looking to hedge their positions (as both buyers and sellers) into the future against potential spot market volatility. They are also a useful proxy for the direction of retail contracts.
The following graph shows Futures pricing for CY 2025, 2026, 2027 and 2028 at Otahuhu (Auckland) for the last 2 years.
Note that $100/MWh equates to 10c/kWh.
Forward prices had falls for all years through February. CAL 2026 ended the month at $194/MWh – down 6% over the month. CY 2027 price was down 9% at $179 while CY 2028 was down 11% at $178.
Fonterra has recently announced some large electrification projects that will have a material impact on demand. Contact will supply 415GWh pa to two 35MW electrode boilers at Whareroa in South Taranaki, while Mercury has won a contract to supply about 260GWh pa to 2 Fonterra sites at Edgecumbe and Waitoa, which are adding a 30MW electrode boiler (at Edgecumbe) and two 4MW resistive boilers at Waitoa. Putting this into perspective, the combined energy is equivalent to more than half the annual generation from the recently completed Tauhara geothermal power station.
Known new generation projects are shown below (additions/removals/changes highlighted in bold).

Hydro Storage
Inflows in both the North and South Islands remained well below average in February.
These low inflows resulted in energy storage levels falling 617GWh through the month to end at 2,988GWh (68% full). Storage is now well below the average level seen at this time of year. The following chart shows the latest breakdown of storage across the main hydro catchments.
Security of supply risks increased through February with storage levels decreasing as shown below.
Snowpack
Snowpack is an important way that hydro energy is stored over the winter months and released as hydro inflows in the spring. The following graph shows that the snowpack in the important Waitaki catchment decreased through February and it is currently below the 25th percentile levels seen in the last 30 years for this time of year.
Climate Outlook Overview (from the MetService)
Climate Drivers — El Niño-Southern Oscillation (ENSO) sea surface temperatures have warmed slightly to neutral territories, while atmospheric conditions are now exhibiting more La Niña-like characteristics. Whilst it is now unlikely a La Niña will be declared, New Zealand may still favour northerly lows and warm, humid flows during the last part of March.
Both the Southern Annular Mode (SAM) and Tasman Sea Index (TSI) should trend positive (more settled and dry) from later this week through next week as high pressure builds. Another Madden-Julian Oscillation (MJO) pulse is expected late March, with an increased risk for tropical development. Whether any of these may spread southwards towards New Zealand will depend on how quickly high pressure eases and moves eastwards, so keep your eyes northwards.
Abundant sunshine last month allowed sea surface temperatures to rise rapidly, particularly near the South Island and western North Island where anomalies are now 1-2C above normal. This warming trend may continue through March, with hints of a marine heat wave developing which could add fuel and strength to any incoming weather systems across the latter part of March.
March 2025 Outlook — A cold front brings modest westerly rain and a cooler reprieve to the country this week, followed by a showery onshore flow across eastern regions that may deliver a decent chunk of this month’s rainfall in those eastern regions. High pressure is then forecast to return, with high confidence of warmer-than-average temperatures and a general drying trend country-wide through at least mid-month.
The persistent high pressure shows signs of weakening during the third week of March, with the odd system becoming more likely to spread across the country with modest rainfall, though most of New Zealand is likely to remain drier-than-average. Temperatures are also expected to remain above normal, with increasing soil moisture deficits and drying soils looking likely to persist.
The final week of March shows slightly more promise for rainmakers. High pressure should ease and move eastwards, with the Southern Ocean and south Tasman Sea showing signs of reawakening, though western regions of the North Island may see the dry weather hold on a bit longer through the end of the month. Saying that, the tropics may become more active towards the end of March, but any southward progression towards the country will be highly dependent on how quickly the high pressure departs.
While this may not be the weather forecast that everyone desires, a quick look into early April provides a glint of hope for a return to more frequent weather systems.

The Wholesale Gas Market
Spot gas prices in February continued to climb. Prices for the month averaged $15.9/GJ – a 59% increase compared to January. Average prices were on a par with what they were at the same time last year.
On the supply side, Turangi and Kowhai maintained the higher output seen in late January, averaging 65.6TJ/day through February. Maui production reduced slightly over the month, falling to 52TJ/day. Pohokura maintained output, averaging around 30TJ/day. Kupe also held its output at around 41TJ/day. McKee / Mangahewa reduced output through the month, falling to 40-50TJ per day by last February.
The following graph shows production levels from major fields over the last seven years.
Methanex gas usage continued to fall through February from 85TJ/day at the start of the month, ending up at close to 50TJ/day. Huntly usage maintained the increased levels seen at the end of January, averaging 57TJ/day for February. TCC remained idle for the month and Contact Energy has advised that it has no gas contracted to enable TCC to run. There is talk that Genesis has swapped some contracted gas with Methanex, “banking” some gas if required for this winter.
The following graph shows trends in the major gas users over the last six years.
Gas storage is becoming increasingly important as falling production coincides with more variable demand, particularly from gas-fired electricity generation. The following chart shows how storage at Ahuroa decreased marginally through February, but it remains at close to the highest level it has been at this time of year over the last few years.
Internationally, LNG netback prices ended the month at $20.59/GJ – up 6% from last month. Forecast prices for 2025 were down 4% at $19.25/GJ. Forward prices for 2026 were also down 7% at $16.25/GJ. (Note that netback prices are indicative of international prices – they are produced by the ACCC and quoted in Australian dollars. They are net of the estimated costs to convert from pipeline gas in Australia to LNG, hence the term “netback”)
New Zealand does not (yet) have an LNG export/import market, so our domestic prices are not directly linked to global prices. With recent gas supply issues, the Government is now talking about the possibility of facilitating the building of an LNG import facility.
LPG is an important fuel for many large energy users, particularly in areas where reticulated natural gas is not available. The contract price of LPG is typically set by international benchmarks such as the Saudi Aramco LPG – normally quoted in US$ per metric tonne.
The following graph shows the Saudi Aramco LPG pricing for the last 4 years as well as forecast pricing for the year ahead. Futures pricing were flat over the last month.
The other main contributing factor to LPG prices in New Zealand is the exchange rate against the USD. The exchange rate increased during February to close to 0.575 before falling, ending the month below where it started – just above 0.56, near the lowest levels seen in recent years. This would tend to push up LPG prices when quoted in NZD.
The Coal Market
The global energy crisis has been as much about coal as it has gas. The war in the Ukraine has driven energy prices, including coal, up. Prices in February fell to the lowest levels seen in 4 years, ending the month at US$100/T – a 16% decrease on the January close. These prices are finally returning to levels close to what we expect to see as shown in the following graph of prices over the last 10 years.
Like gas, the price of coal can flow through and have an impact on the electricity market. In October Genesis reported that it planned to import at least 270,000 tonnes of coal by March to help secure electricity supplies going into next winter. It had previously aimed to stockpile 350,000 tonnes, but now says it wants to hold about 500,000 tonnes to cover peak autumn and winter electricity demand in 2025. Genesis says that 500,000 tonnes is the equivalent of about 1,000GWh of electricity storage or 22% of maximum hydro storage in NZ.
Carbon Pricing
NZ has had an Emissions Trading Scheme (ETS) in place since 2008. It has been subsequently reviewed by several governments and is now an “uncapped” price scheme closely linked to international schemes. However, there are “upper and lower guard-rails” set up to prevent wild swings in carbon price that act as minimum and maximum prices. These increased in December 2023 to $173 and $64 respectively. Carbon prices decreased 1% in February to $63.2.
As the carbon price rises, the cost of coal, gas or other fossil fuels used in process heat applications will naturally also rise. Electricity prices are also affected by a rising carbon price. Electricity prices are set by the marginal producing unit – in NZ this is currently typically coal or gas or hydro generators, with the latter valuing the cost of its water against the former. An increase in carbon price can lead to an increase in electricity prices in the short to medium term (as the marginal units set the price). A carbon price of $50/t is estimated to currently add about $25/MWh (or ~2.5c/kWh) to electricity prices. In the long term, the impact should reduce as money is invested in more low-cost renewables and there is less reliance on gas and coal-fired generation.
EU Carbon units decreased in February to 71 Euro/tonne – down 15%.
About this Report:
This energy market summary report provides information on wholesale price trends within the NZ Electricity Market. Please note that all electricity prices are presented as a $ per MWh price and all carbon prices as a $ per unit price. All spot prices are published by the Electricity Authority. Futures contract prices are sourced from ASX.
Further information can be found at the locations noted below.
- Transpower publishes a range of detailed information which can be found here: https://www.transpower.co.nz/power-system-live-data
- The Electricity Authority publishes a range of detailed information which can be found here: https://www.emi.ea.govt.nz/
- Weather and Climate data – The MetService publishes a range of weather-related information which can be found here: https://www.metservice.com/
Disclaimer: This document has been prepared for information and explanatory purposes only and is not intended to be relied upon by any person. This document does not form part of any existing or future contract or agreement between us. We make no representation, assurance, or guarantee as to the accuracy of the information provided. To the maximum extent permitted by law, none of Smart Power Ltd, its related companies, directors, employees or agents accepts any liability for any loss arising from the use of this document or its contents or otherwise arising out or, or in connection with it. You must not provide this document or any information contained in it to any third party without our prior consent.
About Smart Power:
Smart Power is a full-service Energy Management consultancy. Apart from Energy Procurement, Smart Power can also provide:
- Technical advice on how to reduce your energy use & emissions
- Sustainability Reporting
- Invoice Management Services
We also offer boutique energy and water billing services for landlords/property developers.
Contact us here or call one of our offices to talk to our experienced staff about how we can assist you with achieving your energy goals.
© Copyright, 2025. Smart Power Ltd