
Tag: market Update May 2024
Market Update May 2024
The Wholesale Electricity Market
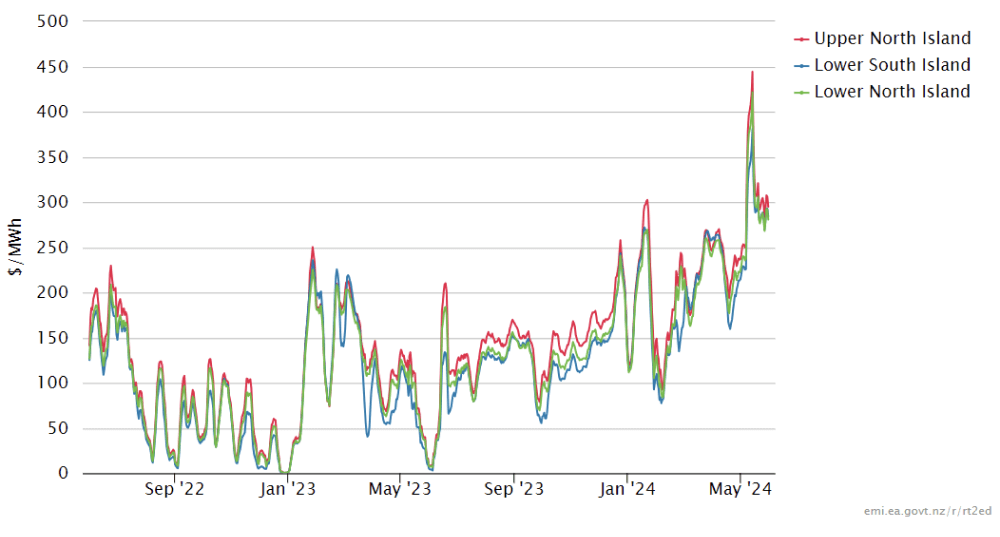
Spot prices in the wholesale electricity increased again in May from their already very high levels. Average spot prices ranged from $285 in the lower South Island (up from $211 in March), up to $312 in the upper South Island (up from $230).
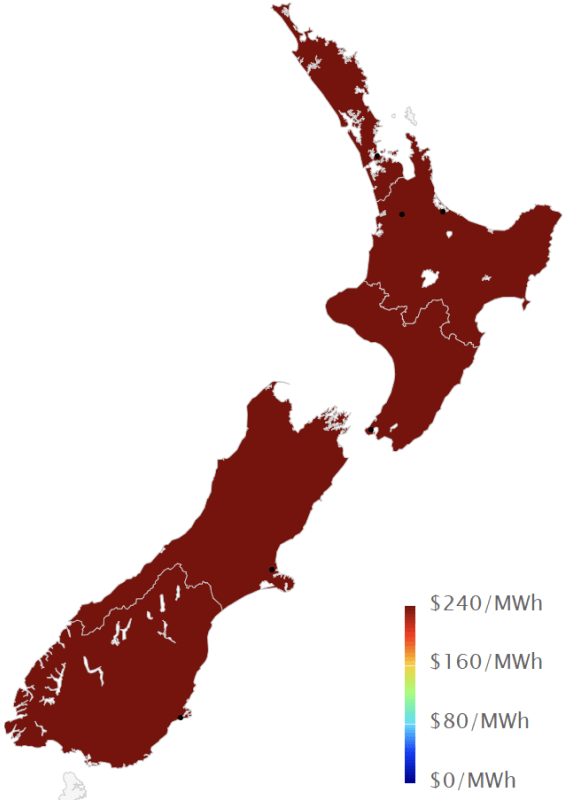
The following chart shows average weekly spot prices over the last 2 years. The high peak in the middle of the month is greater than any time in the last 10 years (on a rolling 7-day basis).
Electricity Demand
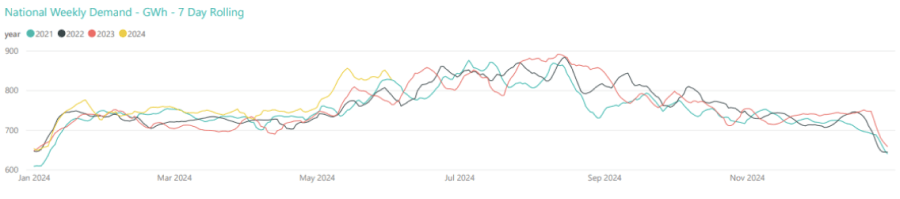
Electricity demand through May remained above levels seen in recent years as shown below. There also appears to be an early seasonal increase due to cooler weather, with May being the coldest in NZ since 2009.
Electricity Generation Mix
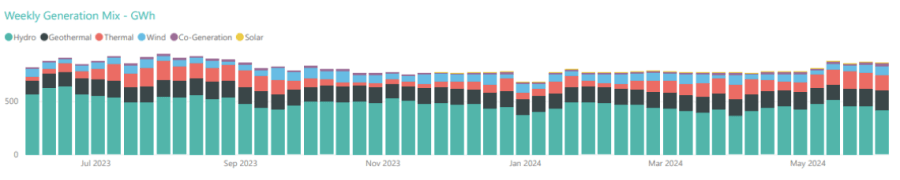
Through May the increased demand was largely picked up by thermal generation. An increase in wind and geothermal generation also allowed hydro generation to back off.
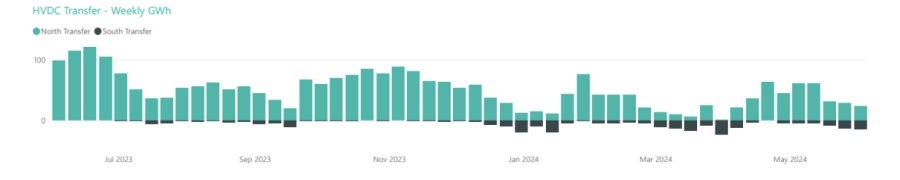
HVDC Transfer
Power transfers on the HVDC link connecting the North and South Islands are important both in showing relative hydro positions and the reliance on thermal power to meet demand. High northward flow tends to indicate a good SI hydro position, whereas the reverse indicates a heavy reliance on thermal power to make up for hydro shortages.
May saw attempts to conserve South Island storage by reducing northward transfer and increasing southward transfer.
The Electricity Futures Market
The Futures Market provides an indication of where market participants see the spot market moving in the future. They are based on actual trades between participants looking to hedge their positions (as both buyers and sellers) into the future against potential spot market volatility. They are also a useful proxy for the direction of retail contracts.
The following graph shows Futures pricing for CY 2024, 2025, 2026 and 2027 at Otahuhu (Auckland) for the last 2 years.
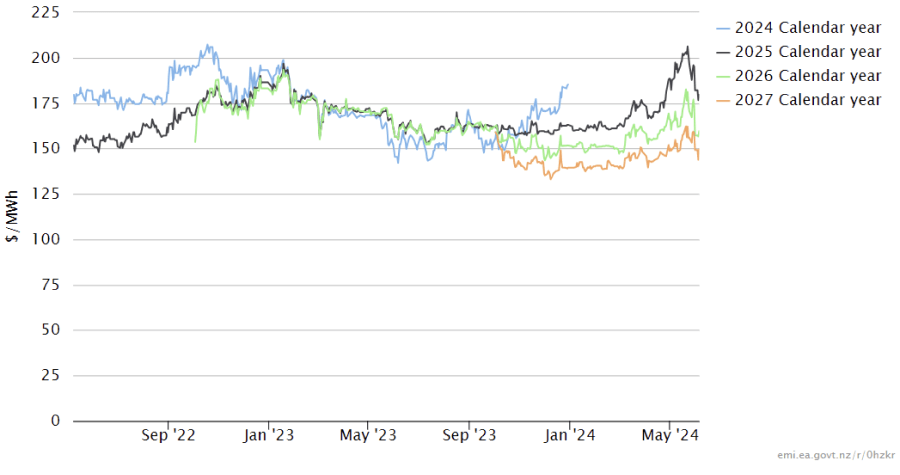
Note that $100/MWh equates to 10c/kWh.
Forward prices were down in May for all future years except CY 2027. CY 2025 ended the month down 3% at $182. CY 2026 price was down 5% at $157 while CY 2027 closed up marginally at $149/MWh (+0.3%).
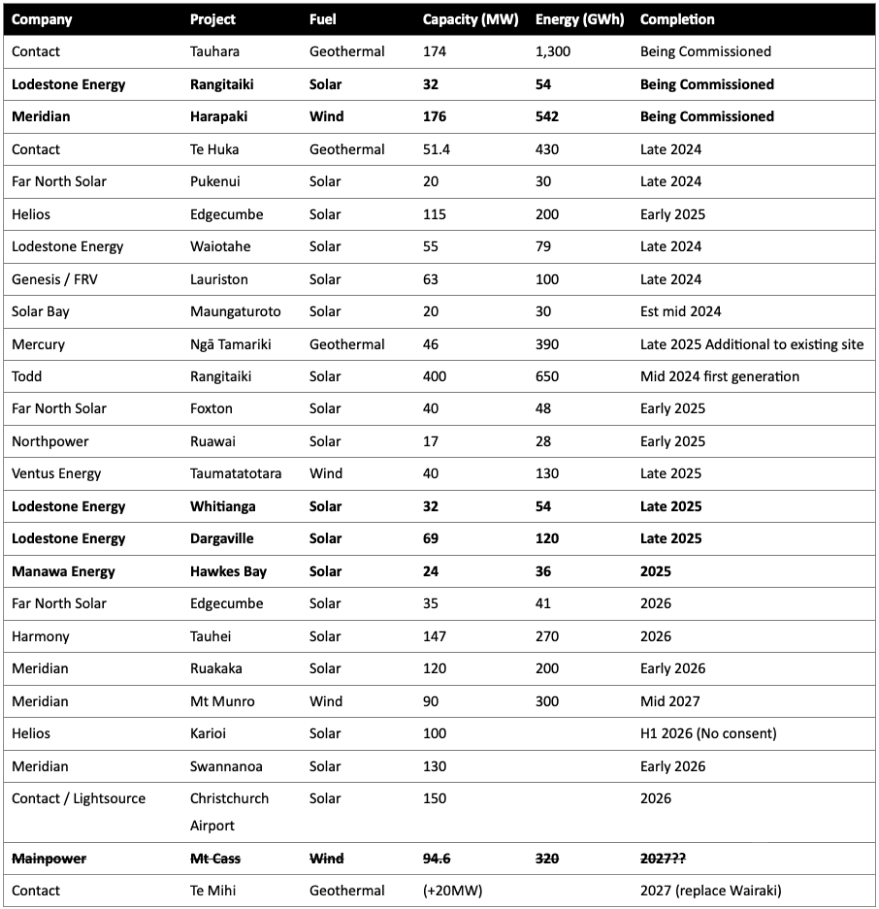
From a demand perspective, at the end of May it was announced that 20-year electricity supply contracts had been signed with New Zealand Aluminium Smelters, providing certainty to the market that the largest load in NZ will remain after the current contracts expire this year. This should now provide the confidence to get a large number of muted projects committed, and hopefully see some longer term electricity price reductions.
Known new generation projects are shown below (additions / removals / changes highlighted in bold).
Hydro Storage
Inflows were very low in the South Island during May – reported as the second lowest in 90 years of data. The North Island had below average inflows at the start of the month, however they picked up later to almost end up at average levels for the month.
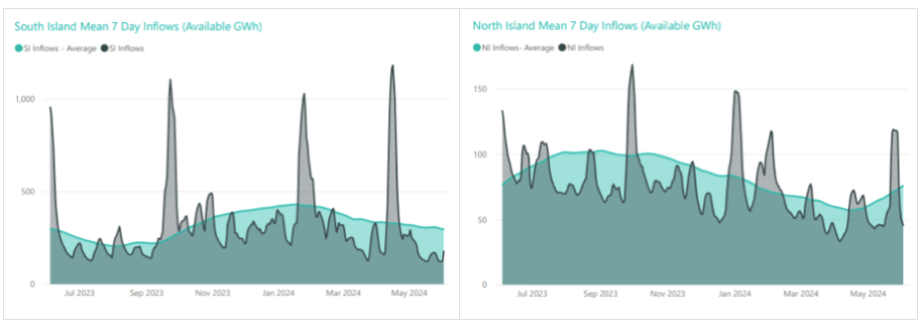
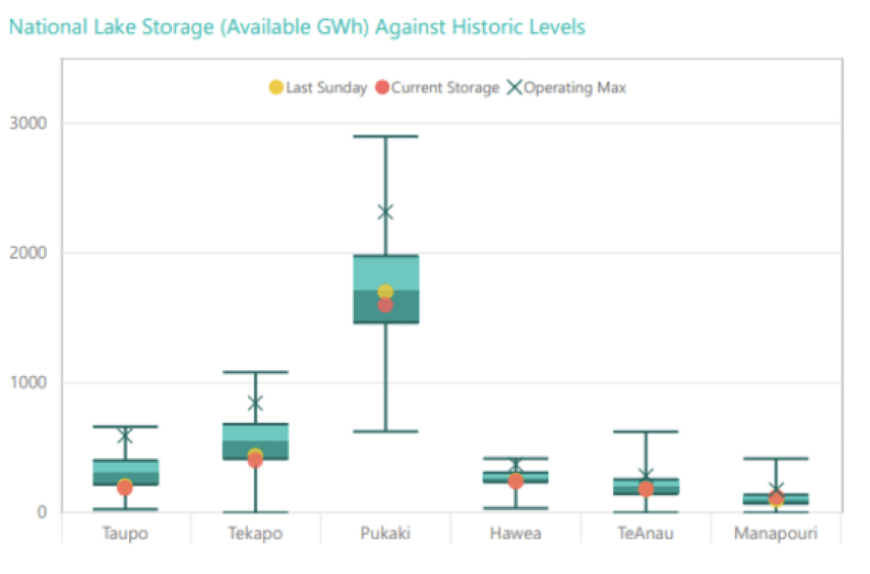
Very low inflows resulted in energy storage levels plummeting in May. NZ storage ended the month at 2,601GWh or 58% full, down 835GWh. The following chart shows the latest breakdown of storage across the main hydro catchments.
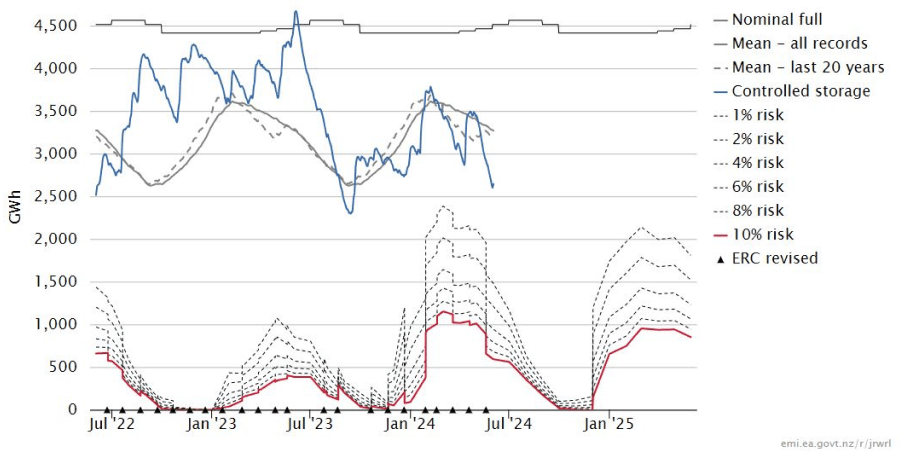
Security of supply risks increased significantly in May with storage levels decreasing. This is shown in the following risk curves.
Snowpack
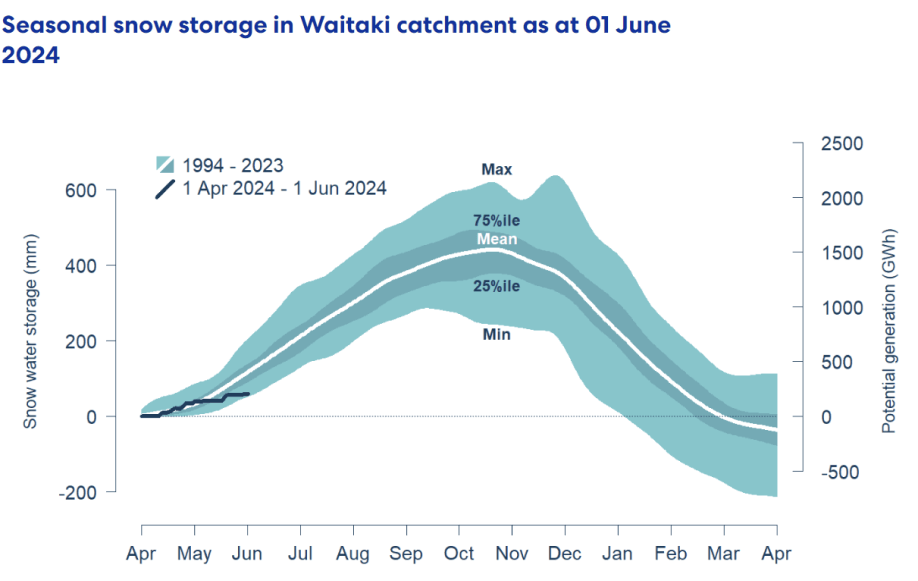
Snowpack is an important way that hydro energy is stored over the winter months and released as hydro inflows in the spring. The following graph shows that the snowpack in the important Waitaki catchment is currently close to the minimum levels seen in the last 30 years for this time of year.
Climate outlook overview (from the MetService)
Climate Drivers — The El Niño Southern Oscillation (ENSO) is now in neutral territory and should remain so throughout winter. Whilst our 23-24 El Niño event has had a definitive say on our weather maps since March, its influence is now expected to wane as short-term variability takes the lead during the winter months.
This, combined with cooler than normal sea surface temperatures around and south of New Zealand (again, very different to last year), is likely to drive a fairly typical winter season as a whole, with lots of variability, plenty of cold snaps and seasonal rainfall and temperature patterns not departing too far from long term climate averages.
This might not seem like a very bold prediction, but following on from 4 of the 5 warmest winters NZ has seen since winter 2020, and the wettest winter on record in 2022, just seeing typical winter weather may come as quite a shock to the system! Of course, this doesn’t mean we won’t see departures from normal at a regional level across the country, especially month-to-month, but over the whole season we can expect things to feel different to the winters of recent years which were set against a prolonged La Niña event.
There remains a heightened chance that another phase of La Niña will develop this spring, but its strength and effects on NZ remain far from certain and would likely only become influential over summer.
June 2024 Outlook — After a cold Autumn, we start winter on a milder note with the opening half of the month seeing some warmer northwest to northerly airmasses affect the country. At this time of the year these can often be accompanied by broad rain-bearing weather systems moving out of the Tasman Sea, and as we head into the later parts of this week (beginning Mon 3rd) through mid-month a number of these systems could bring bouts of rainfall quite widely, with the heaviest falls favoured around North Island and upper South Island. Portions of the lower South Island, Westland and Fiordland in particular, are expected to see a much drier start to the month than normal, but there is a chance of warm NW rain before mid-month here too.
These weather patterns can also bring very windy spells east of the South Island main divide, and across central NZ. As always as this time of year, watch for when low pressure systems exit eastwards into the Pacific Ocean for any significant snow or cold weather. There remains lots of uncertainty with rainfall and wind details with these systems before mid-month at this stage, and it will pay to keep up to date with your latest forecast at metservice.com.
The second half of the month should see increased potential for multi-day runs of cold, clear and dry weather with higher pressure favoured to become more influential right across NZ. SW winds would be the order of the day, and the North Island should see a drier second half of the month, whilst western areas of South Island see more typical, changeable weather roll through by months end.
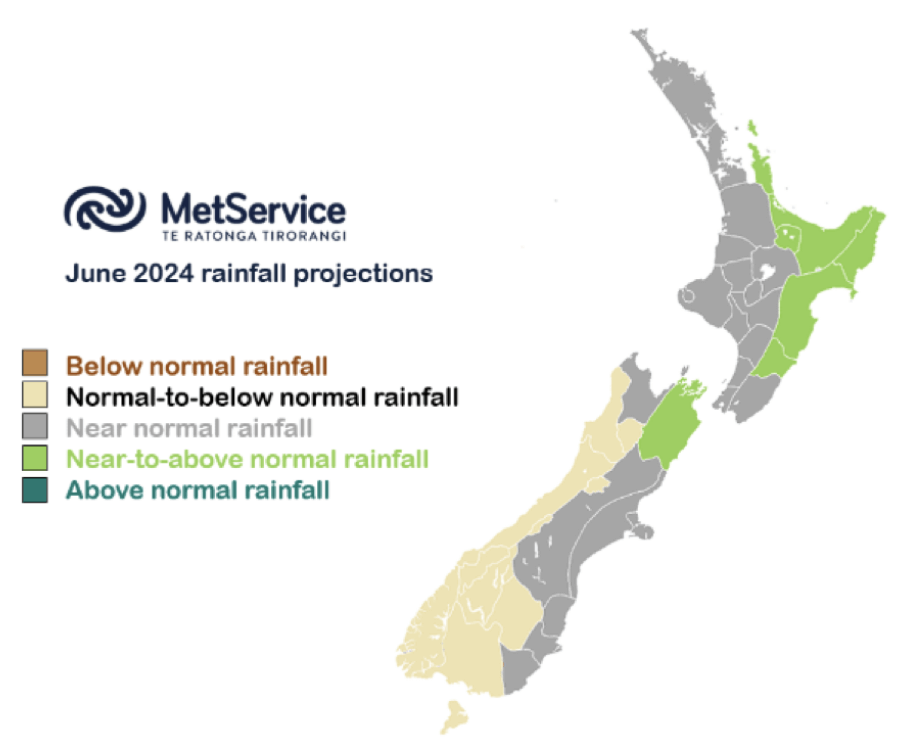
So, temperatures should end up near normal, or even slightly cooler than normal, for the month as a whole with colder weather increasingly likely during the second half of the month. Much more uncertainty around rainfall patterns with lots of day-today variability, but a wetter than normal spell before mid-month for North Island, especially the eastern half, drives a wet anomaly here around Bay of Plenty, Gisborne and the Hawkes Bay. Drier than normal conditions are forecast for western South Island, Otago and Southland, but less confidence in this aspect of the forecast where much could depend on just one heavy rain event before mid-month. The rest of the country should see near-normal rainfall this June.
The Wholesale Gas Market
Spot gas prices increased significantly again in May averaging $28.65/GJ – up 31% in the month. Wholesale prices are now 208% higher than they were at the same time last year.
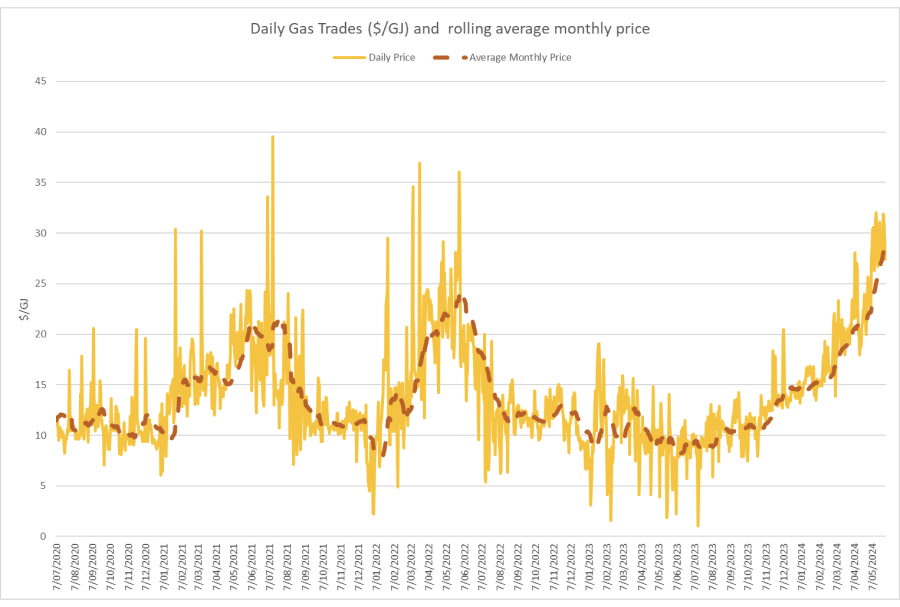
We have seen signs that gas retailers are refusing to offer contracts to end users even where they are the incumbent retailer. Some tenders are getting no offers at all from retailers.
The Government has set up a body, the Gas Security Response Group, to “coordinate a response to reports of an increasingly tight gas supply from the GIC and the broader gas sector. It will verify gas supply and demand and identify actions to address the situation.” It will be interesting to see what they come up with, however it is difficult to see what they can do in the short term apart from reducing supply to some large gas users to free up supply for others.
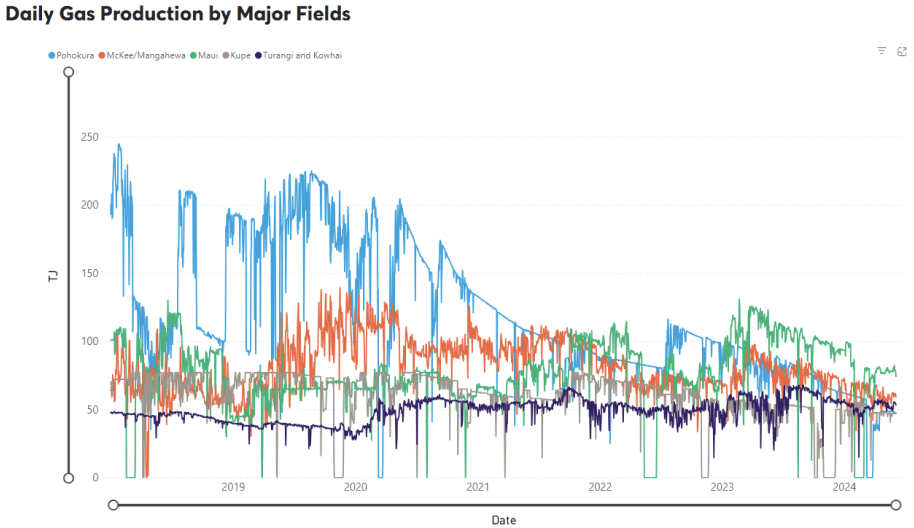
On the supply side there was very little change in output over the month – still at a low level compared to historical levels. Pohokura maintained output at just below 50TJ/day – still below the pre-shutdown output of 57TJ per day. Maui held output through the month at around 78.5TJ/day. McKee / Mangahewa averaged slightly below 60TJ per day across the month. Kupe also maintained output at 47TJ per day.
The following graph shows production levels from major fields over the last 6 years.
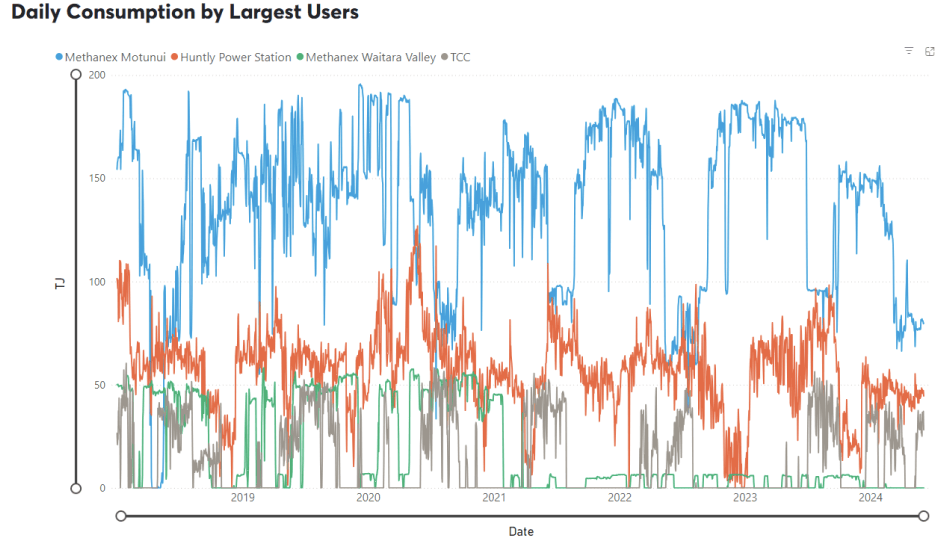
On the demand side, Methanex Motonui’s usage remained at the lower levels experienced in April providing the buffer for the reduced supply. Usage averaged close to 80TJ/day through May. Huntly power station increased marginally, averaging 44.5TJ/day, while TCC restarted midway through the month, averaging close to 30TJ per day once running.
The following graph shows trends in the major gas users over the last 6 years.
Internationally, LNG netback prices ended the month at $13.62/GJ – up 8% from last month. Forecast prices for 2024 increased to $14.81 – up 9% compared to April. Forecast prices for 2025 were also up 12% at $16.46/GJ.
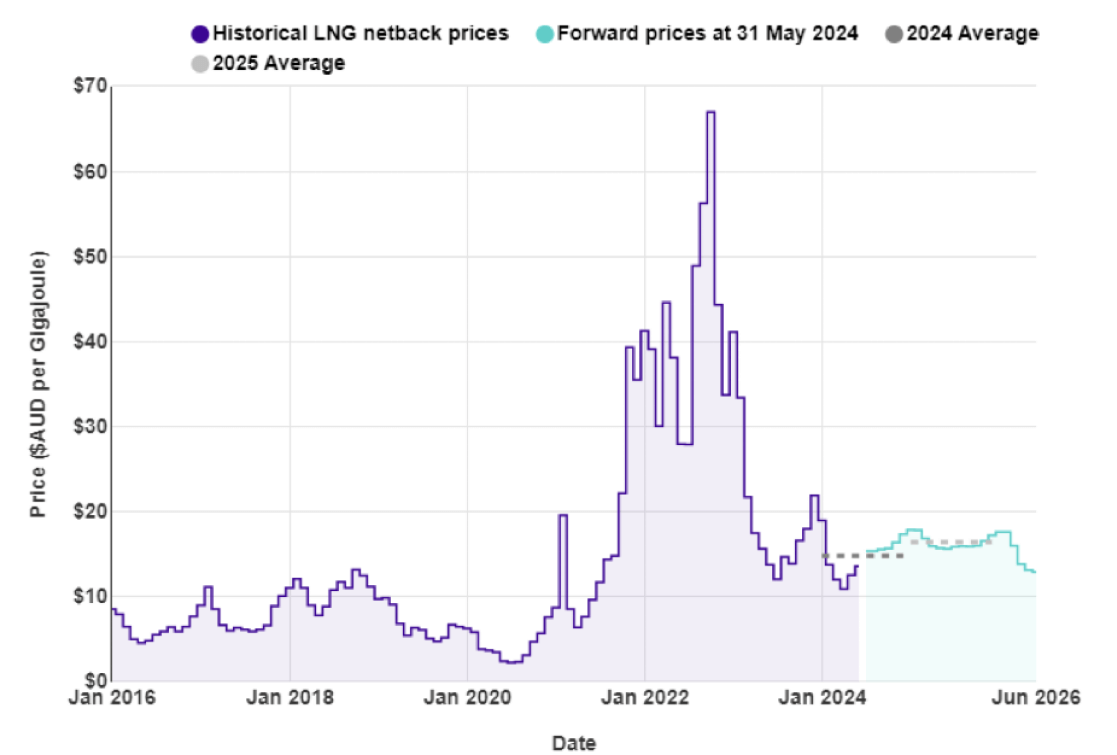
New Zealand does not have an LNG export market, so our domestic prices are not directly linked to global prices.
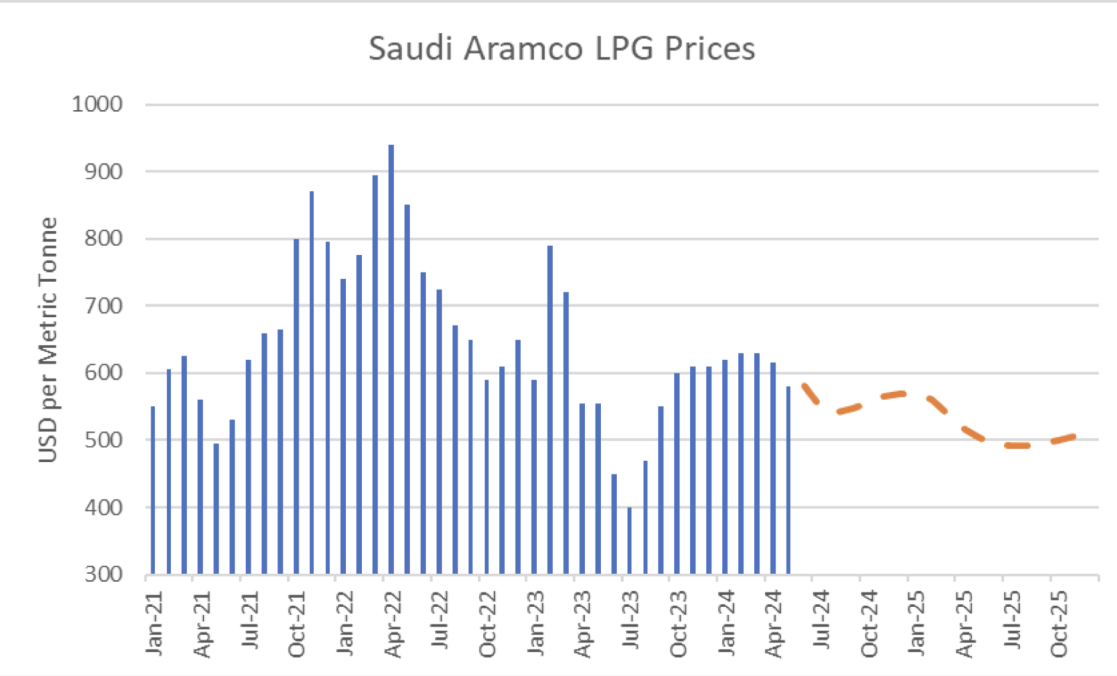
LPG is an important fuel for many large energy users, particularly in areas where reticulated natural gas is not available. The contract price of LPG is typically set by international benchmarks such as the Saudi Aramco LPG – normally quoted in US$ per metric tonne.
The following graph shows the Saudi Aramco LPG pricing for the last 3 years as well as forecast pricing for the year ahead.
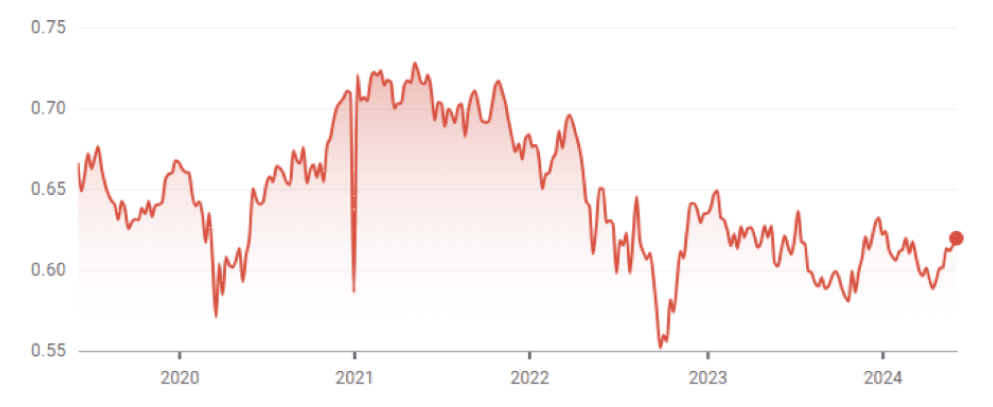
The other main contributing factor to LPG prices in New Zealand is the exchange rate against the USD. As shown below this has been falling over the last few years adding to domestic LPG prices.
The Coal Market
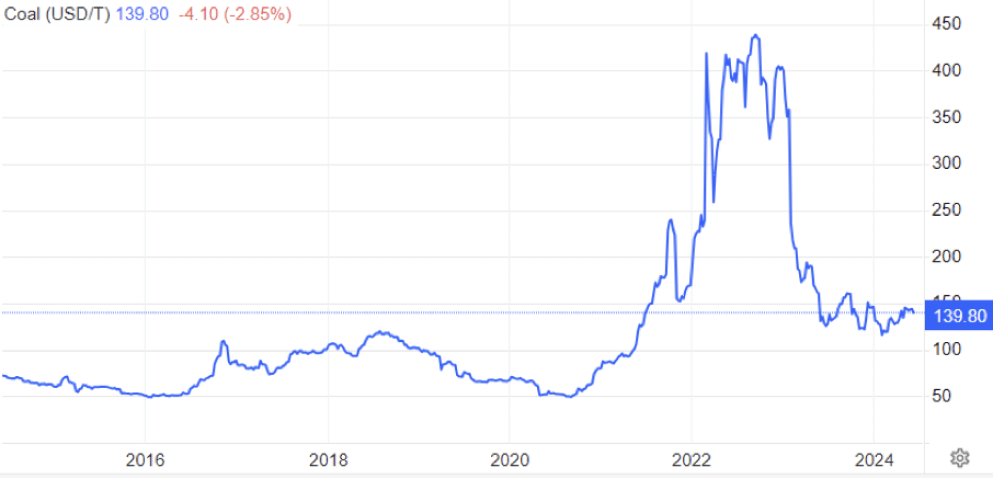
The global energy crisis has been as much about coal as it has gas. The war in the Ukraine has driven energy prices, including coal, up. Prices in May were largely flat, ending the month at US$143/T – a 1% decrease on the April close. These prices are finally returning to levels close to what we expect to see as shown in the following graph of prices over the last 10 years.
Like gas, the price of coal can flow through and have an impact on the electricity market. In April, Genesis reported that coal stockpiles had been reducing over the last couple of years. The Huntly coal stockpile held 624,000 tonnes as at 31 March 2024, down from 731,000 tonnes at 31 December 2023, 859,000 tonnes at 30 September 2023, and 968,000 tonnes a year earlier.
Carbon Pricing
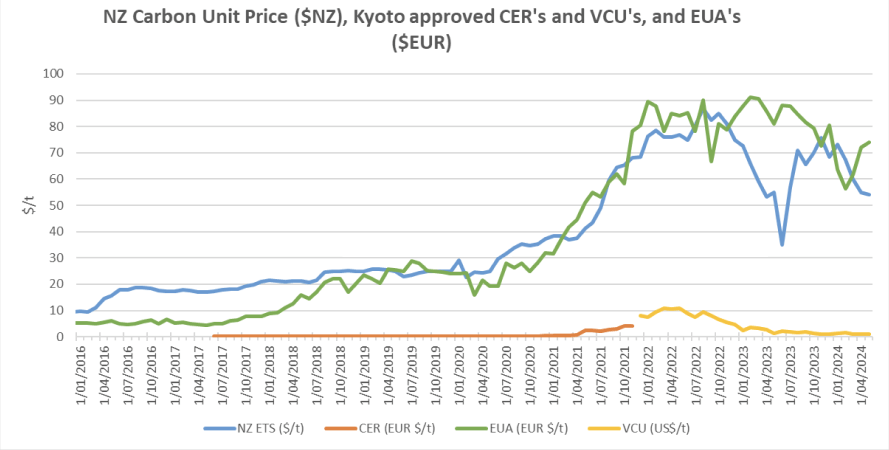
NZ has had an Emissions Trading Scheme (ETS) in place since 2008. It has been subsequently reviewed by several governments and is now an “uncapped” price scheme closely linked to international schemes. However, there are “upper and lower guard-rails” set up to prevent wild swings in carbon price that act as minimum and maximum prices. These increased in December 2023 to $173 and $64 respectively. Carbon prices decreased a further 2% in May to $54.
As the carbon price rises, the cost of coal, gas or other fossil fuels used in process heat applications will naturally also rise. Electricity prices are also affected by a rising carbon price. Electricity prices are set by the marginal producing unit – in NZ this is currently typically coal or gas or hydro generators, with the latter valuing the cost of its water against the former. An increase in carbon price can lead to an increase in electricity prices in the short to medium term (as the marginal units set the price). A carbon price of $50/t is estimated to currently add about $25/MWh (or ~2.5c/kWh) to electricity prices. In the long term the impact should reduce as money is invested in more low-cost renewables and there is less reliance on gas and coal fired generation.
EU Carbon Permits increased in May to 74.1 Euro/tonne – up 3%.
About this Report
This energy market summary report provides information on wholesale price trends within the NZ Electricity Market.
Please note that all electricity prices are presented as a $ per MWh price and all carbon prices as a $ per unit price.
All spot prices are published by the Electricity Authority. Futures contract prices are sourced from ASX.
Further information can be found at the locations noted below.
- Transpower publishes a range of detailed information which can be found here: https://www.transpower.co.nz/power-system-live-data
- The Electricity Authority publishes a range of detailed information which can be found here: https://www.emi.ea.govt.nz/
- Weather and Climate data – The MetService publishes a range of weather-related information which can be found here: https://www.metservice.com/
Disclaimer
This document has been prepared for information and explanatory purposes only and is not intended to be relied upon by any person. This document does not form part of any existing or future contract or agreement between us. We make no representation, assurance, or guarantee as to the accuracy of the information provided. To the maximum extent permitted by law, none of Smart Power Ltd, its related companies, directors, employees or agents accepts any liability for any loss arising from the use of this document or its contents or otherwise arising out or, or in connection with it. You must not provide this document or any information contained in it to any third party without our prior consent.
About Smart Power
Smart Power is a full-service Energy Management consultancy. Apart from Energy Procurement, Smart Power can also provide:
- Technical Advice on how to reduce your energy use/emissions
- Sustainability Reporting
- Invoice Management services.
We also offer boutique energy and water billing service for landlords/property developers.
Contact us at https://smartpower1.wpenginepowered.com/contact/ or ring one of our offices to talk to one of our experienced staff about how we can assist you with achieving your energy goals.
© Copyright, 2024. Smart Power Ltd