
The Wholesale Electricity Market
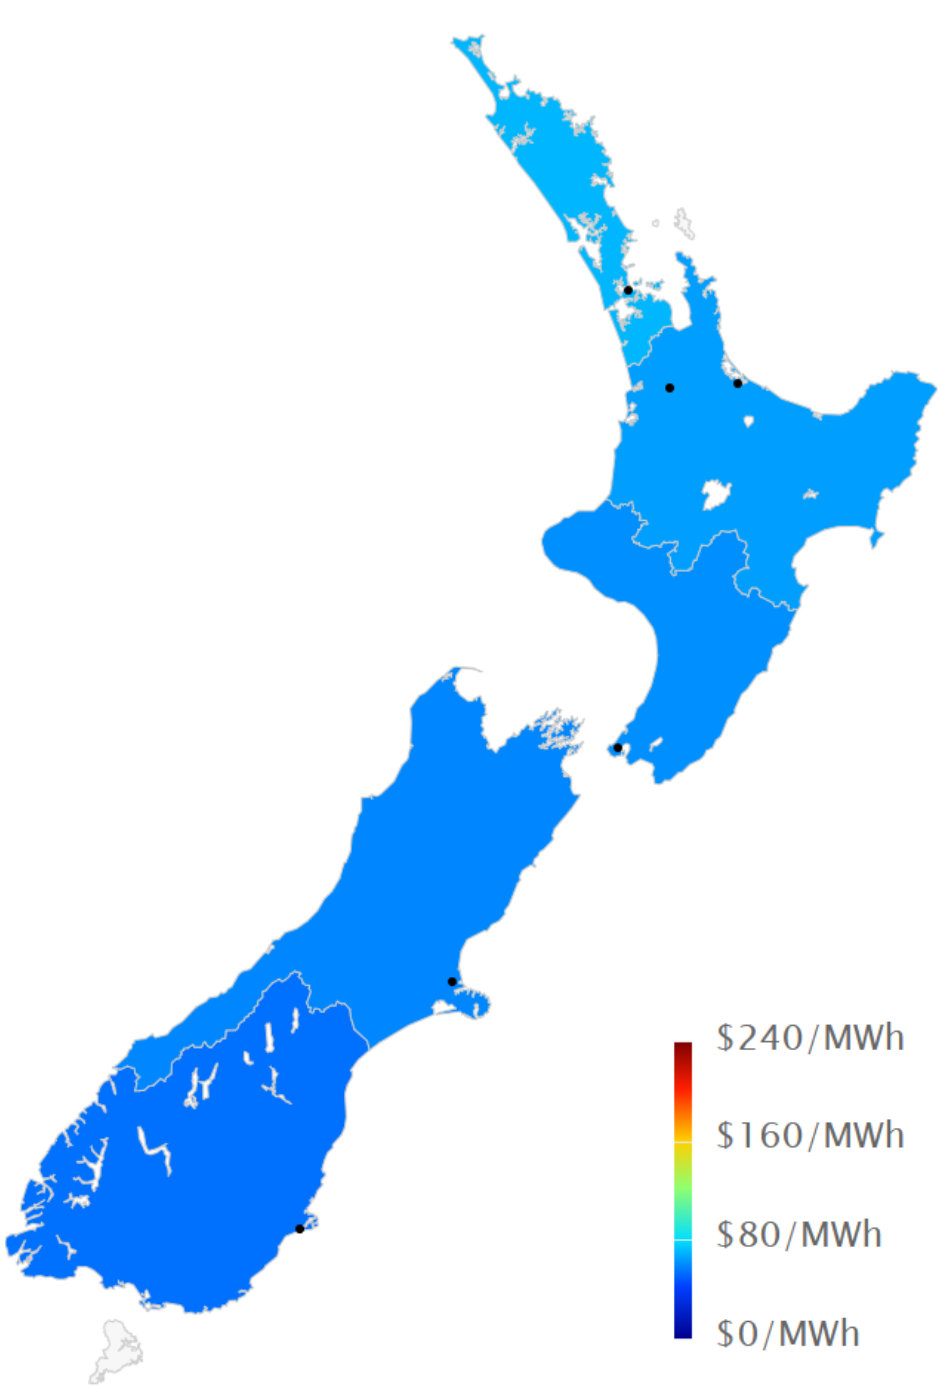
Spot prices in the wholesale electricity market increased significantly during November but remained below levels normally seen. Average spot prices for the month ranged from $54 in the lower South Island (up from $27 in October), up to $70 in the upper North Island ($33 in October).
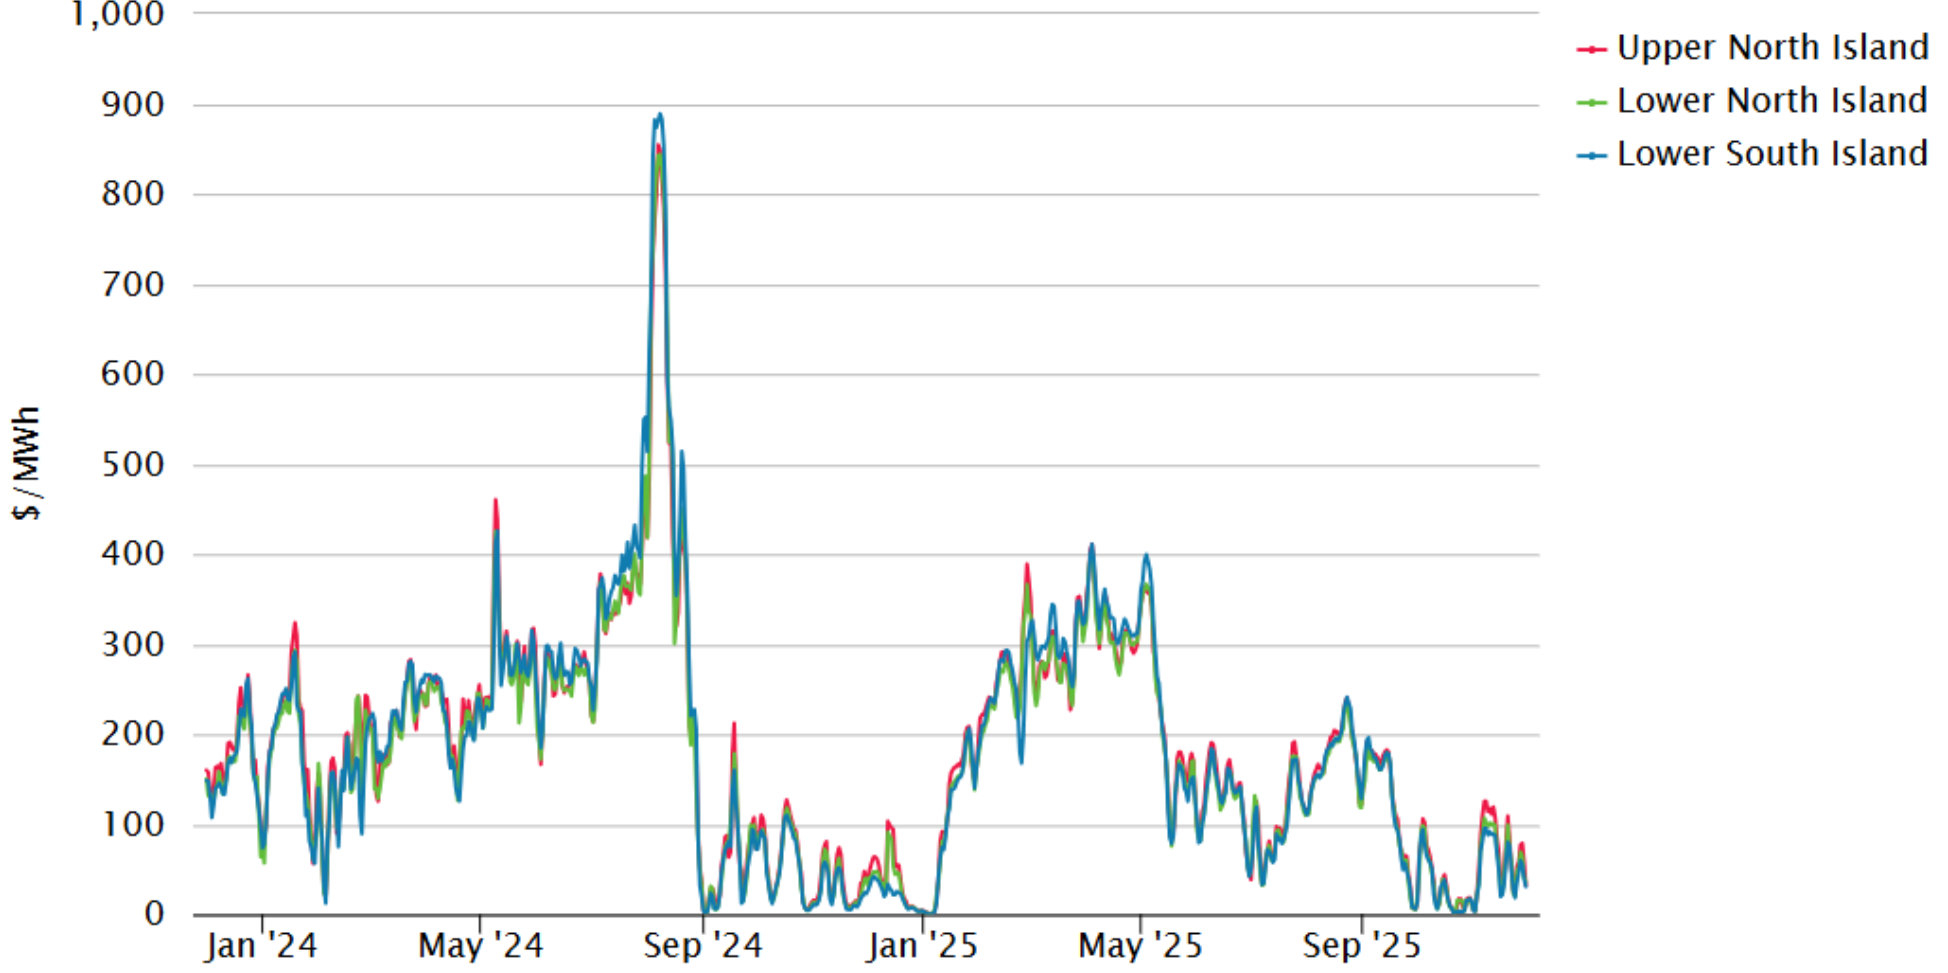
The following chart shows average weekly spot prices over the last 2 years. The low prices in the last 2 months can be clearly seen.
Electricity Demand
As expected, demand has fallen off heading into summer, however it was at the top end of levels expected for this time of year.

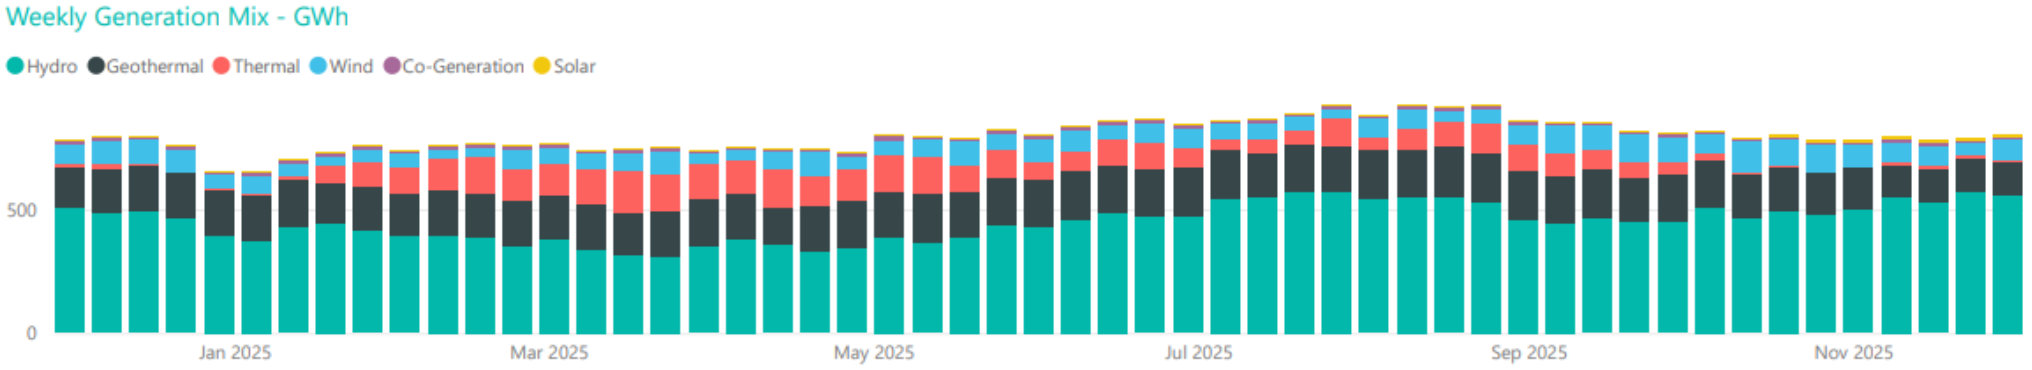
Electricity Generation Mix
Increased hydro generation meant thermal generation remained at minimal levels for all the month.
HVDC Transfer
Power transfers on the HVDC link connecting the North and South Islands are important both in showing relative hydro positions and the reliance on thermal power to meet demand. High northward flow tends to indicate a good SI hydro position, whereas the reverse indicates a heavy reliance on thermal power to make up for hydro shortages.
Northward transfer in November increased to close to the maximum levels seen in the last 12 months while southward transfer was non-existent.
The Electricity Futures Market
The Futures Market provides an indication of where market participants see the spot market moving in the future. They are based on actual trades between participants looking to hedge their positions (as both buyers and sellers) into the future against potential spot market volatility. They are also a useful proxy for the direction of retail contracts.
The following graph shows Futures pricing for CY 2025, 2026, 2027, 2028 and 2029 at Otahuhu (Auckland) for the last 4 years.

Note that $200/MWh equates to 20c/kWh.
Forward prices were down for all years through November. CAL 2026 decreased ending the month at $173/MWh – down 11%. CY 2027 price was down marginally at $179 as was CY 2028 at $171. CY2029 was down 2.5% at $160.
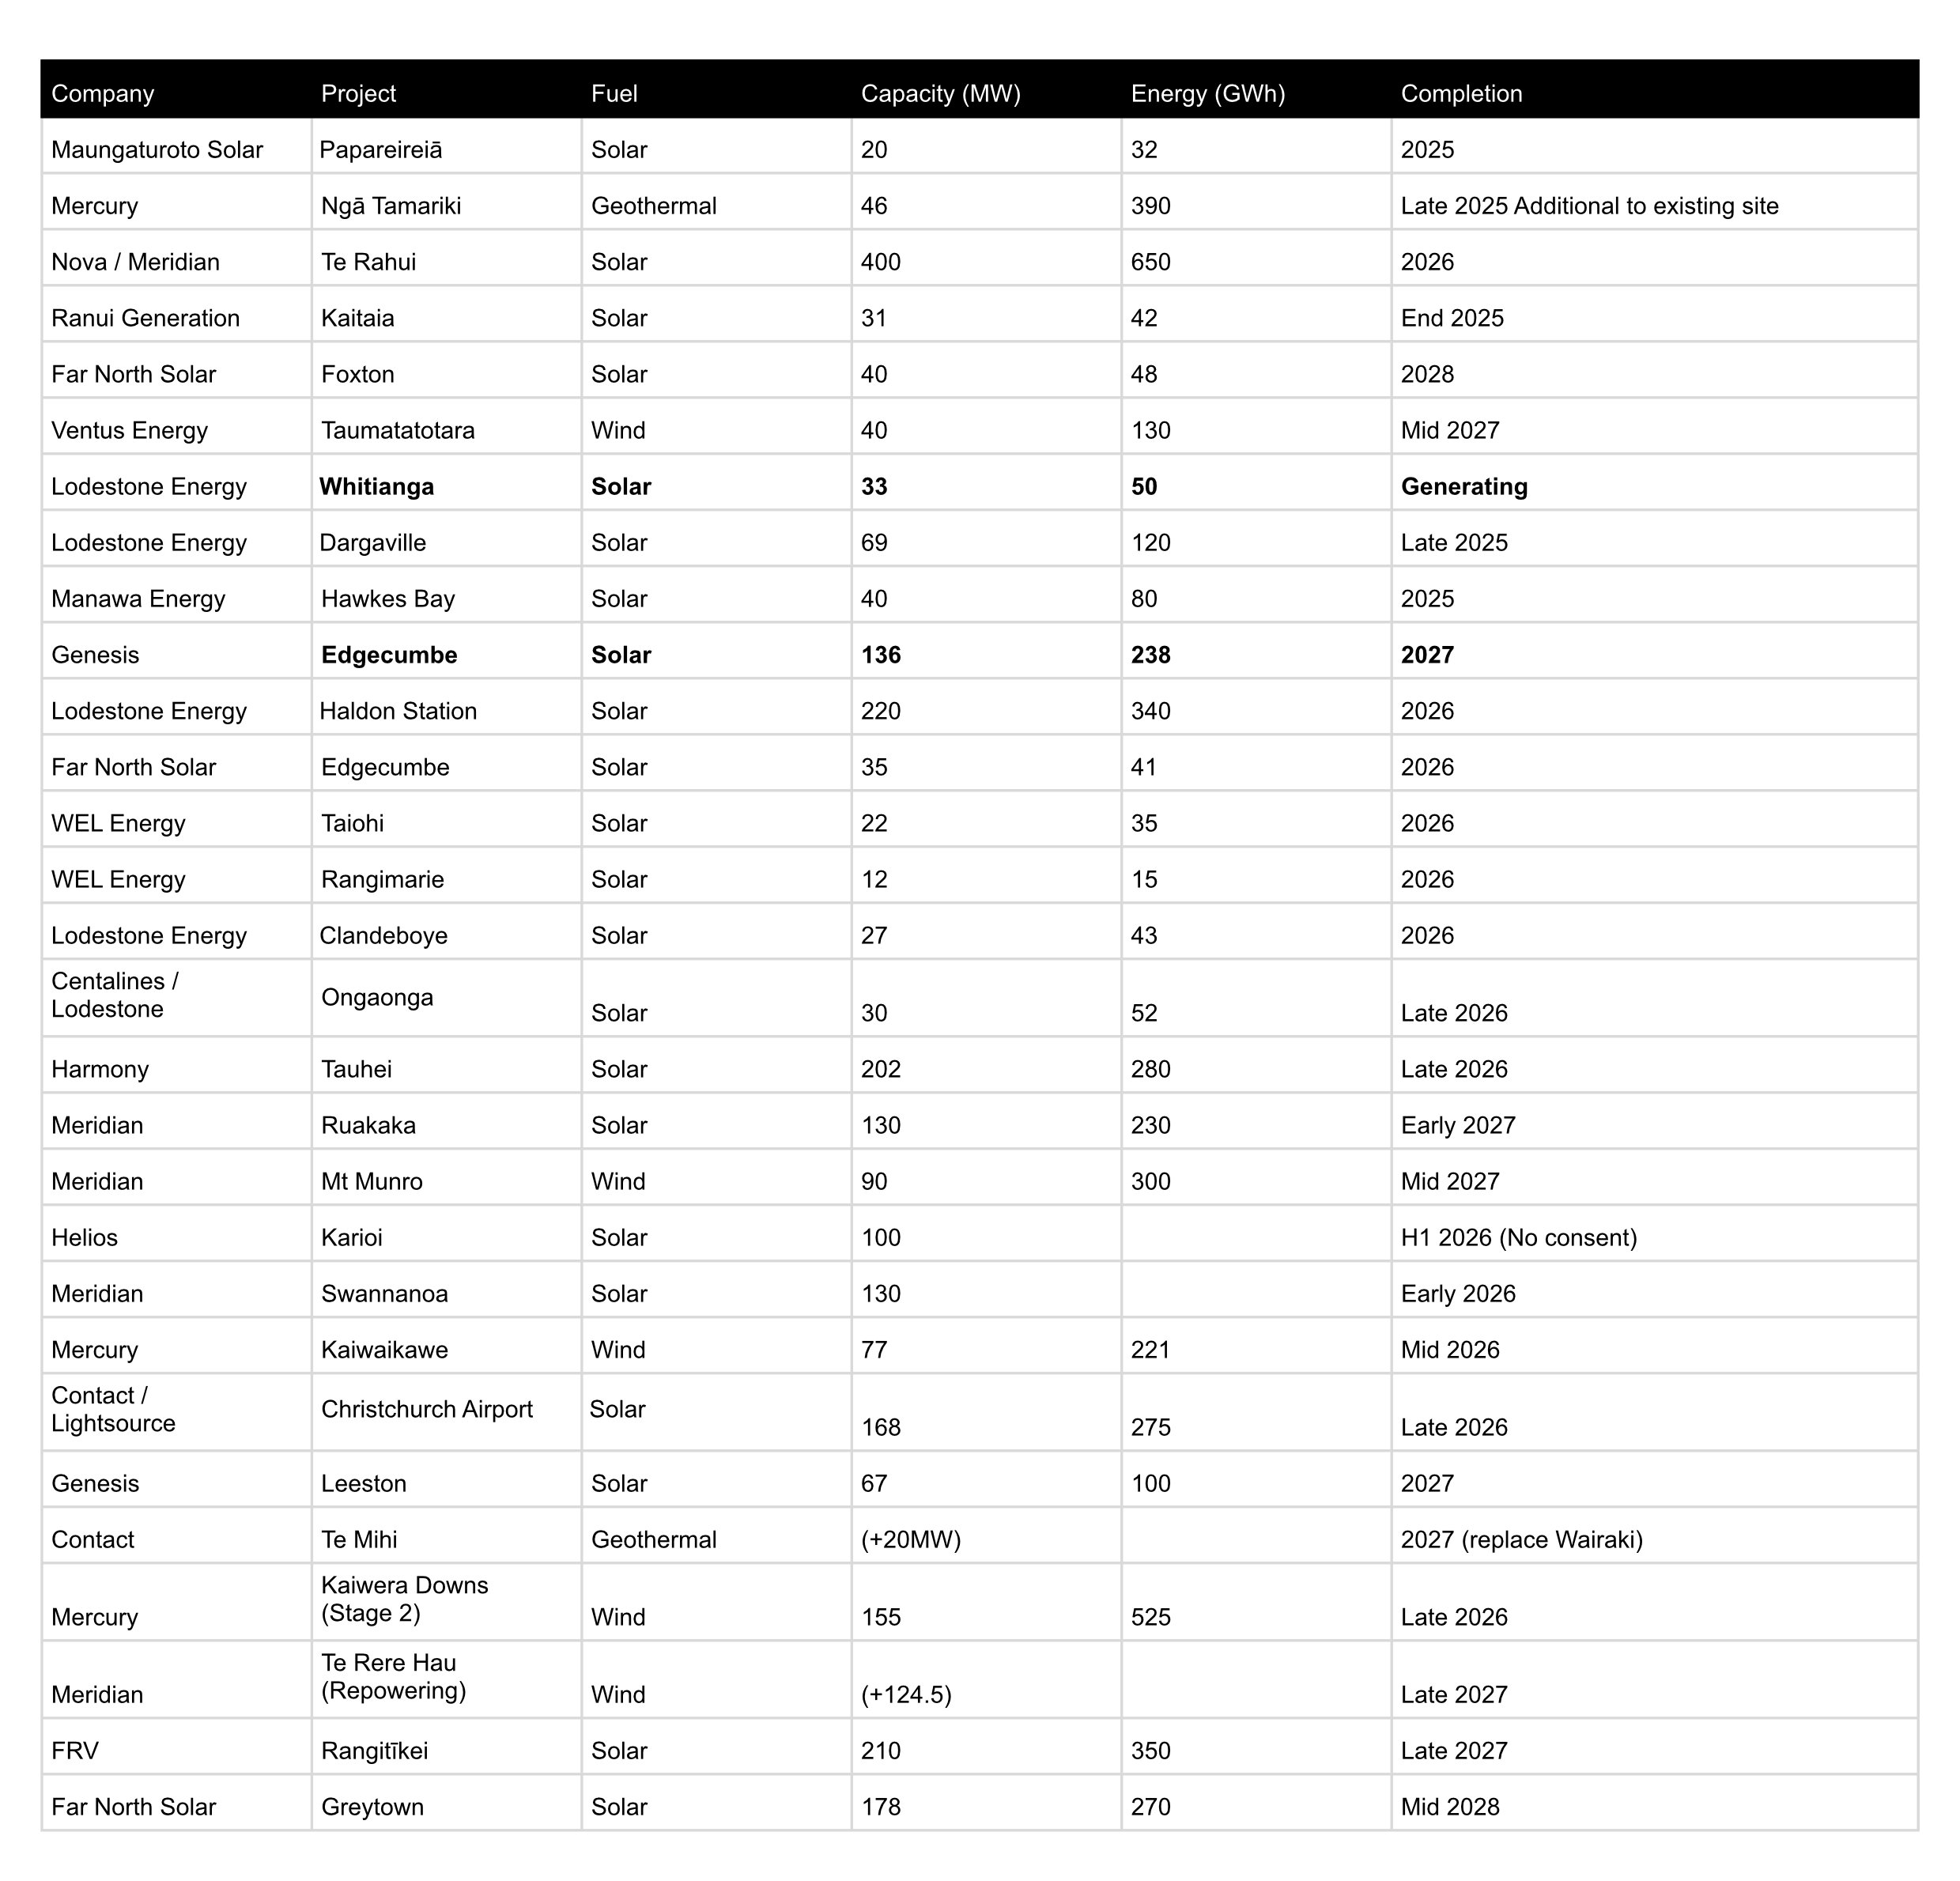
Known new generation projects are shown below (additions / removals / changes highlighted in bold).
Hydro Storage
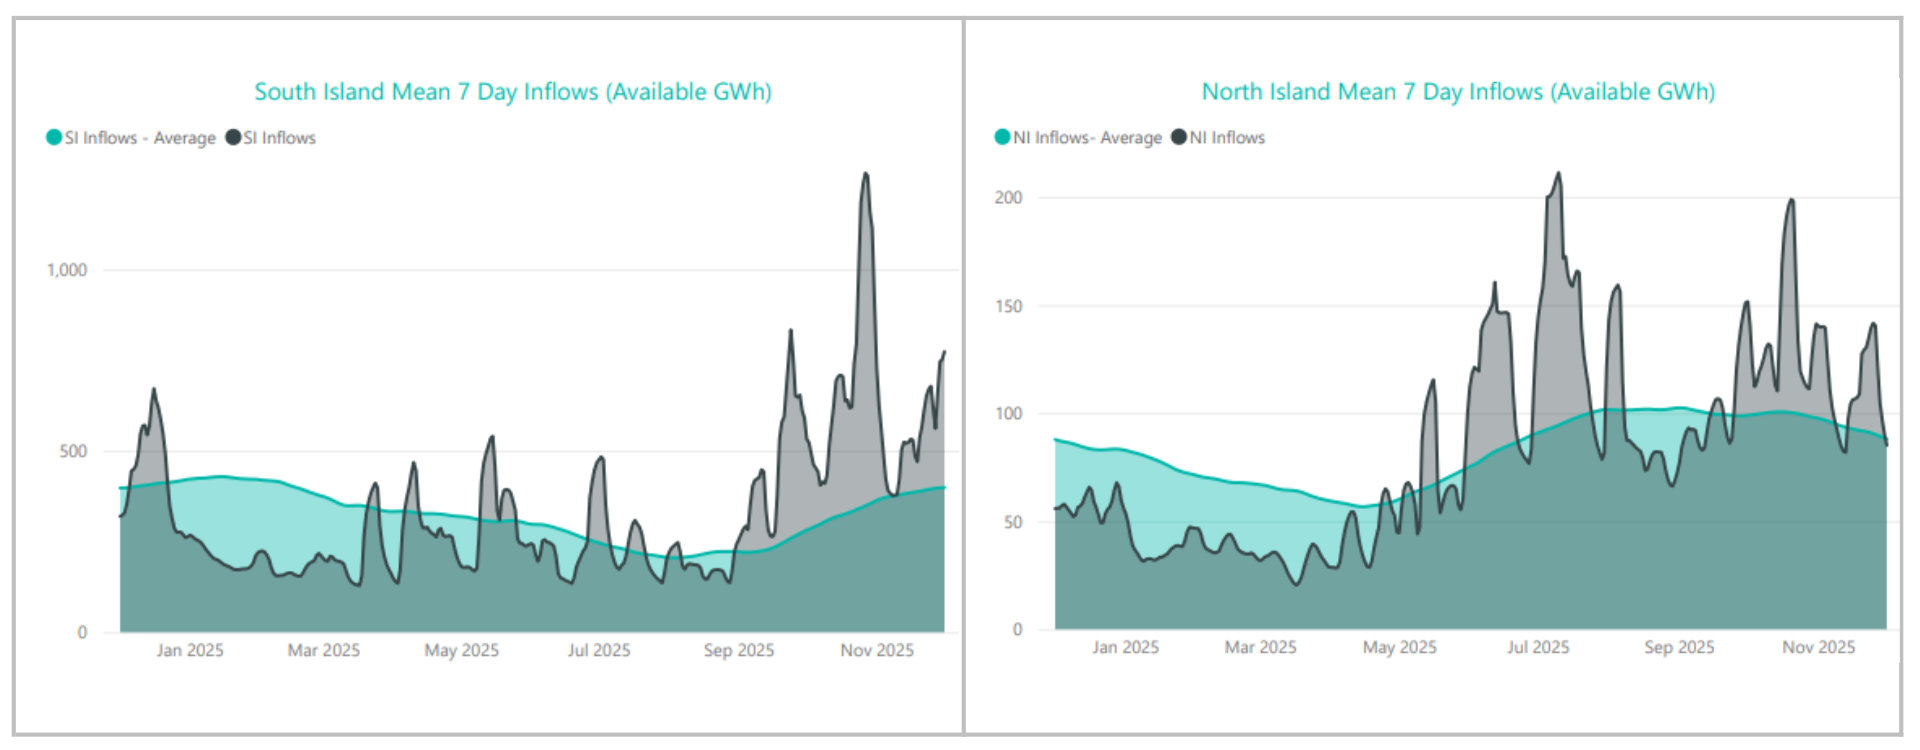
Inflows were well above average in both islands again last month as shown below.
The continued high inflows resulted in storage continuing to increase rapidly through November. Energy storage levels increased 479GWh through the month to end at 4,474GWh (101.4% full). Storage is well above the average level seen at this time of year. The following chart shows the latest breakdown of storage across the main hydro catchments.

Security of supply risks decreased through November with storage levels increasing as shown below.

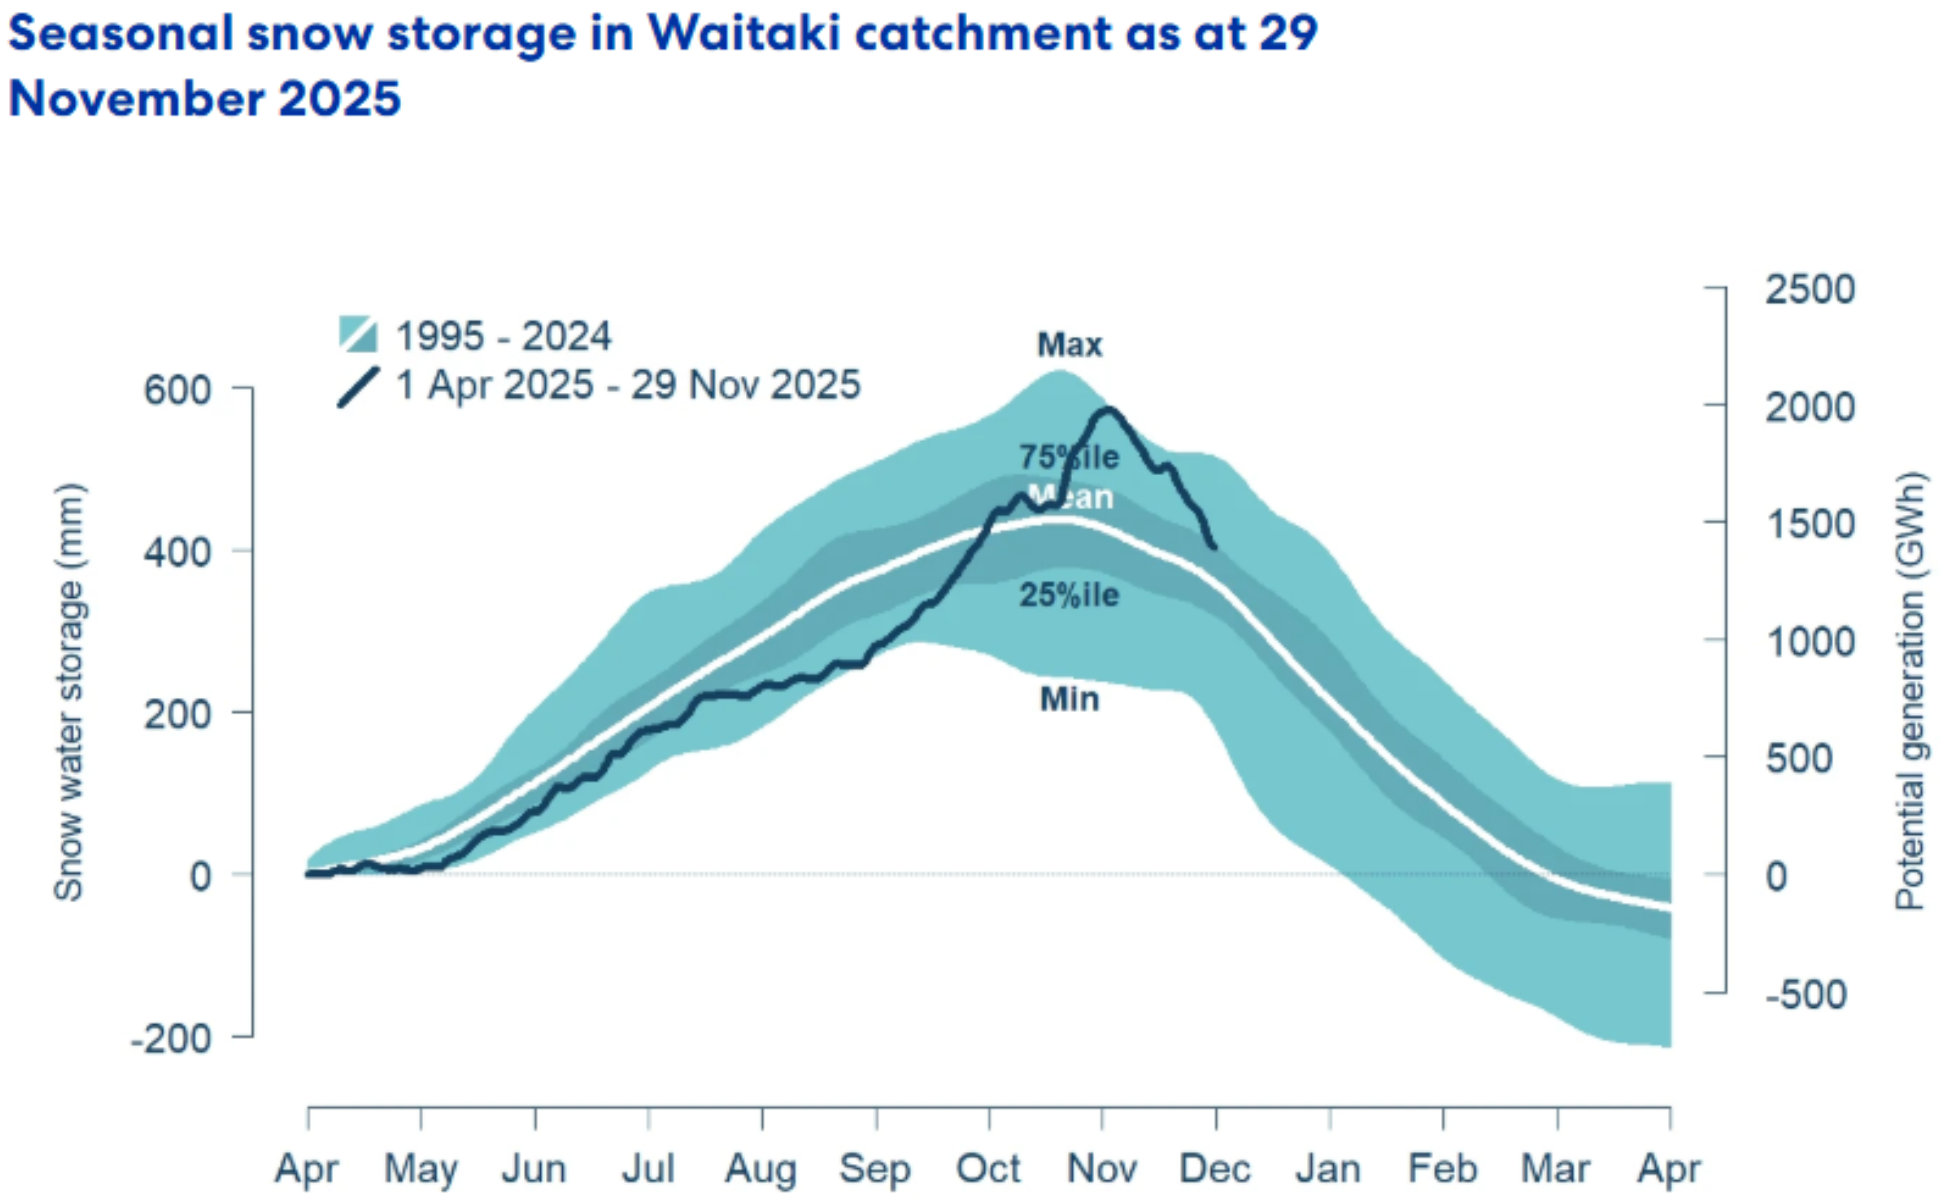
Snowpack
Snowpack is an important way that hydro energy is stored over the winter months and released as hydro inflows in the spring. The following graph shows that the snowpack in the important Waitaki catchment decreased during November and is now at the 75th percentile level seen in the last 30 years for this time of year.
Climate outlook overview September - November 2025 (from NIWA)
- Moderate La Niña conditions are currently present in the tropical Pacific.
- Both the Southern Oscillation Index (SOI) and the Relative Oceanic Niño Index (RONI) remained above La Niña thresholds during November, consistent with a persistent La Niña signal.
- However, a rapid weakening of La Niña conditions is expected over summer, with about a 50% chance for ENSO-neutral (El Niño – Southern Oscillation) conditions to return by late summer.
- The unsettled conditions that characterised the end of November will continue into the first week of December, with waves of low pressure dominating. A mixed pattern will follow this, but with high pressure becoming an increasingly common occurrence as the month progresses. These anticyclones should most likely occur near the North Island, though may occasionally extend over the South Island.
- This tendency towards a steadily increasing presence of high pressure makes regional dryness a concern from mid-December and into January, especially as it combines with high sun angles at this time of year.
- The final month of summer may transition to high pressure systems frequently sitting further south than normal (over the lower South Island, or the Southern Ocean), bringing an easterly wind anomaly and increased humidity over large parts of the country. This pressure pattern may allow occasional rainmakers in from the north.
- Especially later in summer, the combination of continuing marine heatwaves and La Niña-like weather patterns will increase the risk of significant heavy rain events from the tropics or sub-tropics – primarily for the North Island.
- The Tropical Cyclone Outlook for the November 2025 – April 2026 southwest Pacific Tropical Cyclone (TC) season indicates a normal or elevated risk for ex-TC interaction for New Zealand.
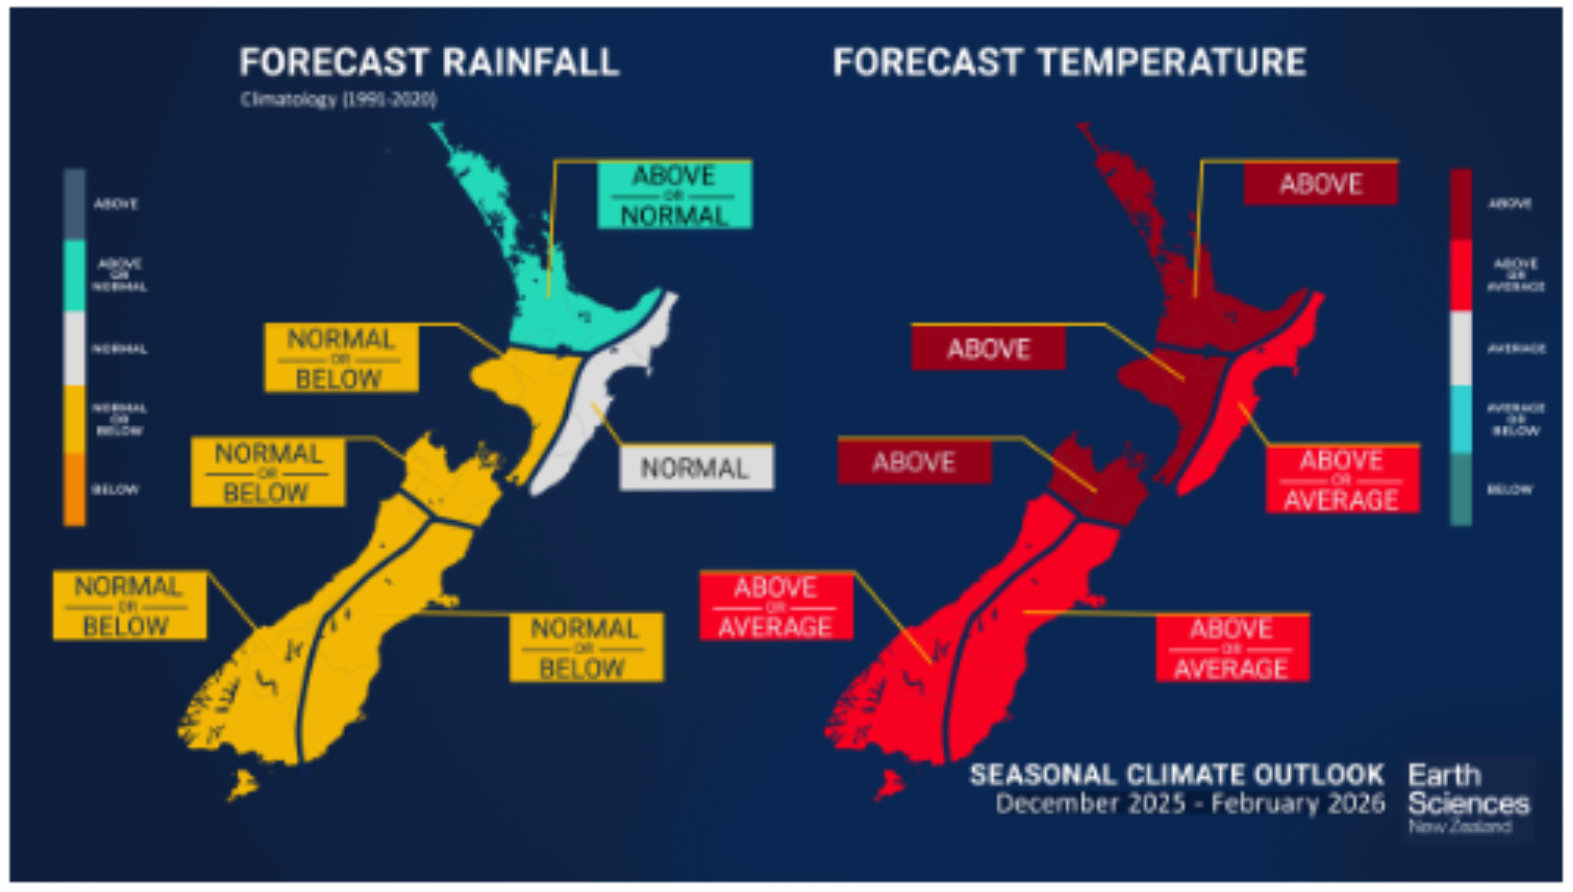
- Seasonal air temperatures are very likely to be above average for the north of the North Island, and most likely to be above average for the west of the North Island and north of the South Island. All other regions of New Zealand have about equal chances for near average or above average summer temperatures.
- December – February rainfall totals are about equally likely to be normal or below normal for most of the country, except for the north of the North Island where normal or above average rainfall is favoured, and for the east of the North Island where rainfall is most likely to be near normal. In this latter region, the tercile distribution (or probability of other outcomes) is particularly uncertain, reflecting both the geography of the region and the transition to a potentially wetter pattern later in summer.
- During December 2025 – February 2026, soil moisture levels and river flows are forecast to be below normal for the east of the North Island, and near or below normal for the north of the North Island and east of the South Island. Near normal soil moisture levels and river flows are forecast for the west and north of the South Island. For the west of the North Island, below normal or near normal soil moisture levels are forecast, while river flows are most likely to be near normal.
- Ocean waters around New Zealand warmed significantly during November 2025, particularly around the North Island. Marine heatwave (MHW) conditions - defined as sea surface temperatures (SSTs) exceeding the climatological 90th percentile for at least five consecutive days - returned across most coastal waters, as well as large offshore areas near the North Island and west of the South Island. In some locations, ‘extreme’ MHW conditions are occurring, with SSTs exceeding four times the 90th percentile threshold. Global forecast models indicate that ocean temperatures around New Zealand are likely to remain warmer than average over the summer period, which is expected to have an upward influence on seasonal air temperatures.
The Wholesale Gas Market
Spot gas prices dropped again through November. Prices for the month averaged $11.25/GJ – a 9% decrease compared to October. Average prices remained 33% above what they were at the same time last year. Note that spot gas prices include the cost of carbon (currently around $2/GJ)

On the supply side McKee / Mangahewa had a big increase in production while Pohokura had a significant fall and other fields maintained output. McKee / Mangahewa jumped from around 65TJ/day at the start of the month up to nearly 90TJ/day at the end of November. Pokokura had a step change down from 40TJ/day to 30TJ/day at the beginning of the month. Maui maintained output at approx.. 40TJ/day while Turangi and Kowhai also held output averaging just under 50TJ/day.
The following graph shows production levels from major fields over the last 7 years.

Increased gas supply allowed Huntly to switch away from coal – averaging 14TJ/day gas usage. Methanex maintained the higher usage from last month – averaging 71TJ/day through November.
The following graph shows trends in the major gas users over the last 7 years.

Gas storage is becoming increasingly important as falling production coincides with more variable demand particularly from gas fired electricity generation. The following chart shows how storage at Ahuroa increased again through November. It is now close to average levels seen at this time of year over the last few years.

Internationally, LNG netback prices ended the month at $14.64/GJ – up 1.5% from last month. Forecast prices for 2025 were steady at $16.88/GJ. Forward prices for 2026 were down 5% at $13.14/GJ. (Note that netback prices are indicative of international prices – they are produced by the ACCC and quoted in Australian dollars. They are net of the estimated costs to convert from pipeline gas in Australia to LNG, hence the term “netback”)
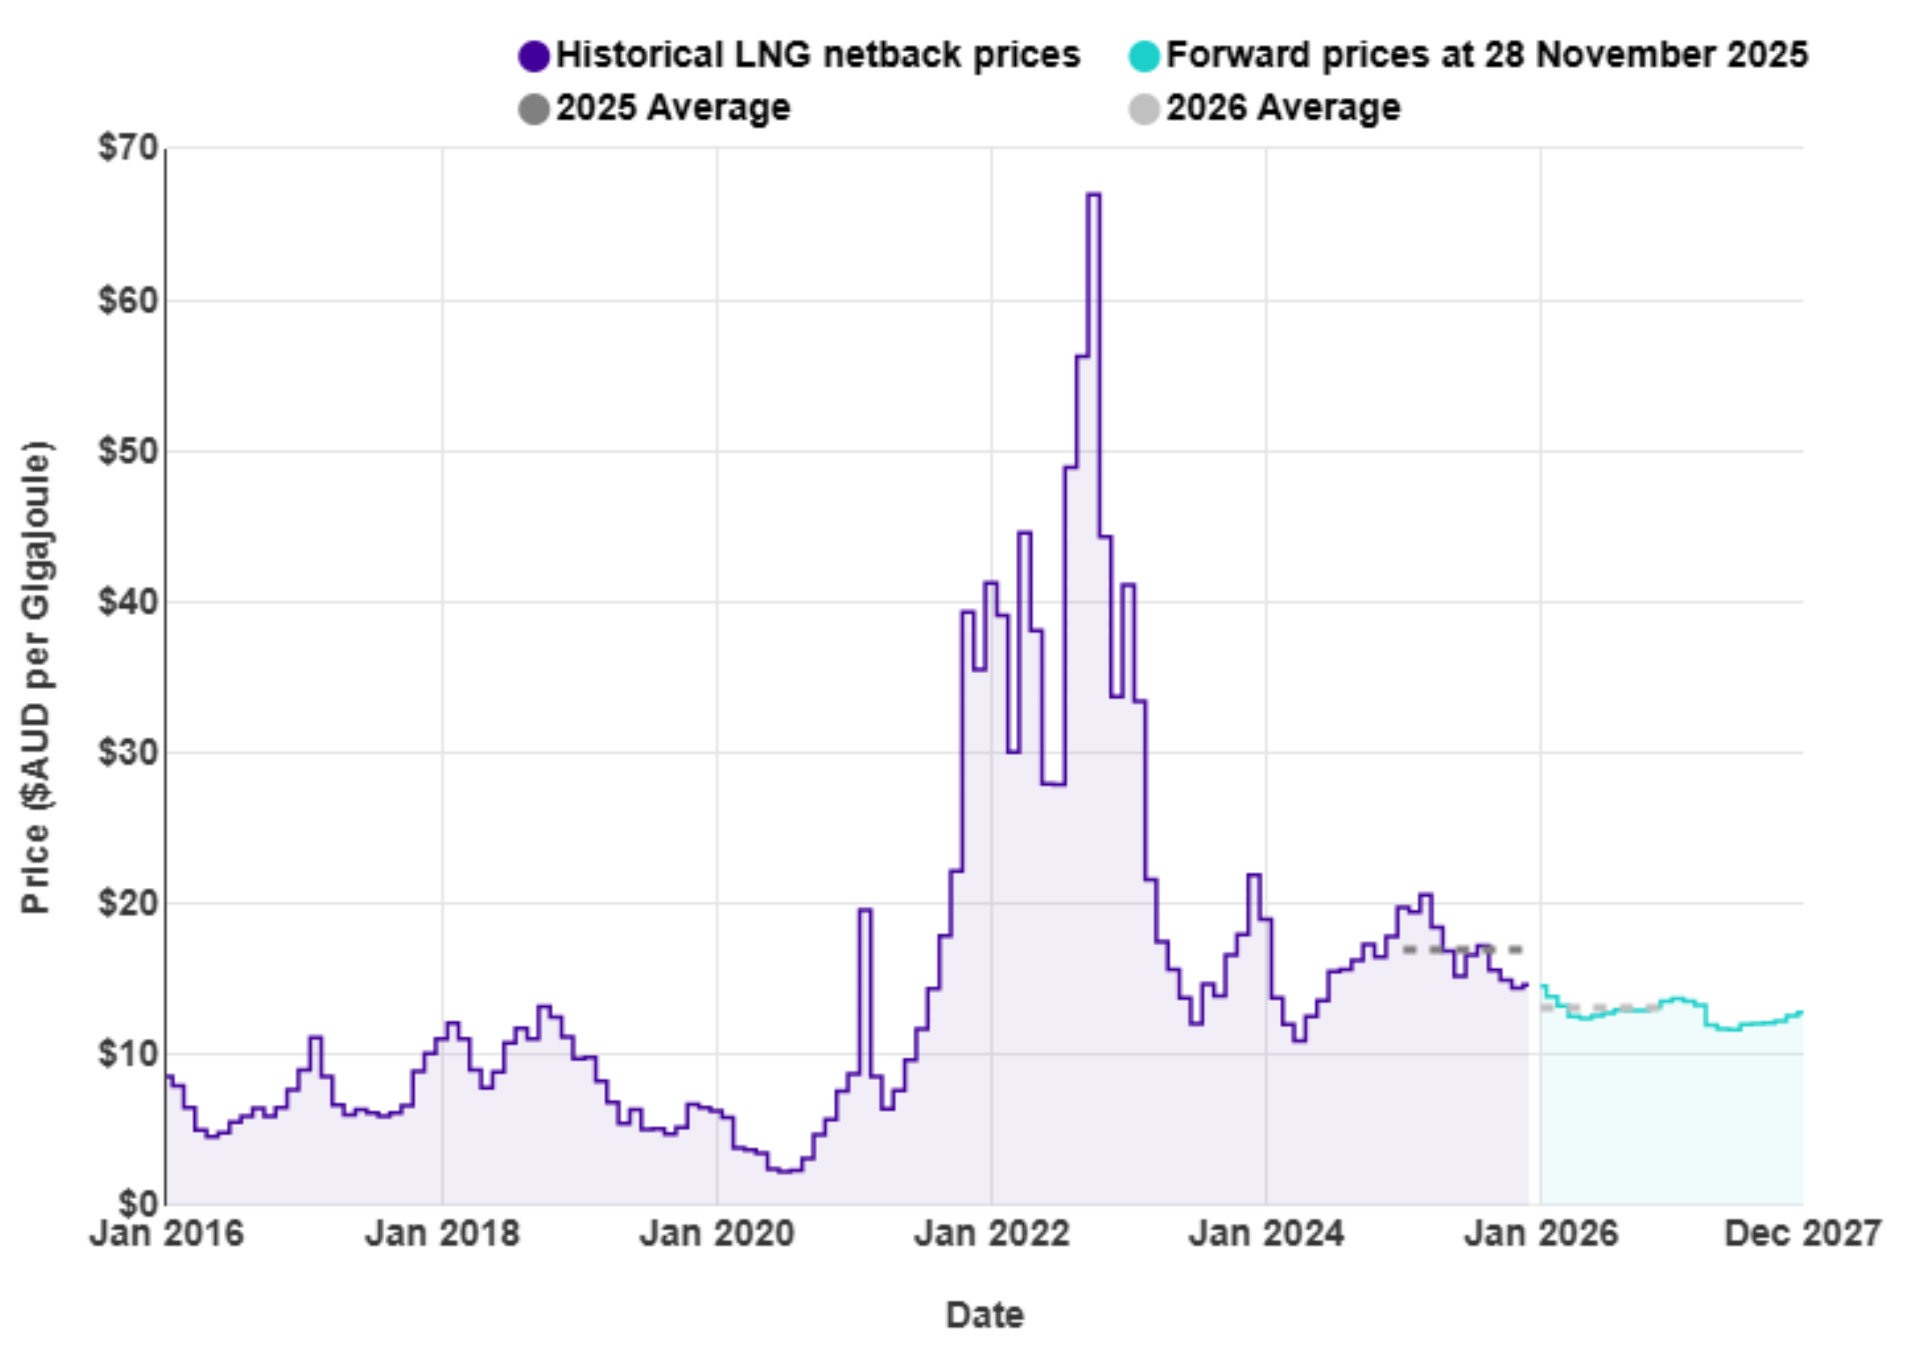
New Zealand does not (yet) have an LNG export/import market, so our domestic prices are not directly linked to global prices.
LPG is an important fuel for many large energy users, particularly in areas where reticulated natural gas is not available. The contract price of LPG is typically set by international benchmarks such as the Saudi Aramco LPG – normally quoted in US$ per metric tonne.
The following graph shows the Saudi Aramco LPG pricing for the last 5 years as well as forecast pricing for the year ahead. Futures pricing were up slightly over the last month but remain trending down through 2026.

The other main contributing factor to LPG prices in New Zealand is the exchange rate against the USD. The exchange rate fell through the first of the month reaching as low as 0.56 before climbing closing at 0.575. This remains near the lowest levels seen in recent years. This would tend to push up LPG prices when quoted in NZD.

The Coal Market
The global energy crisis has been as much about coal as it has gas. The war in the Ukraine has driven energy prices, including coal, up. Prices in November were steady at around the $109 - $110 / tonne. These prices are finally returning to levels close to what we expect to see as shown in the following graph of prices over the last 10 years.
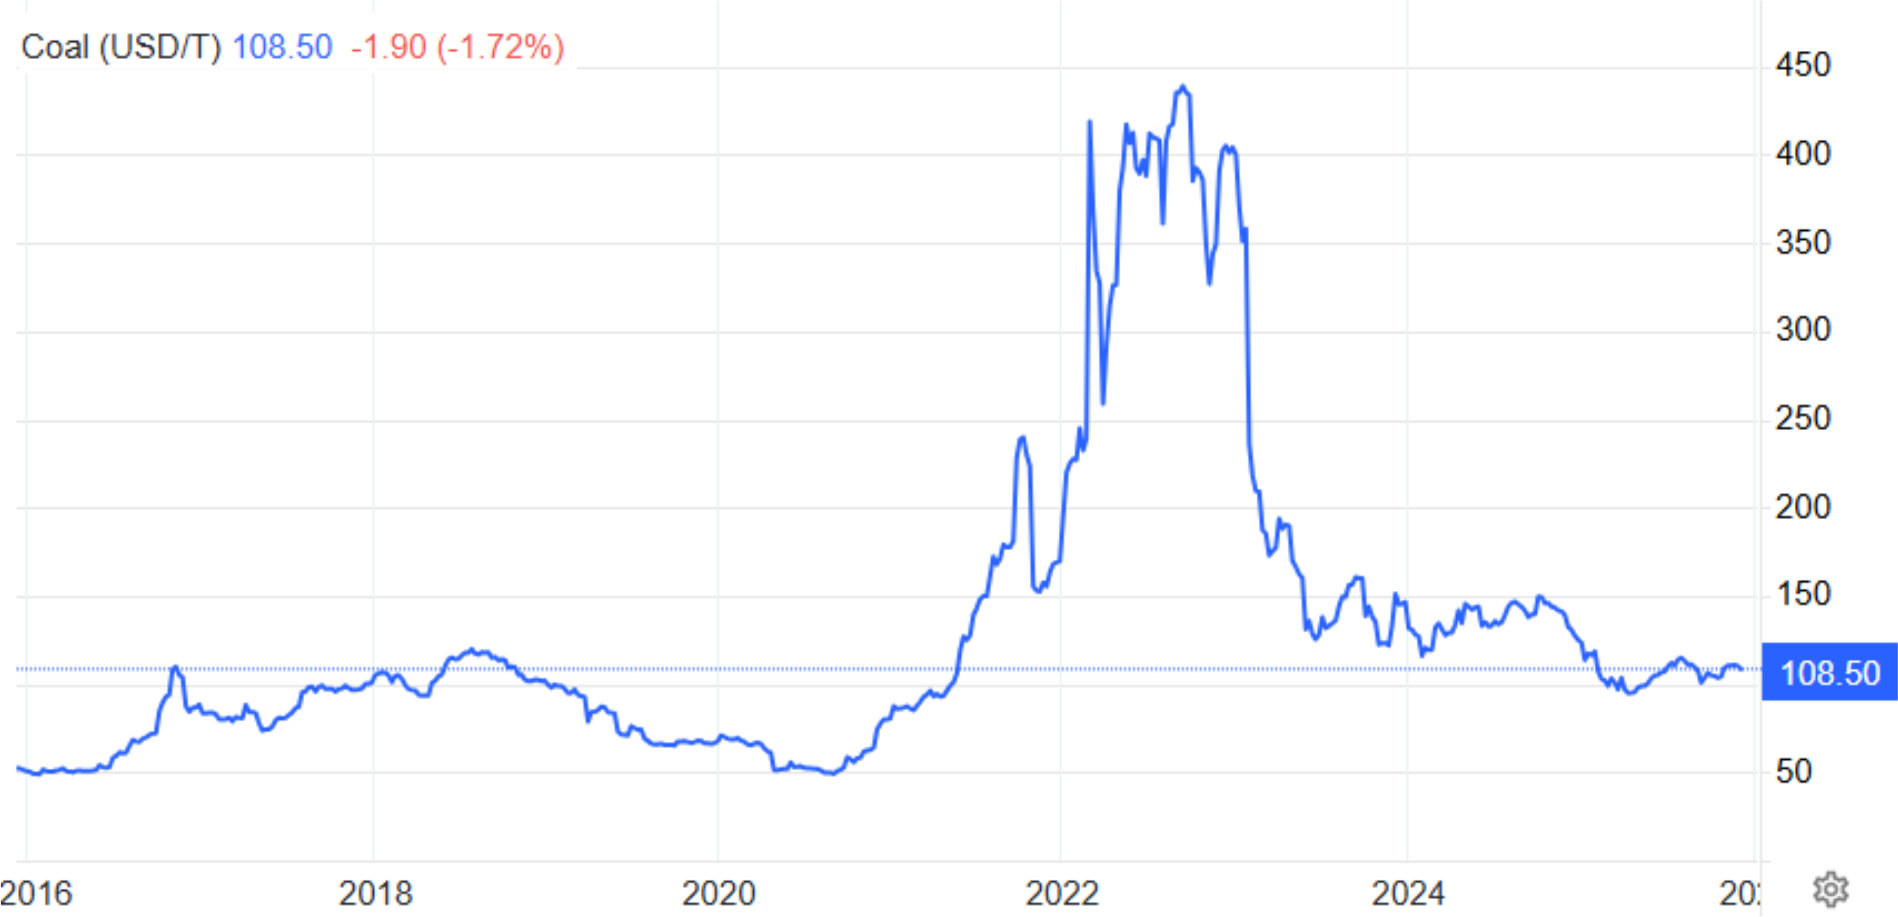
Like gas, the price of coal can flow through and have an impact on the electricity market.
Carbon Pricing
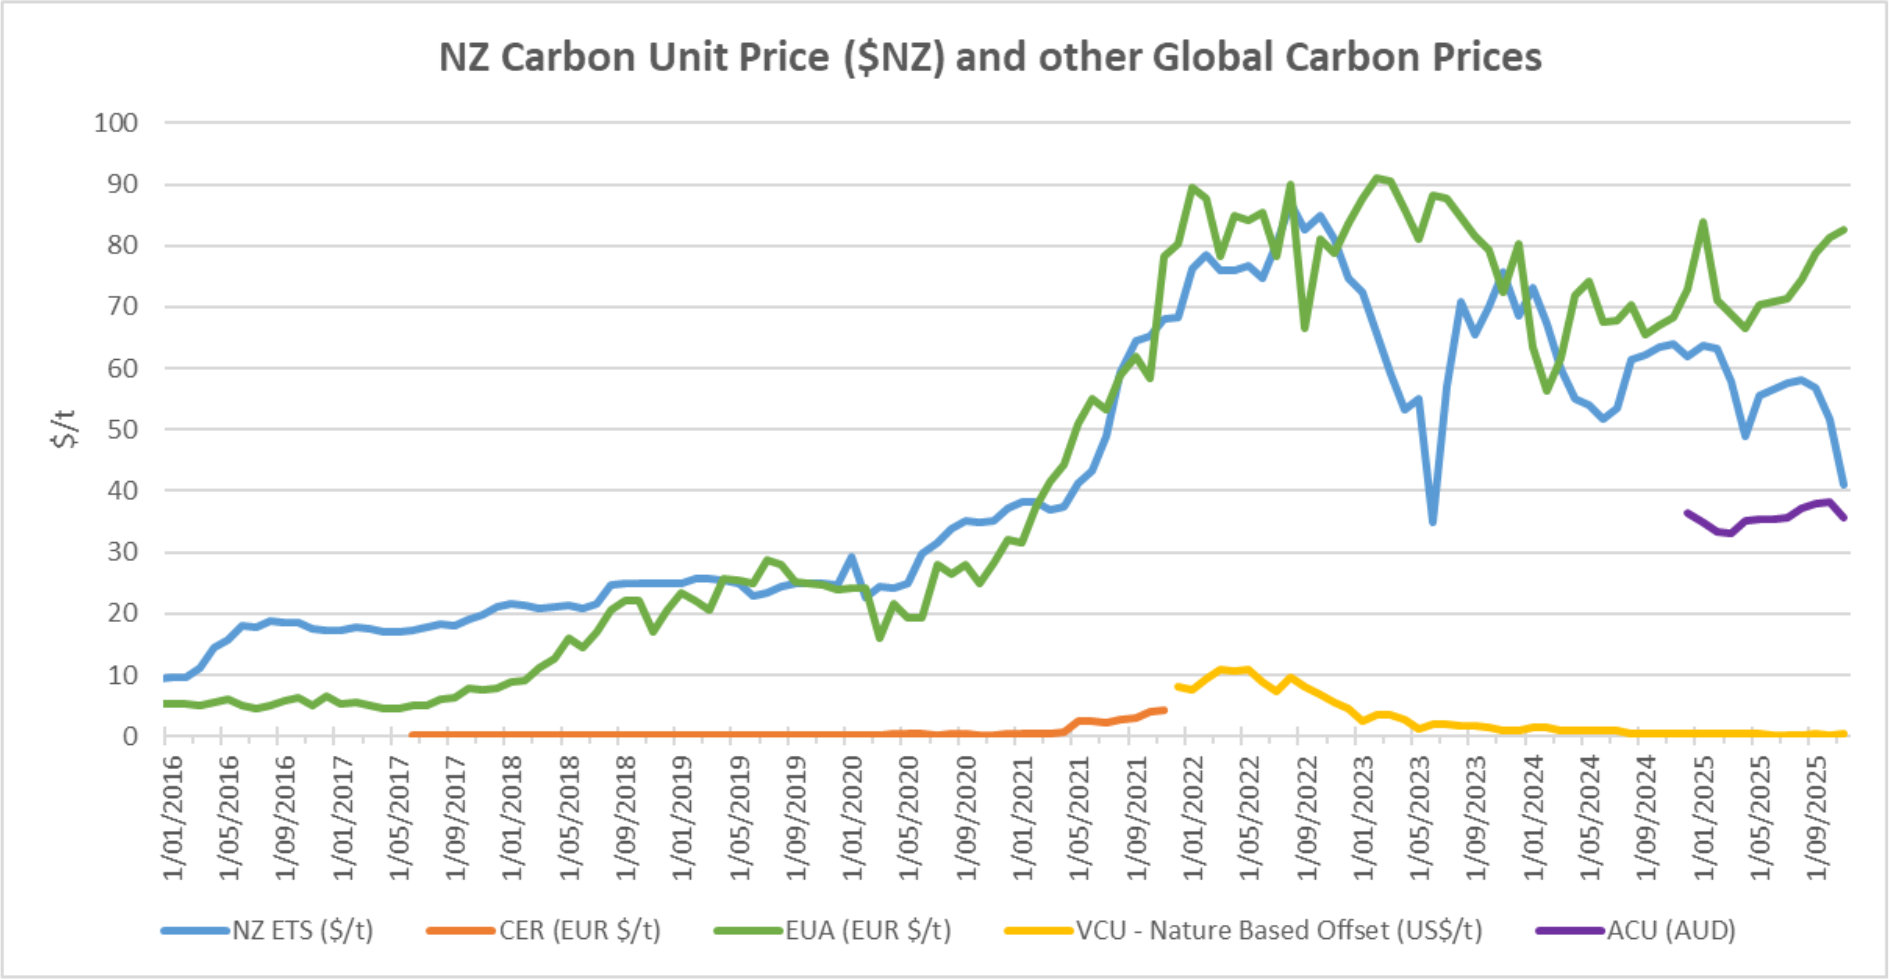
NZ has had an Emissions Trading Scheme (ETS) in place since 2008. It has been subsequently reviewed by several governments and is now an “uncapped” price scheme closely linked to international schemes. However, there are “upper and lower guard-rails” set up to prevent wild swings in carbon price that act as minimum and maximum prices. These increased in December 2023 to $173 and $64 respectively. Carbon prices decreased 21% in November to $41.
As the carbon price rises, the cost of coal, gas or other fossil fuels used in process heat applications will naturally also rise. Electricity prices are also affected by a rising carbon price. Electricity prices are set by the marginal producing unit – in NZ this is currently typically coal or gas or hydro generators, with the latter valuing the cost of its water against the former. An increase in carbon price can lead to an increase in electricity prices in the short to medium term (as the marginal units set the price). A carbon price of $50/t is estimated to currently add about $25/MWh (or ~2.5c/kWh) to electricity prices. In the long term the impact should reduce as money is invested in more low-cost renewables and there is less reliance on gas and coal fired generation.
EU Carbon units increased in October to 82.5 Euro/tonne – up 1%. Australian Carbon Units fell 7% to AUD$35.7
About this Report:
This energy market summary report provides information on wholesale price trends within the NZ Electricity Market. Please note that all electricity prices are presented as a $ per MWh price and all carbon prices as a $ per unit price. All spot prices are published by the Electricity Authority. Futures contract prices are sourced from ASX.
Further information can be found at the locations noted below.
- Transpower publishes a range of detailed information, which can be found here: https://www.transpower.co.nz/power-system-live-data
- The Electricity Authority publishes a range of detailed information, which can be found here: https://www.emi.ea.govt.nz/
- Weather and Climate data – The MetService publishes a range of weather-related information, which can be found here: https://www.metservice.com/
Disclaimer: This document has been prepared for informational and explanatory purposes only and is not intended to be relied upon by any person. This document does not form part of any existing or future contract or agreement between us. We make no representation, assurance, or guarantee as to the accuracy of the information provided. To the maximum extent permitted by law, none of Smart Power Ltd, its related companies, directors, employees or agents accepts any liability for any loss arising from the use of this document or its contents or otherwise arising out of or in connection with it. You must not provide this document or any information contained in it to any third party without our prior consent.
About Smart Power:
Smart Power is a full-service Energy Management consultancy. Apart from Energy Procurement, Smart Power can also provide:
- Technical advice on how to reduce your energy use & emissions
- Sustainability Reporting
- Invoice Management Services
We also offer boutique energy and water billing services for landlords/property developers.
Contact us here or call one of our offices to talk to our experienced staff about how we can assist you with achieving your energy goals.
© Copyright, 2025. Smart Power Ltd


