

The Wholesale Electricity Market
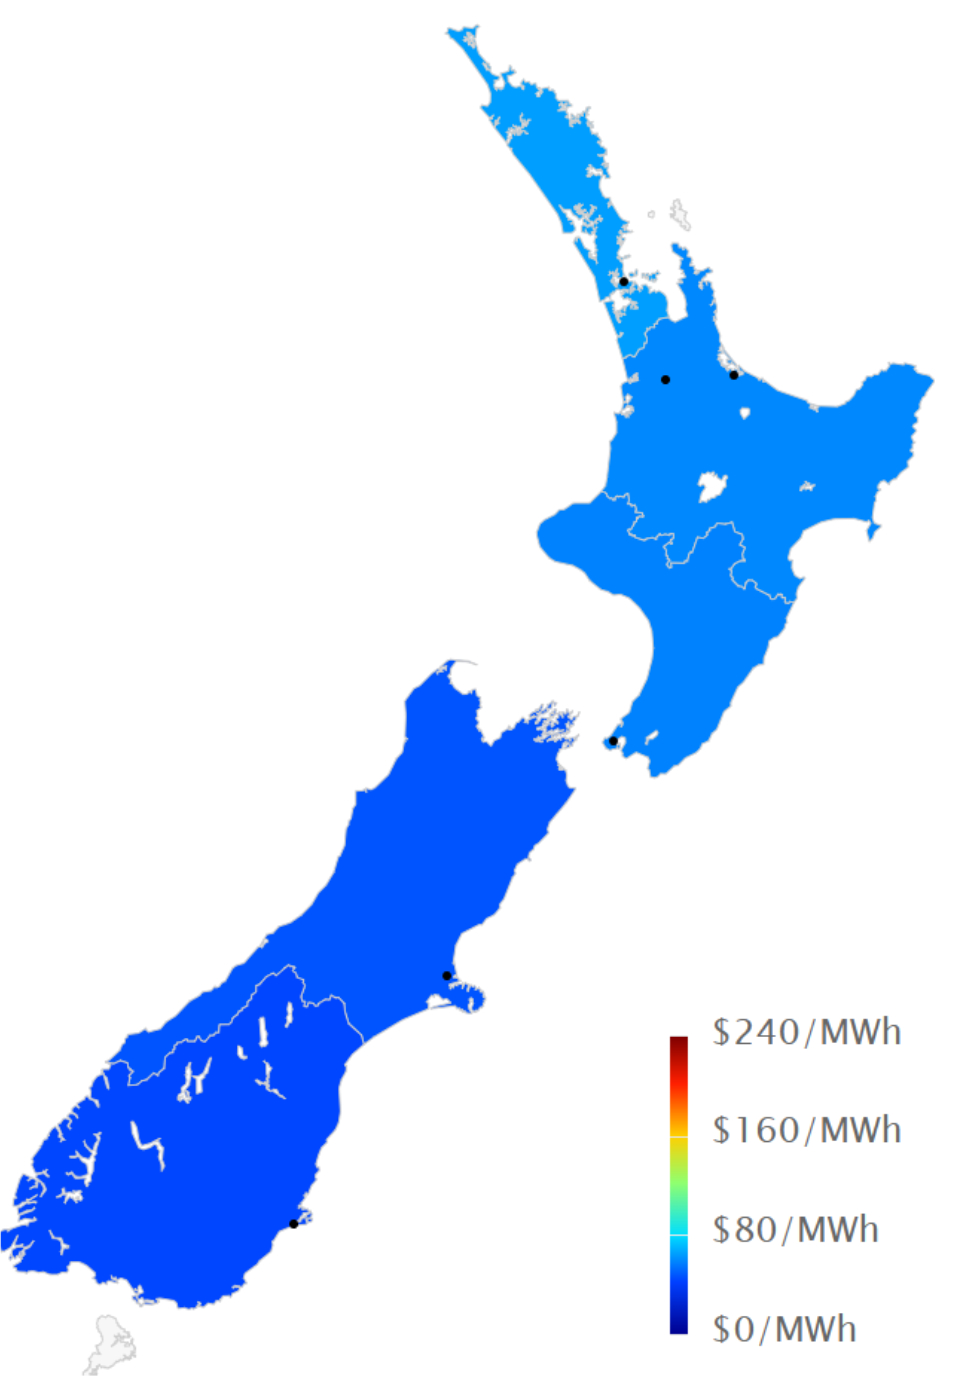
Spot prices in the wholesale electricity market increased in July. Average spot prices for the month ranged from $43.5 in the lower South Island (up from $35.5 in June), up to $64.5 in the upper North Island ($41.5 in June).
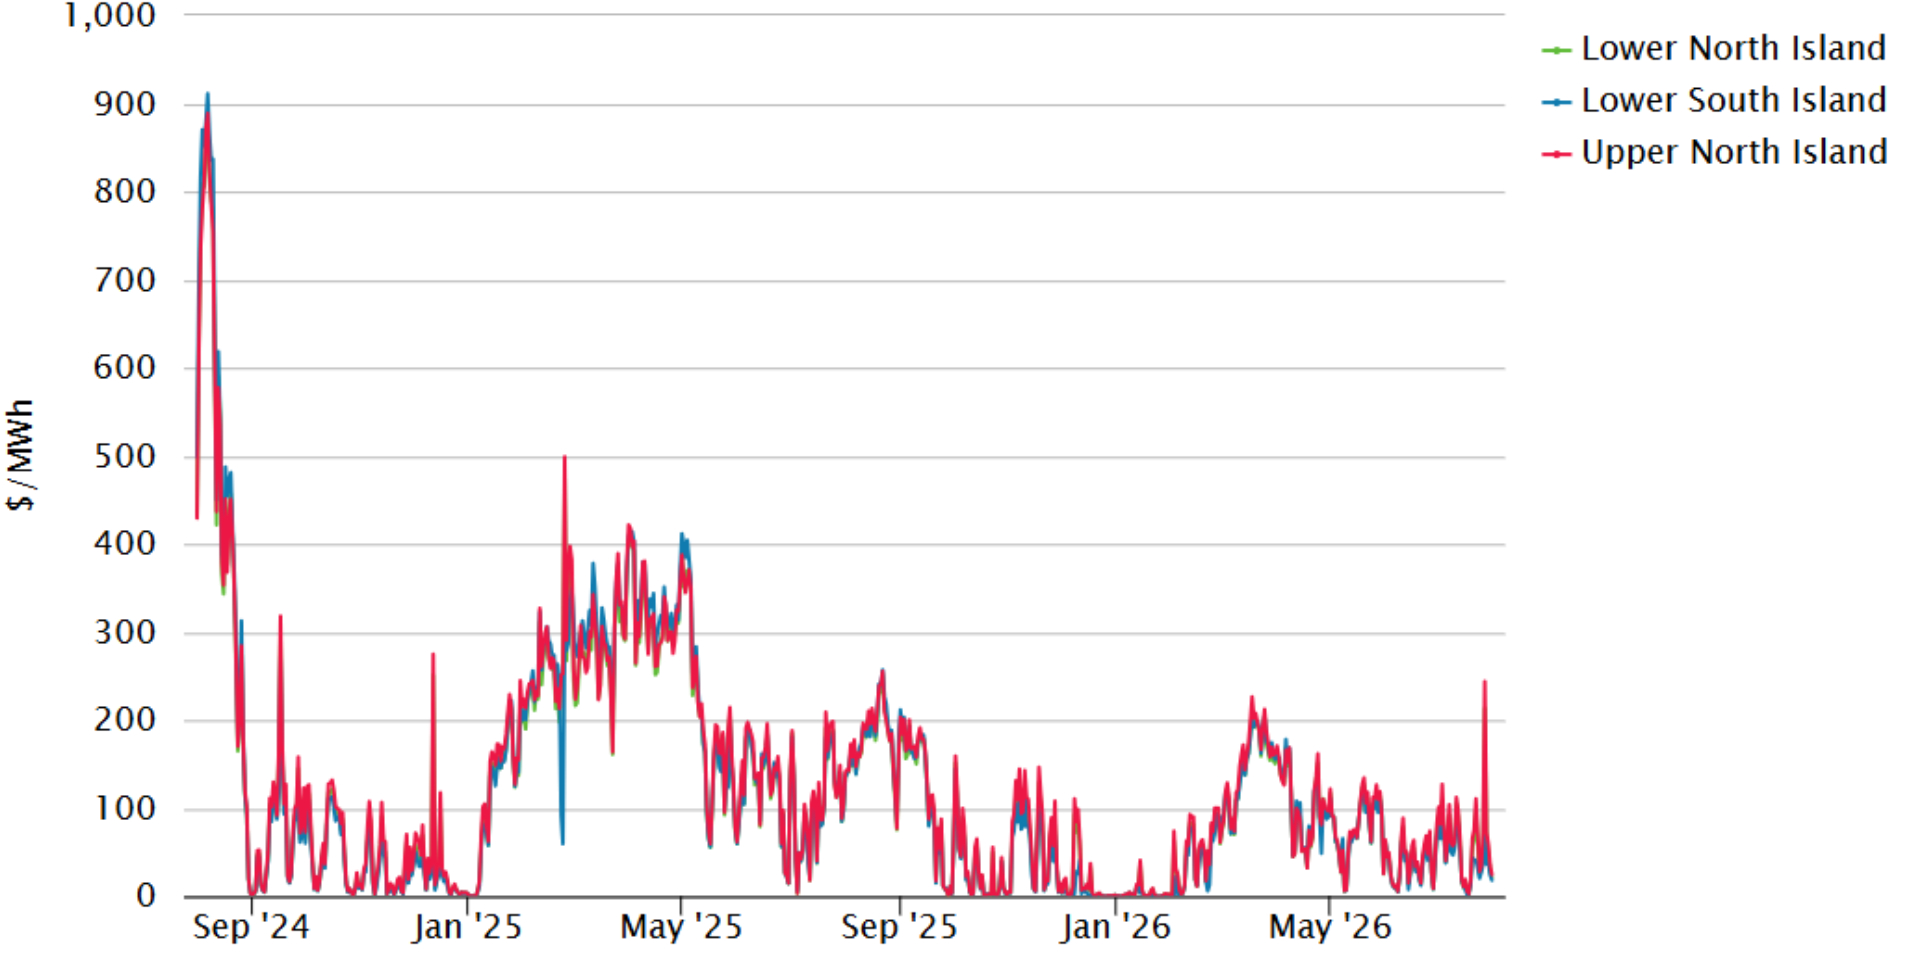
The following chart shows average weekly spot prices over the last 2 years. Recent low prices over the last few months can be seen along with a brief blip of high upper NI prices in the last month.
Electricity Demand
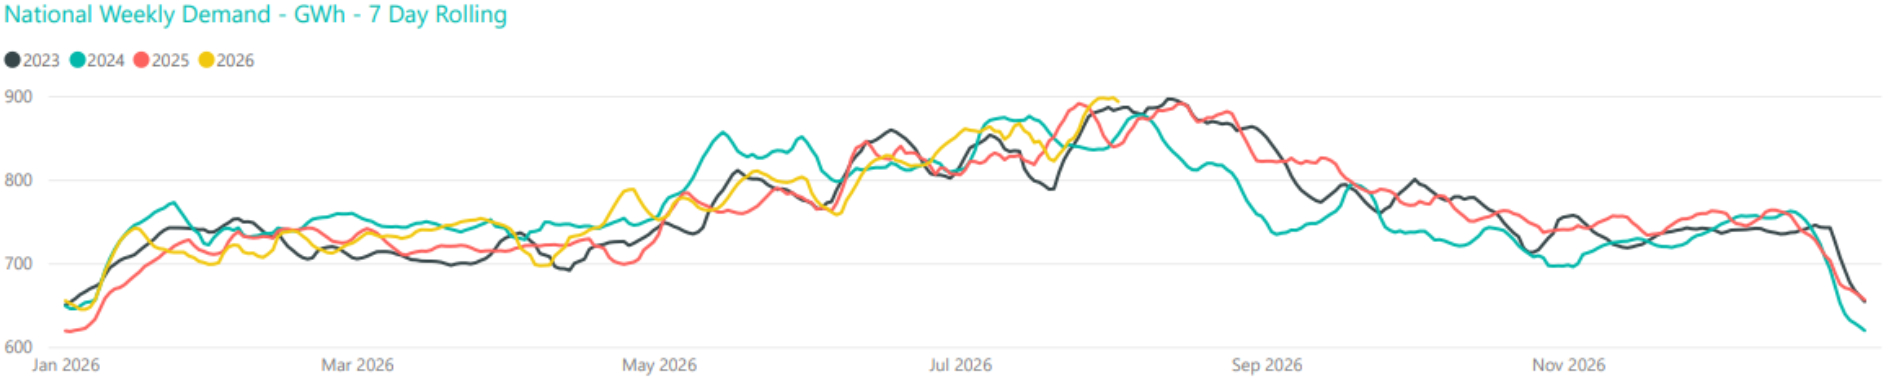
Demand in July was close to the average levels seen in the last few years apart from the end of the month when demand rose with some colder weather across the country.
Electricity Generation Mix
Hydro generation increased during the month with increased demand and good hydro storage levels. This along with good levels of wind generation meant that thermal generation was minimal.

HVDC Transfer
Power transfers on the HVDC link connecting the North and South Islands are important both in showing relative hydro positions and the reliance on thermal power to meet demand. High northward flow tends to indicate a good SI hydro position, whereas the reverse indicates a heavy reliance on thermal power to make up for hydro shortages.
Northward transfer increased as the month went by to meet strong NI demand. There was minimal southward transfer all month.

The Electricity Futures Market
The Futures Market provides an indication of where market participants see the spot market moving in the future. They are based on actual trades between participants looking to hedge their positions (as both buyers and sellers) into the future against potential spot market volatility. They are also a useful proxy for the direction of retail contracts.
The following graph shows Futures pricing for CY 2025, 2026, 2027, 2028 and 2029 at Otahuhu (Auckland) for the last 5 years.
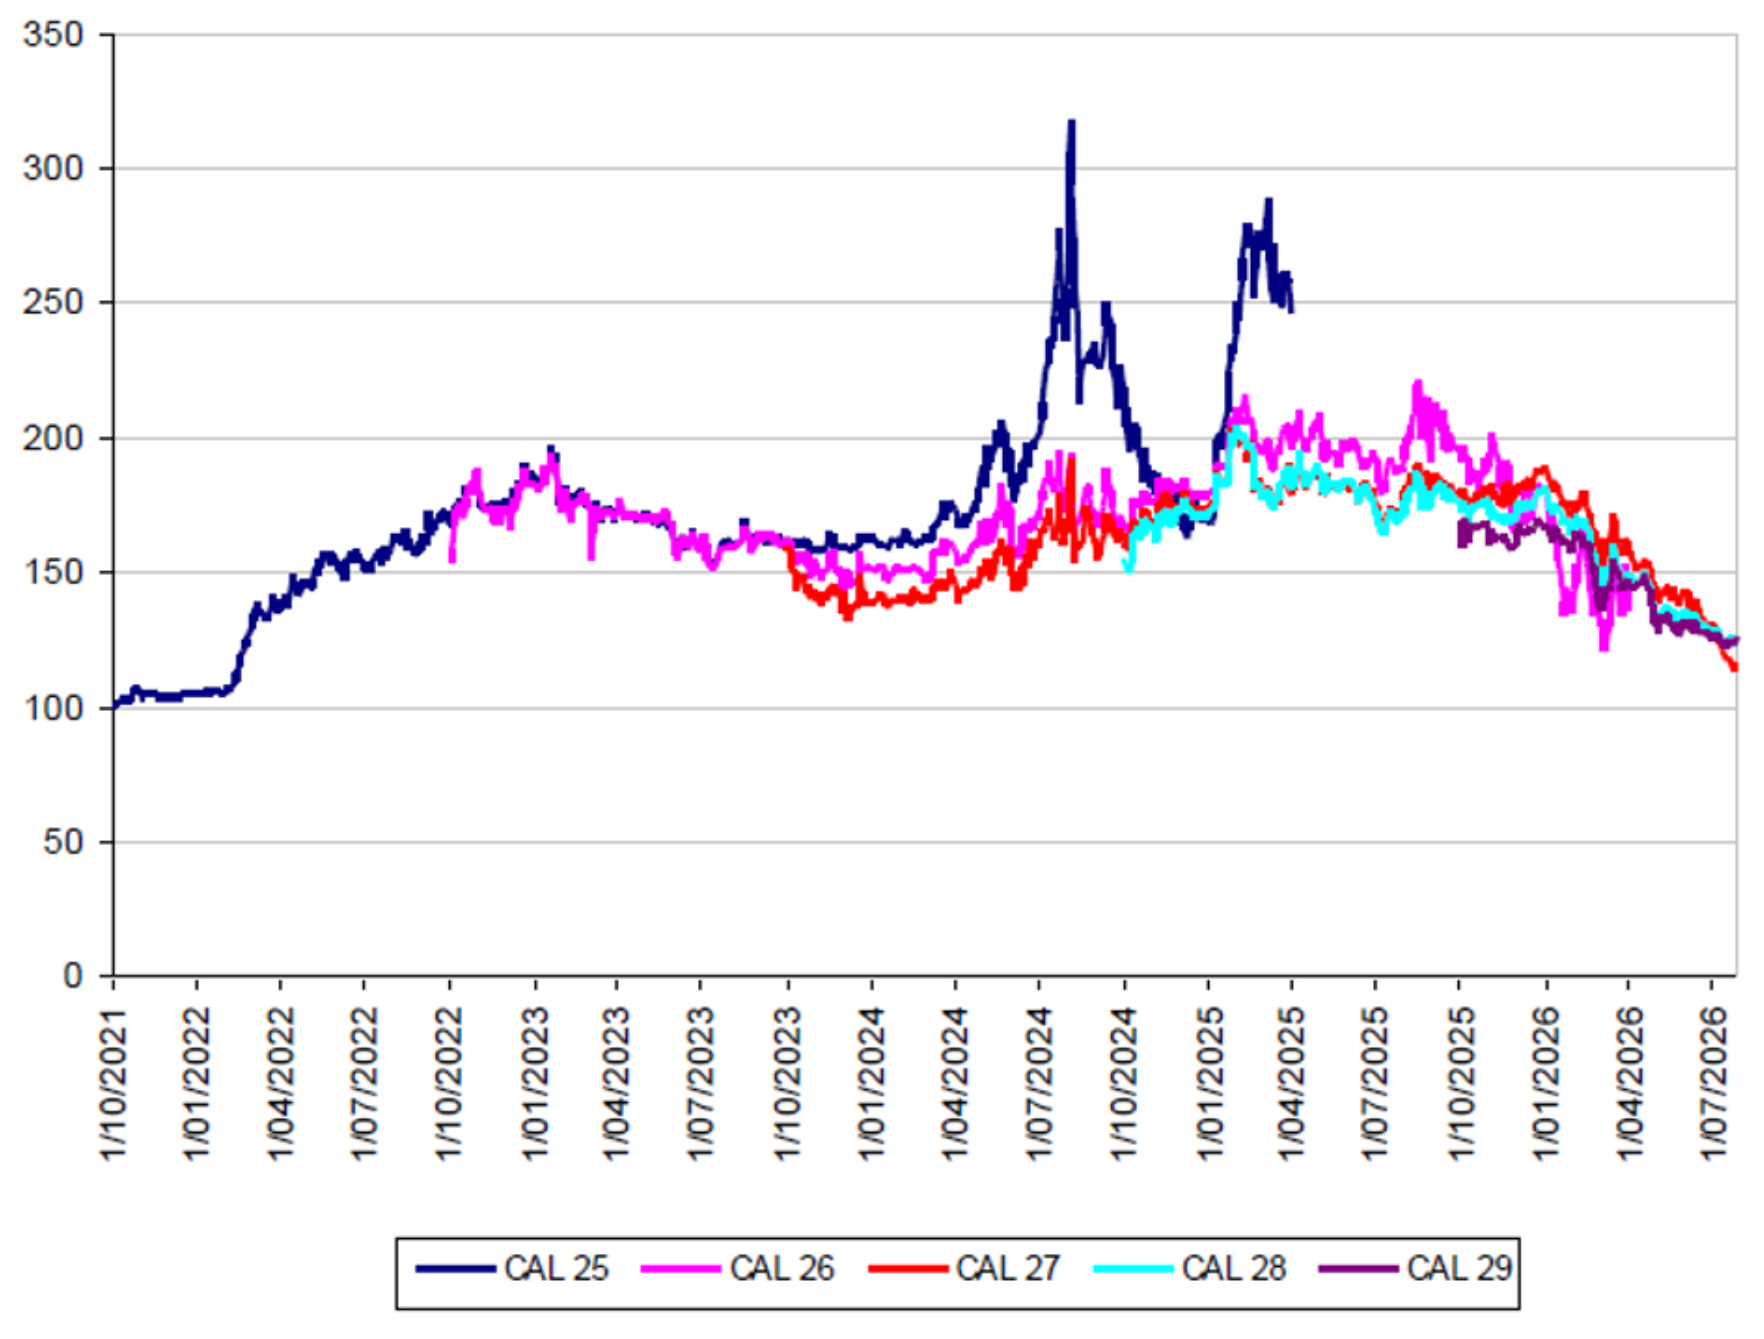
Note that $200/MWh equates to 20c/kWh.
Forward prices were down for all years through April. CAL 2027 dropped 10% ending the month at $139/MWh. CY 2028 was down 9.5% at $131. CY2029 was down 11.5% at $128.
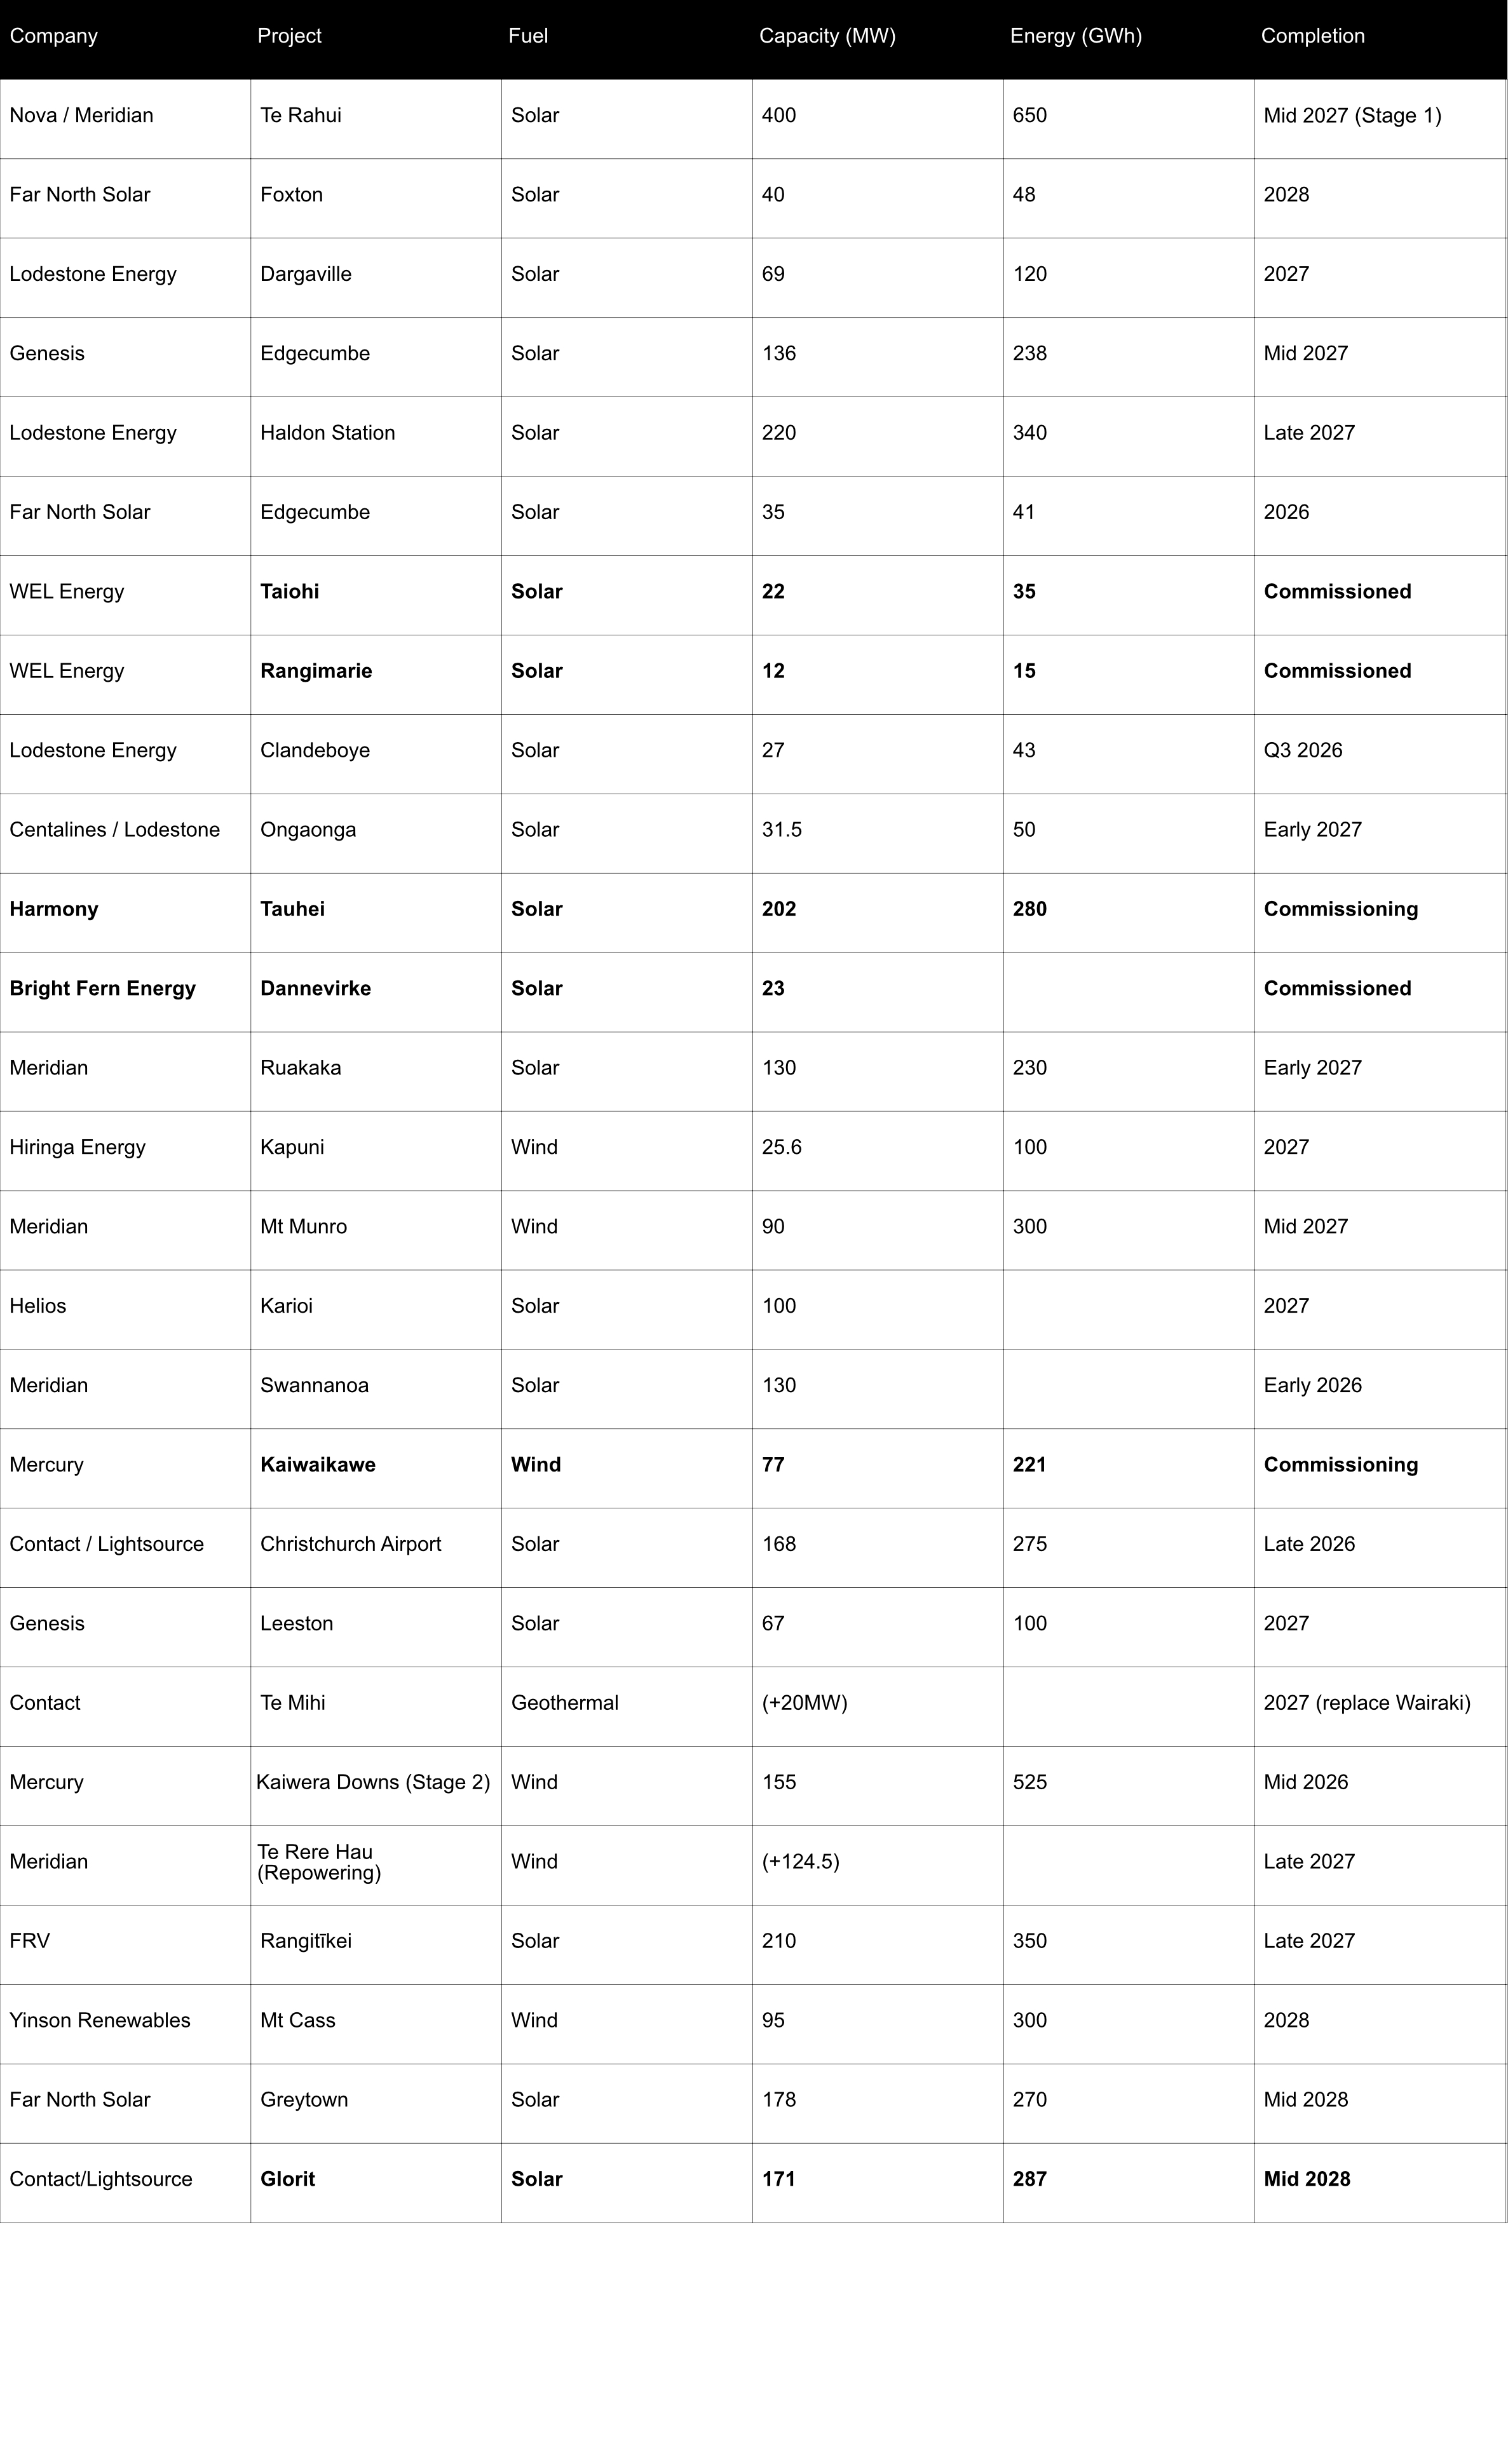
Known new generation projects are shown below (additions / removals / changes highlighted in bold).
Hydro Storage
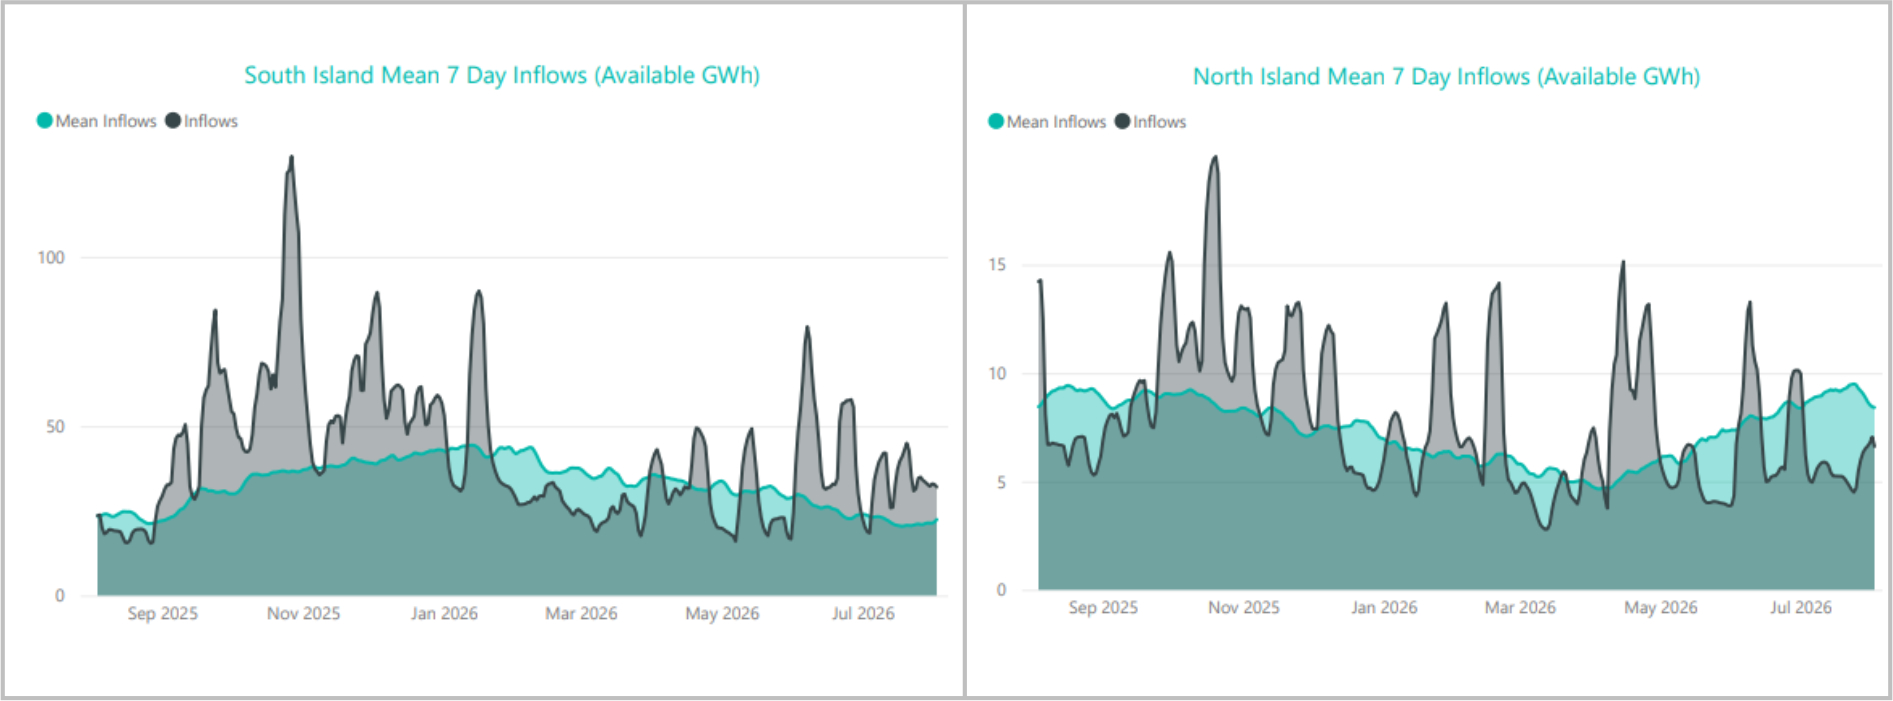
SI inflows were well above average throughout July while NI inflows were below average all month as shown below.
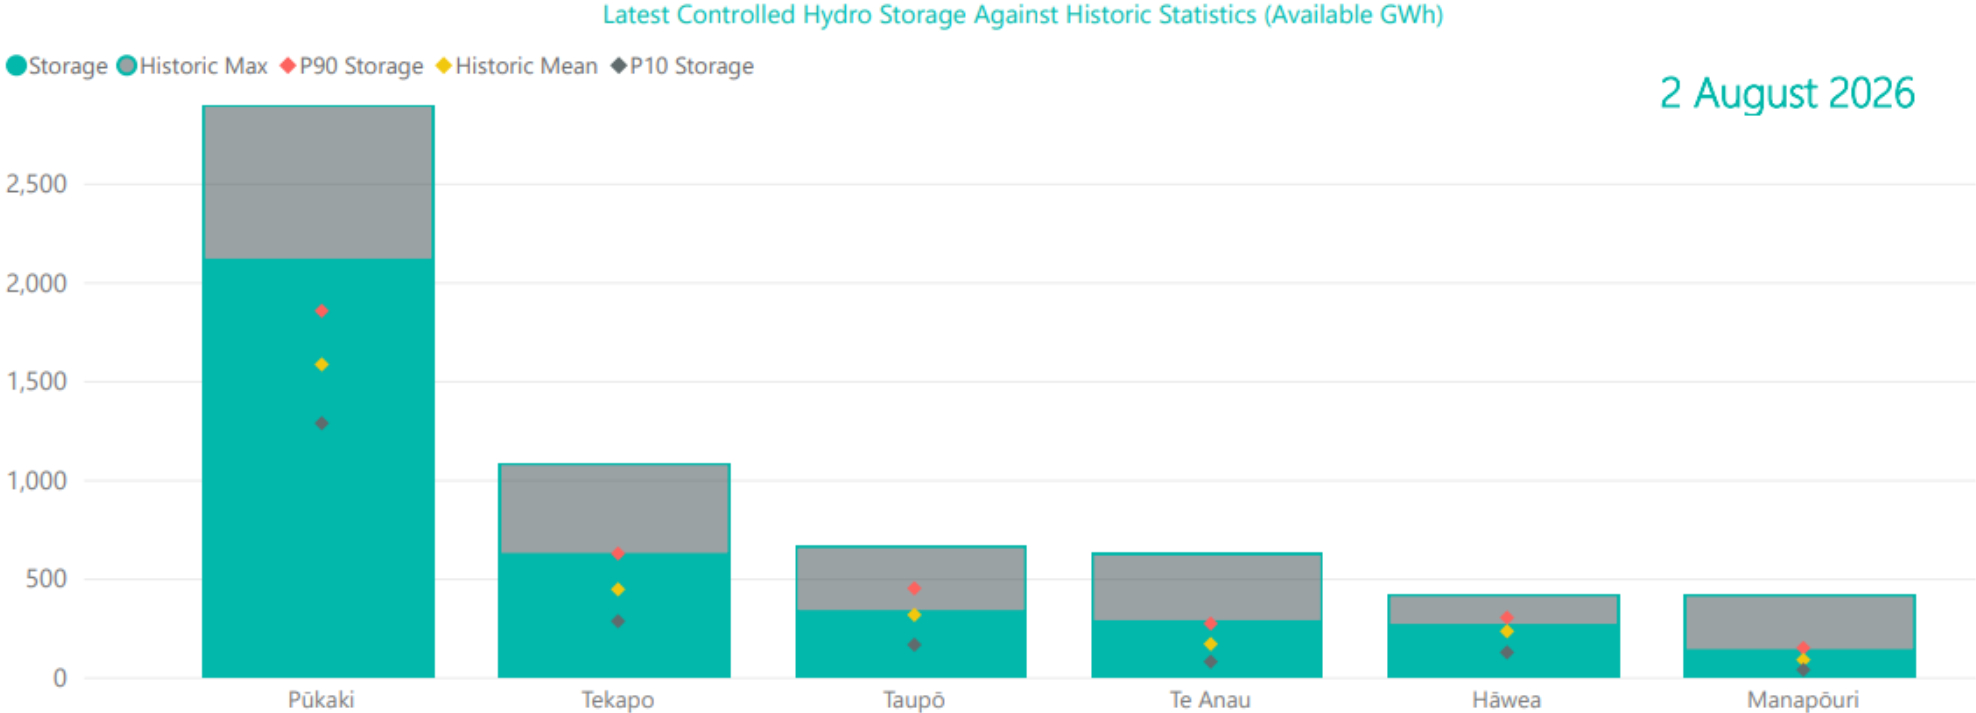
High hydro generation resulted in storage decreasing through most of July. Energy storage levels decreased 274GWh through the month to end at 3,727GWh (84.5% full). Storage remains well above the average level seen at this time of year. The following chart shows the latest breakdown of storage across the main hydro catchments.
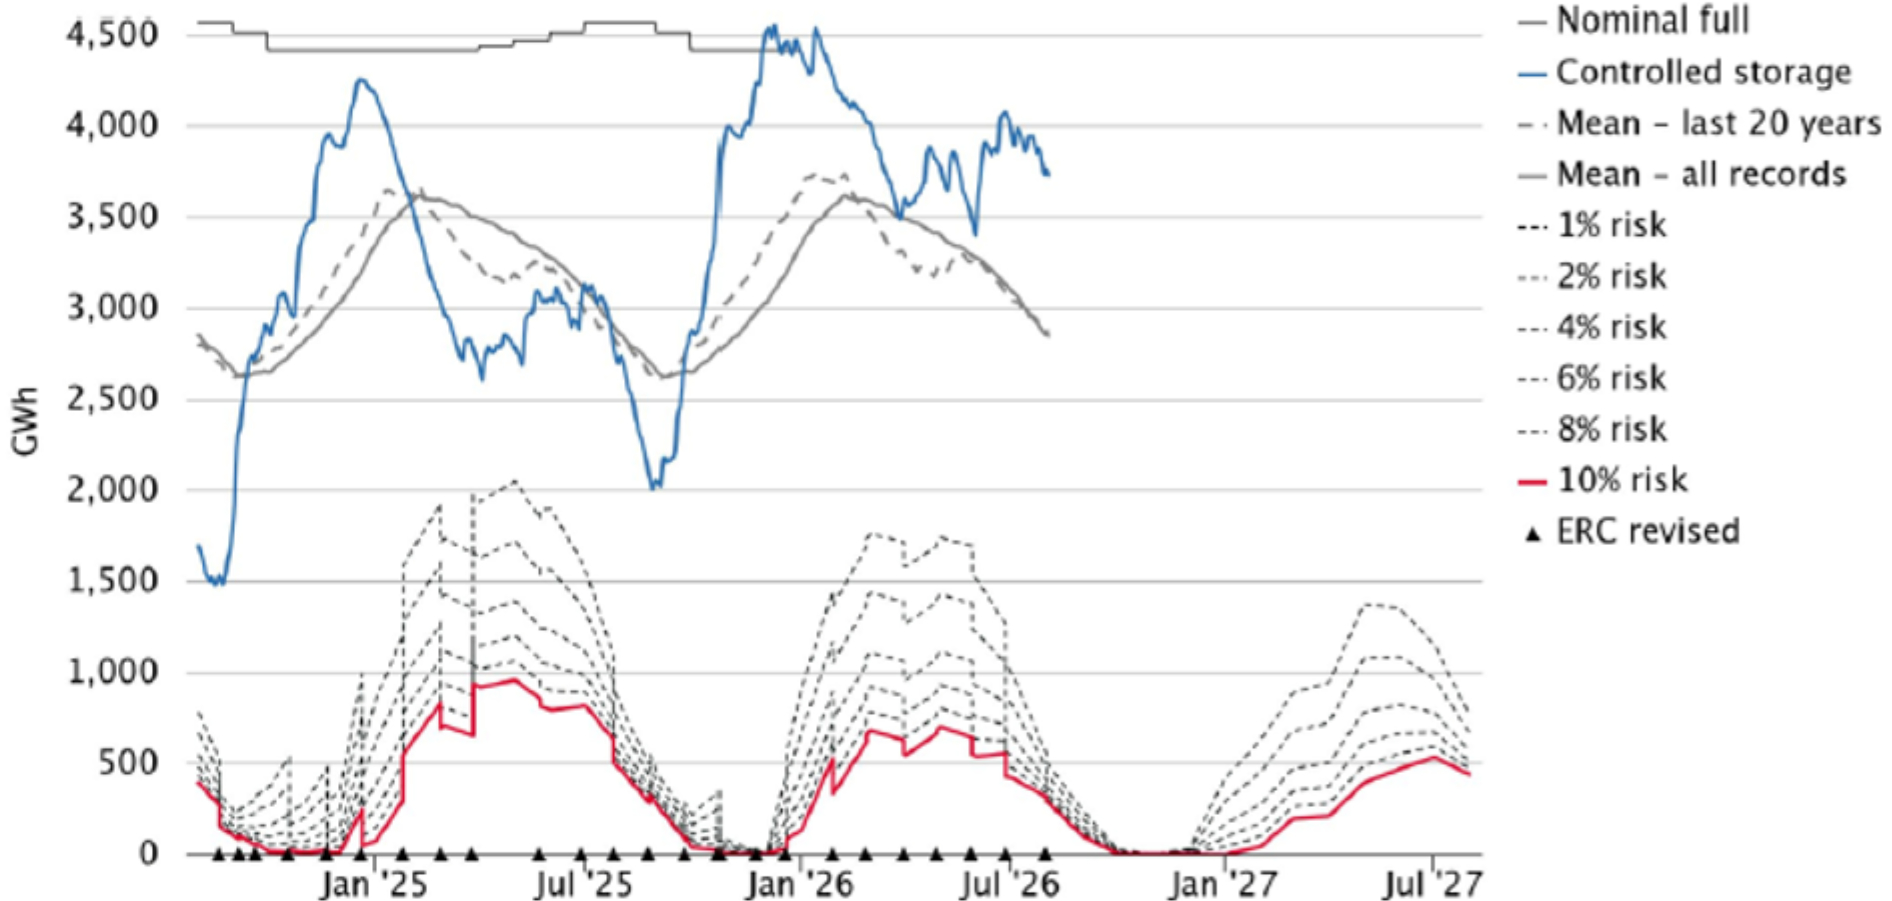
Security of supply risks remained low in July with storage levels well above the average levels as shown below.
Snowpack
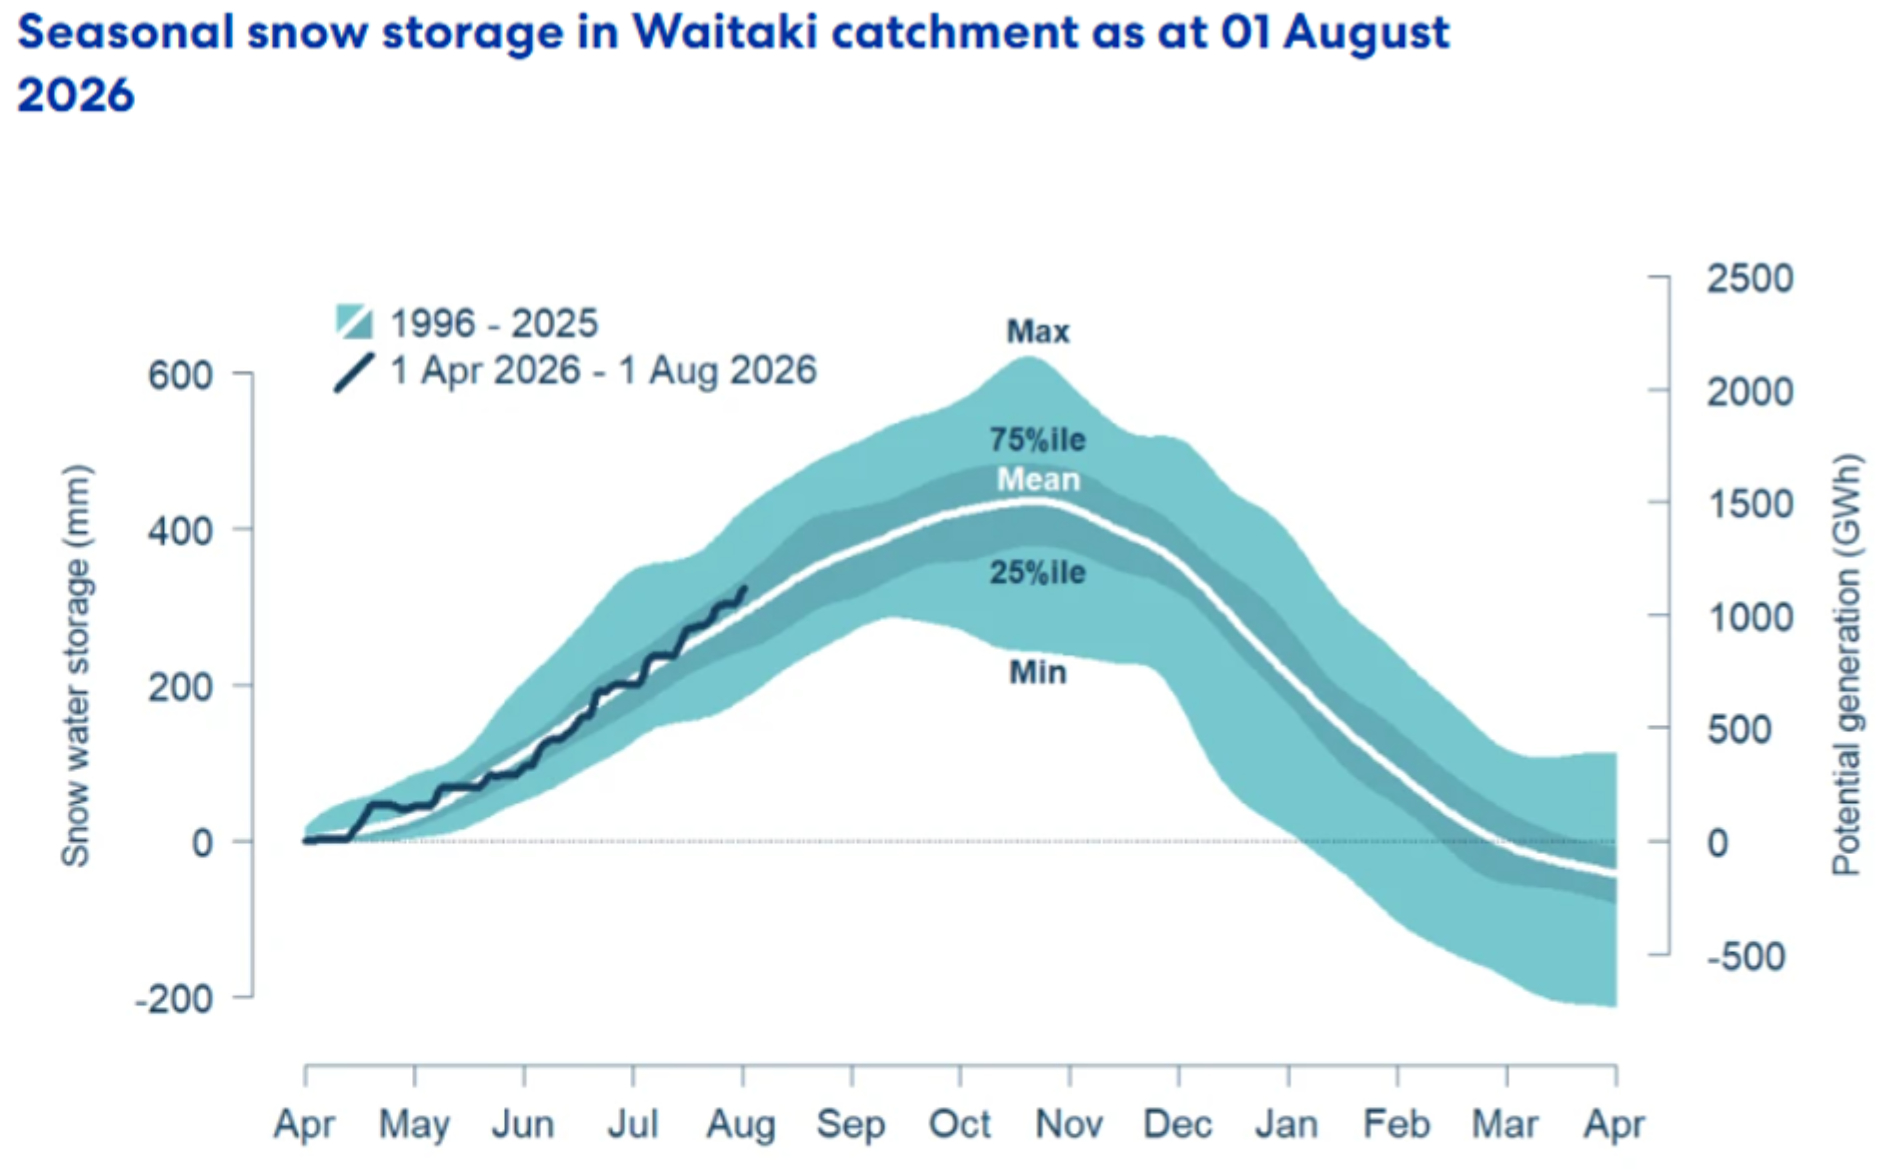
Snowpack is an important way that hydro energy is stored over the winter months and released as hydro inflows in the spring. The following graph shows that the snowpack in the important Waitaki catchment increased during July and is slightly above the average level seen in the last 30 years for this time of year.
Climate outlook overview September - November 2025 (from NIWA)
- El Niño conditions persist in the tropical Pacific atmosphere and ocean, and by all measures the event has strengthened over the last month – including the strongest atmospheric measurements on record for July. We remain in its early stages; impacts on New Zealand’s weather patterns are yet to be fully felt, but are anticipated during this outlook period.
- Air flow patterns are expected to eventually favour a prevailing westerly direction, characteristic of El Niño conditions, as the season progresses. This is expected to be more apparent from mid-spring onwards.
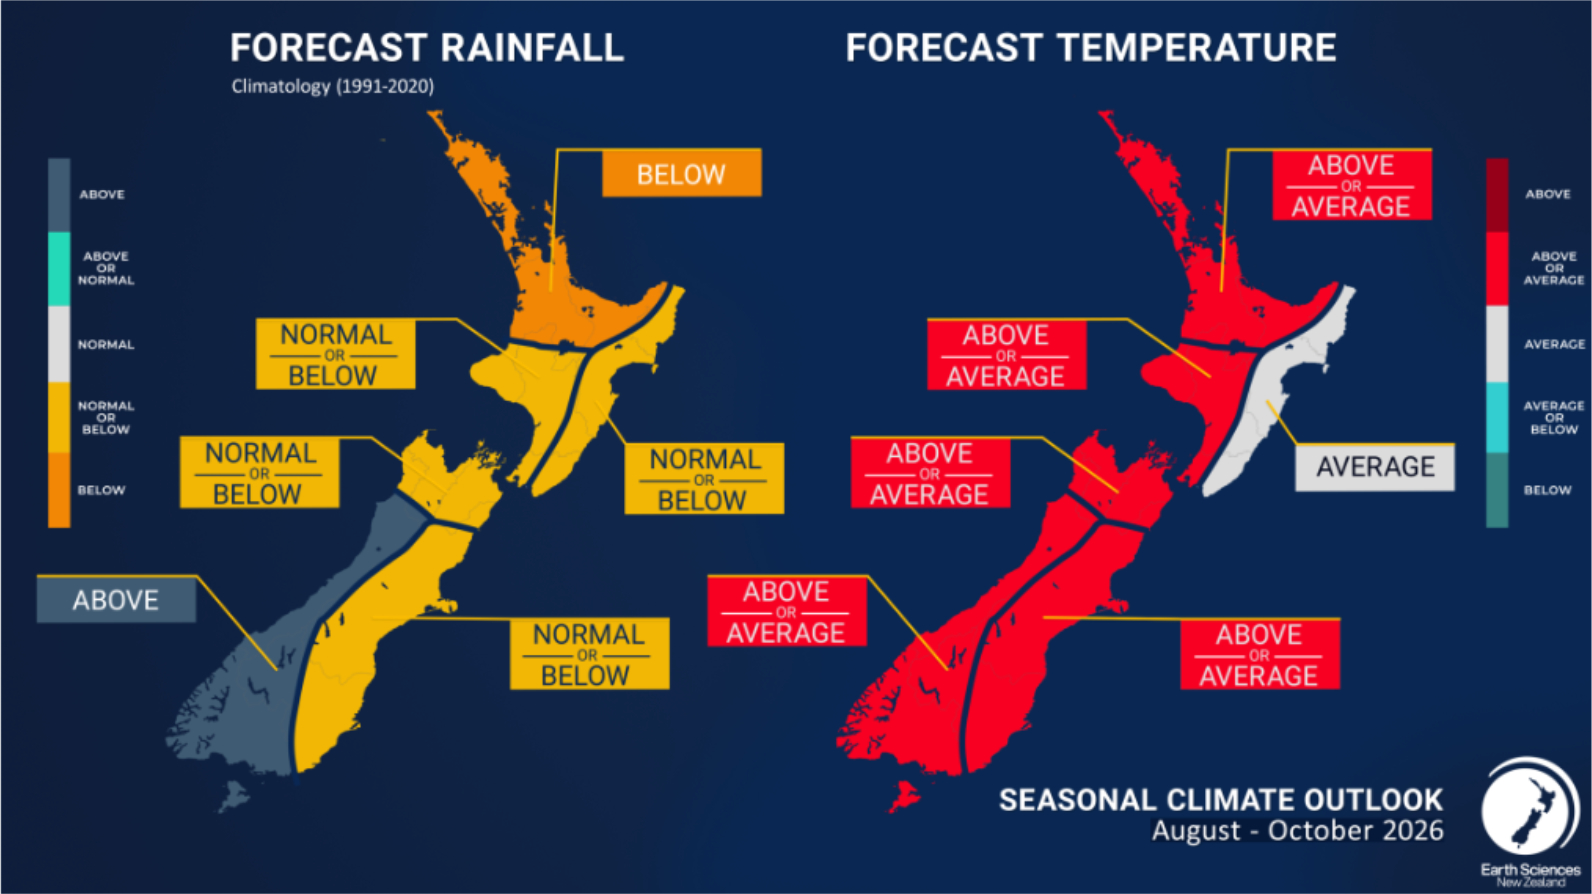
- Seasonal air temperatures for August – October 2026 are most likely to be near average for the east of the North Island. They are about equally likely to be near average or above average for all other New Zealand regions. This does not preclude occasional cold outbreaks, for example in early August, which are a typical aspect of late winter and spring weather patterns.
- Rainfall totals for August – October 2026 are about equally likely to be near normal or below normal for the north and east of the South Island, and the east of the North Island. Rainfall is most likely to be below normal for the remainder of the North Island. Meanwhile, rainfall is most likely to be above normal for the west of the South Island.
- New Zealand has experienced several heavy rain events from the north over the past year. These northerly rain events have already reduced in frequency in recent months, and this trend is expected to continue. The main heavy rain threat instead is expected to shift toward the western and lower South Island.
- The likelihood of below normal rainfall in several regions is likely to translate to below normal groundwater recharge, creating challenges for water-reliant sectors.
- During August – October 2026, soil moisture levels and river flows are expected to be near normal or below normal for the east and north of both islands, the west of the North Island, and the north of the South Island. In the west of the South Island, they are expected to be near normal or above normal.
- Warmer-than-average subsurface ocean temperature anomalies have continued to strengthen and expand across the tropical Pacific, providing clear support for El Niño to intensify further and reach the very strong category in the coming months. Dynamical and statistical forecast guidance concurs, with approximately a 90% likelihood that the event will reach or exceed very strong intensity during the outlook period.
- Peak El Niño conditions are most likely to occur during the austral summer of 2026–27, with the potential for this event to have significant impacts. It is likely to develop into one of the strongest in recent history, as anticipated over the last few months
- El Niño-related influences on regional weather patterns are expected to become more apparent later during spring as ENSO signals continue to strengthen. In New Zealand, this is expected to favour periods of active westerlies, bringing an increased risk of unusually windy conditions and notable temperature variability. How widespread and persistent these conditions become will depend on the location and strength of nearby high-pressure systems.
- Other climate drivers and intraseasonal oscillations, for example, the Indian Ocean Dipole, the Southern Annular Mode and the Madden Julian Oscillation will still contribute to New Zealand weather patterns, though El Niño is expected to be most dominant. In general, these other drivers are moving into phases which support El Niño-like impacts.
- Sudden Stratospheric Warmings (SSW) are historically rare in the Southern Hemisphere, but in recent years have become more common. Predictability is limited, but there is justification for enhanced monitoring over the coming weeks. If an SSW does occur, its impacts on New Zealand weather patterns can be delayed by a month or more.
- Out-of-season Southwest Pacific tropical cyclones (July–October) are extremely rare. When they do occur, it is almost always under El Niño conditions. This remote risk does not currently factor into New Zealand's current Seasonal Climate Outlook, although active monitoring remains in place.
The Wholesale Gas Market
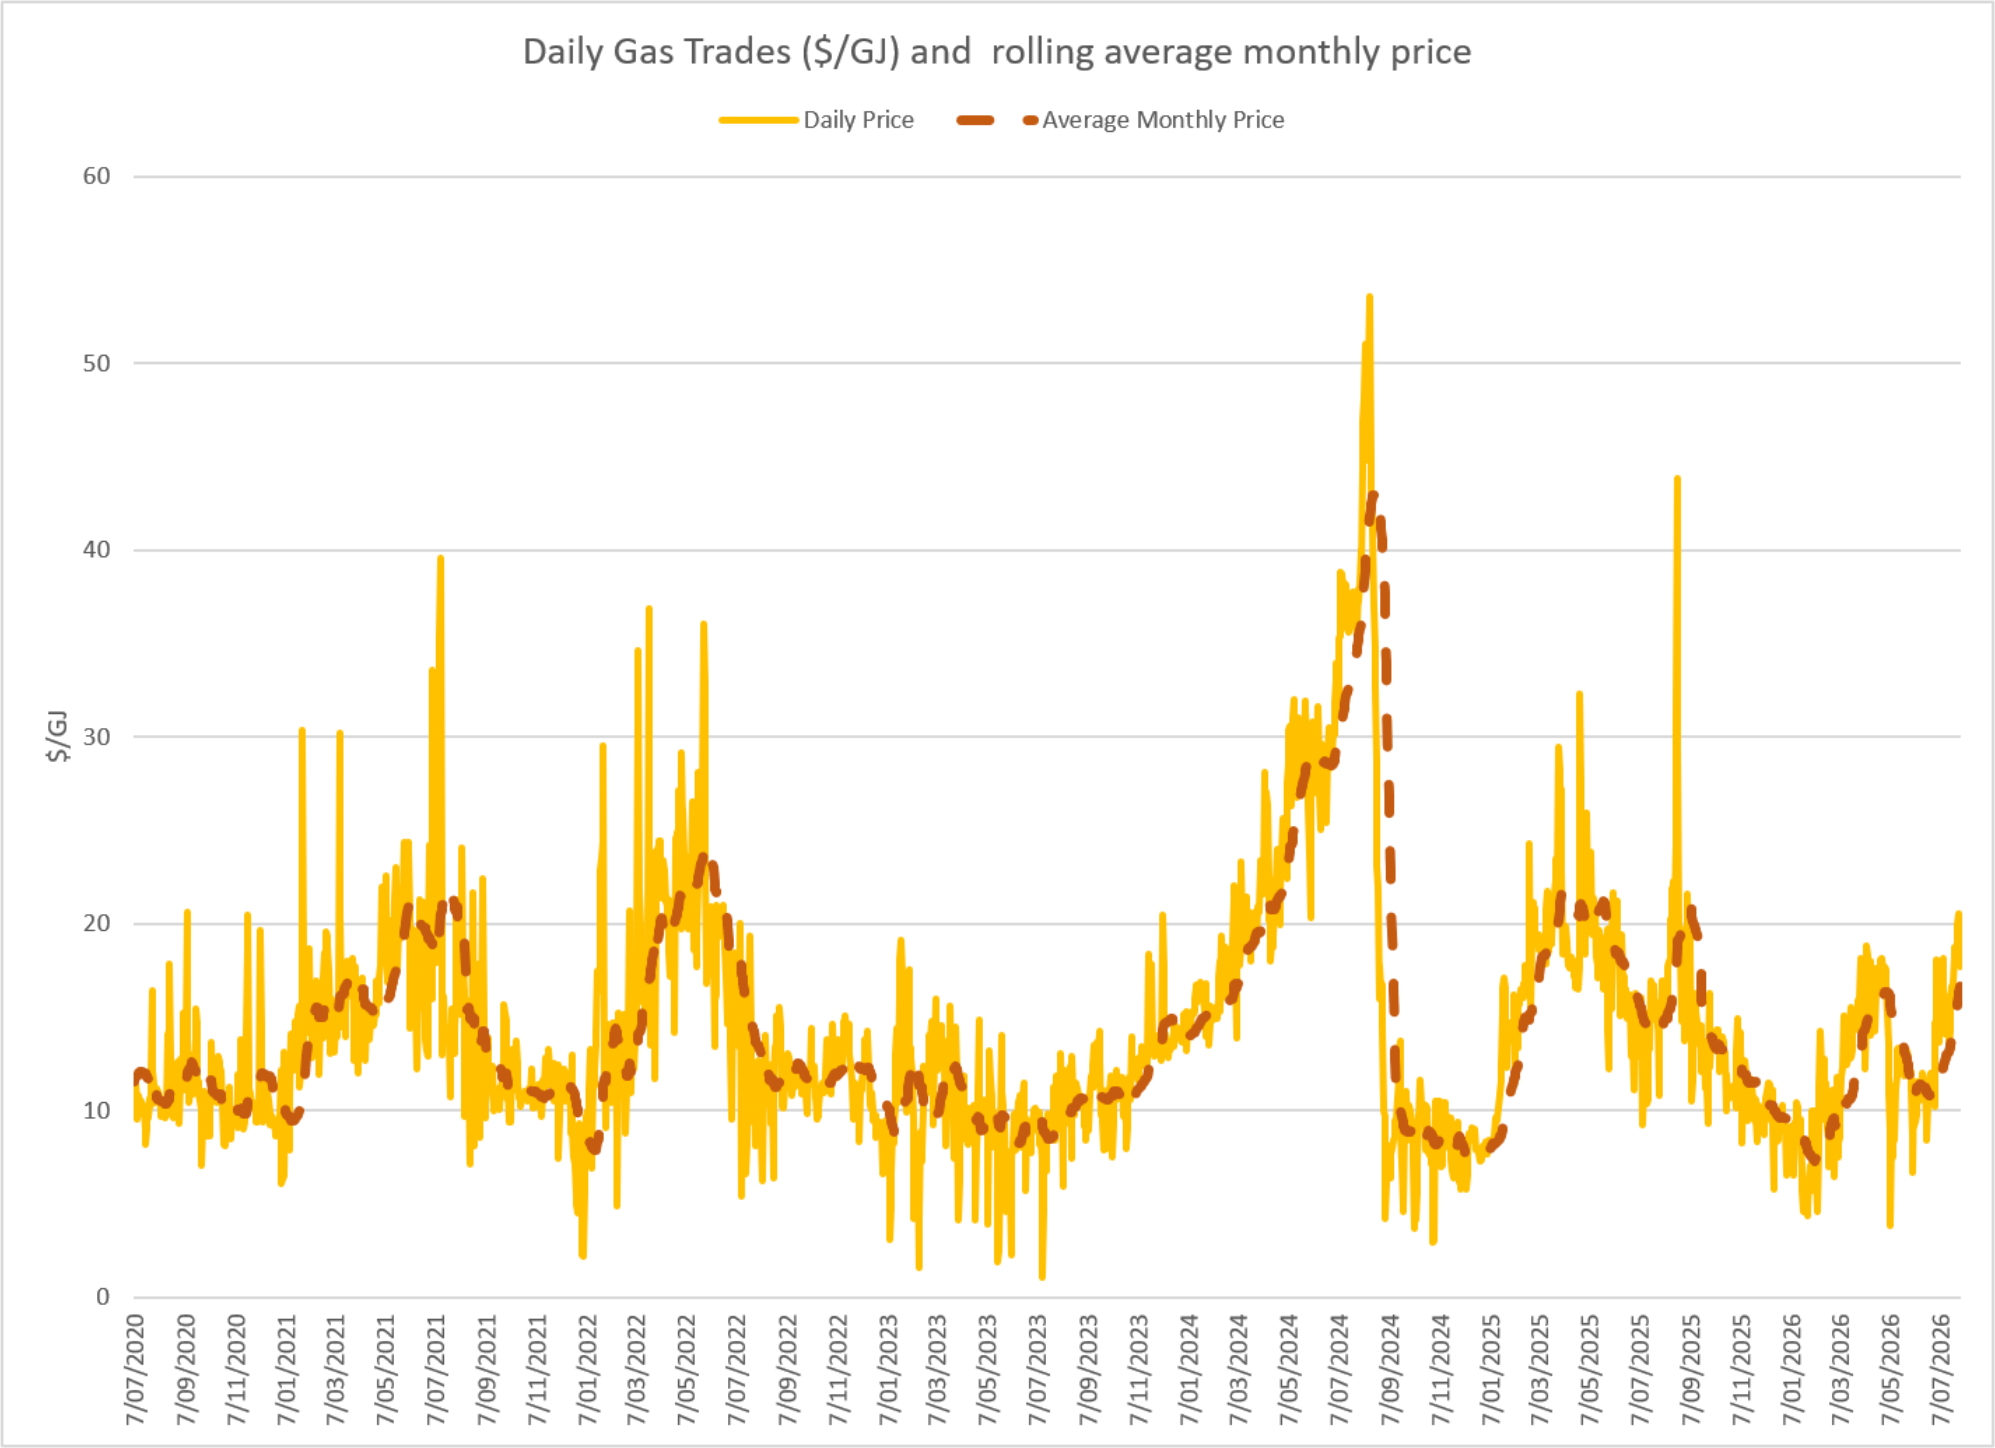
Spot gas prices increased through July. Prices for the month averaged $16.6/GJ – a 56% increase compared to June. Average prices are 17% above what they were at the same time last year. Note that spot gas prices include the cost of carbon (currently around $2/GJ)
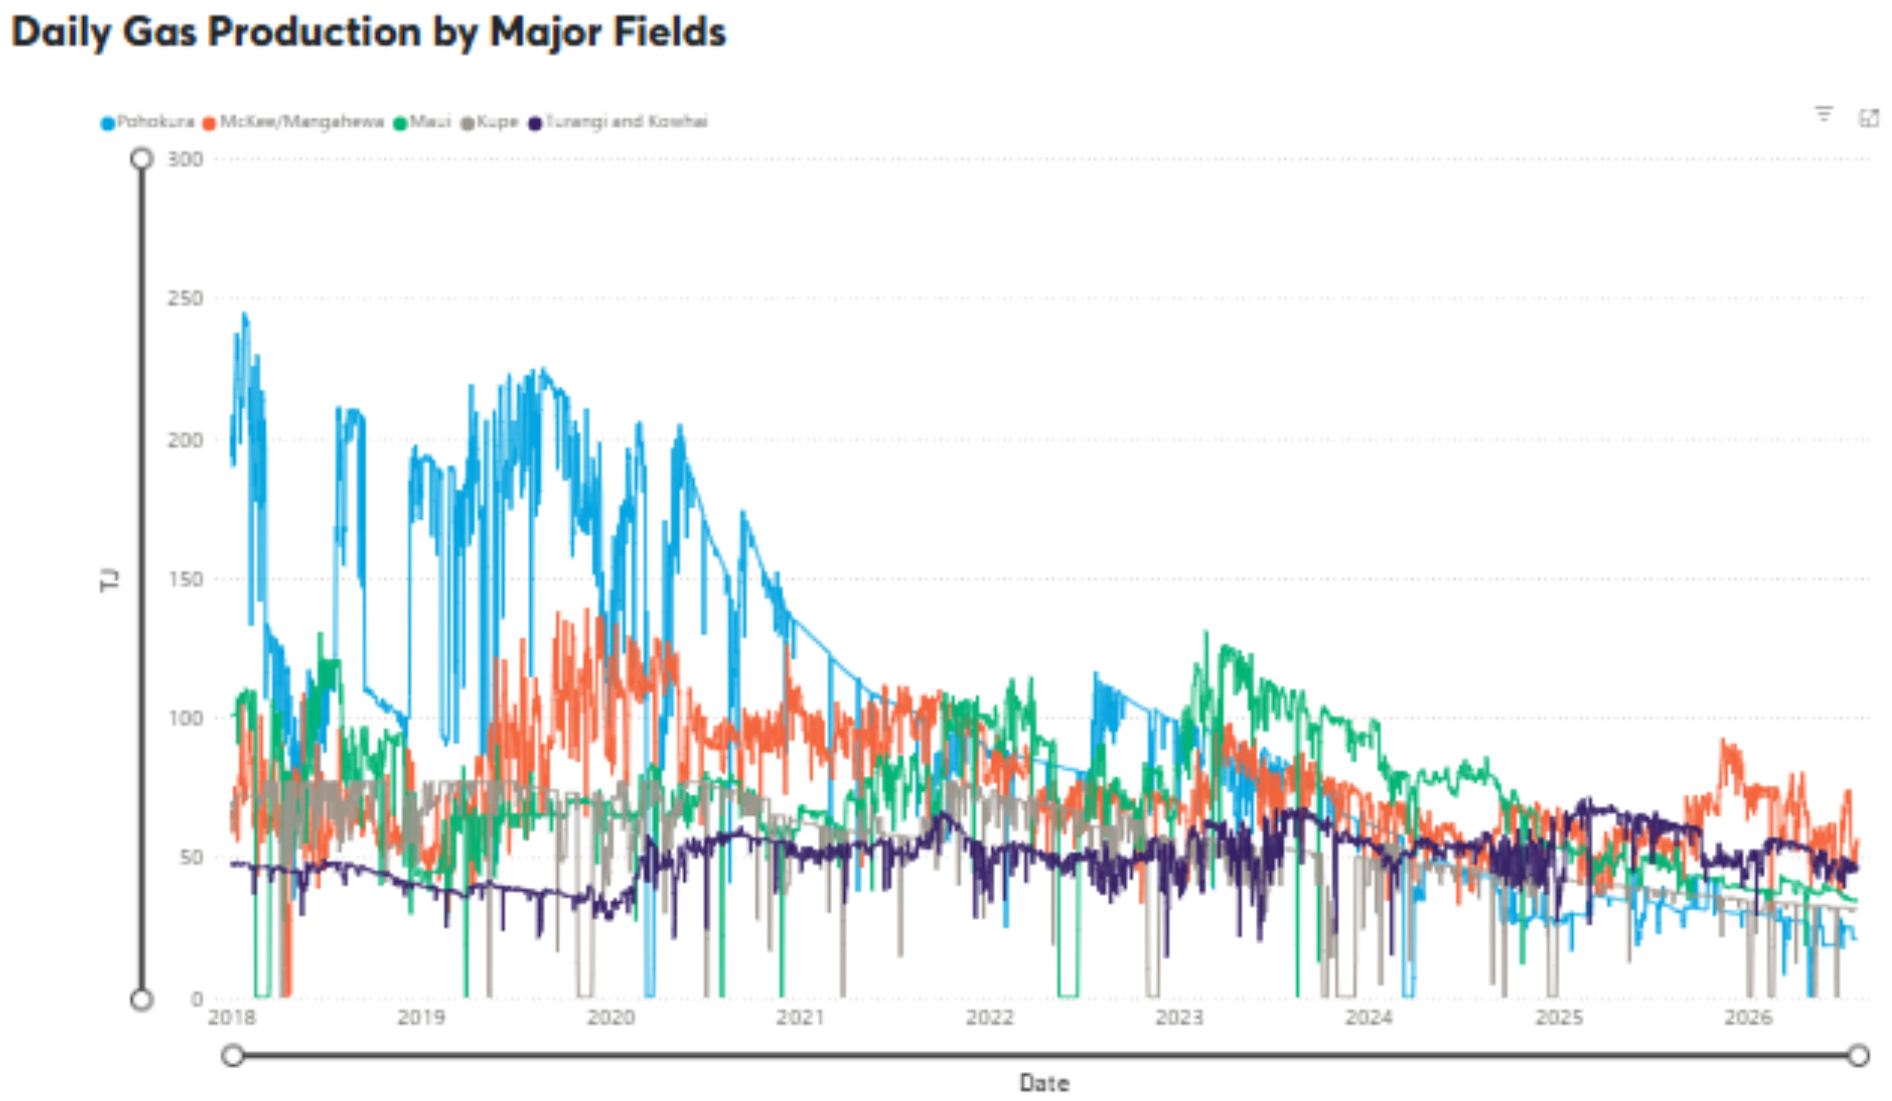
On the supply side most fields maintained or reduced output slightly through July. McKee / Mangahewa was the exception where output increased from around 50TJ/ day to 60TJ/day. Turangi and Kowhai maintained around 47TJ/day. Pohokura dropped through the month ending at 21TJ/day. Maui decreased output to average 35TJ/day. Kupe held output at 32TJ/day.
The following graph shows production levels from major fields over the last 7 years.
On the demand side Huntly decreased gas usage through the month averaging close to 20TJ/day. Methanex came back from a 2-month shutdown at the end of June. It maintained usage at close to 65TJ/day through July. Balance used close to 20TJ/day throughout the month.
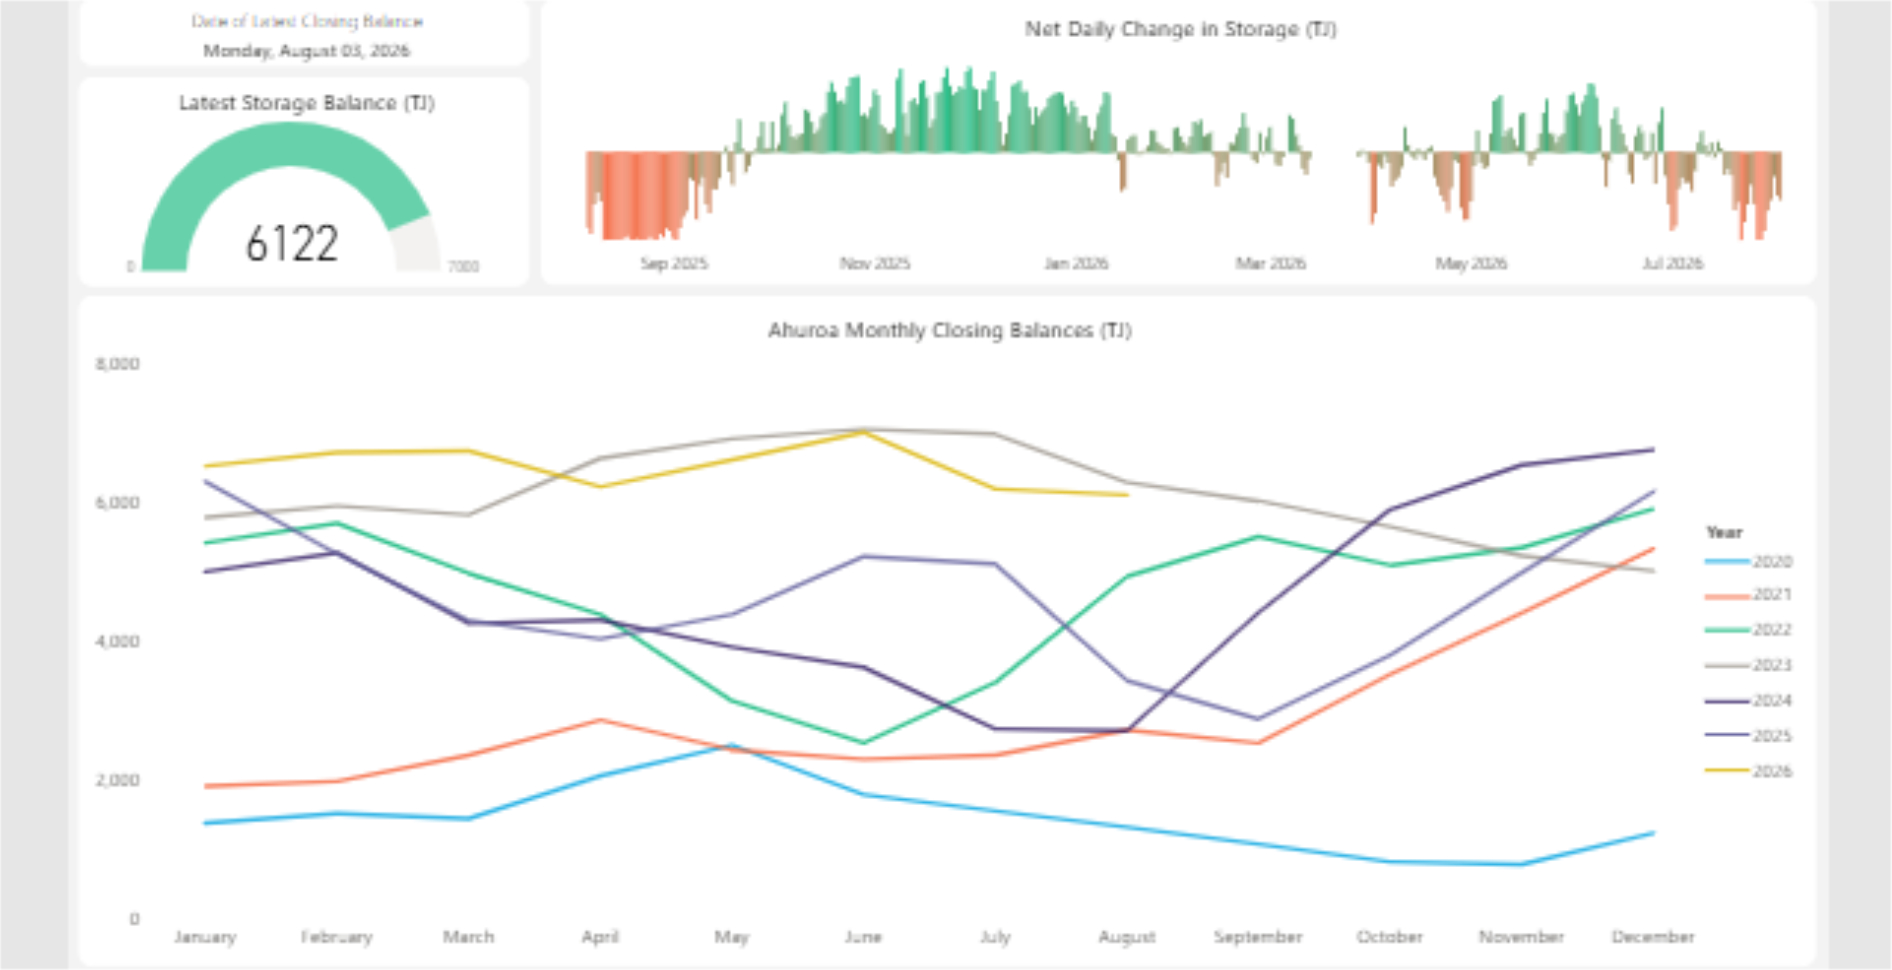
Gas storage is becoming increasingly important as falling production coincides with more variable demand particularly from gas fired electricity generation. The following chart shows how storage at Ahuroa maintained the same high level seen in June. It is close to the maximum levels seen at this time of year over the last few years.
Internationally, LNG netback prices have increased on the conflict in the middle east. Prices in July reduced 9% to $20.47/GJ. Forecast average prices for 2026 are currently $20.51/GJ and $18 for 2027. (Note that netback prices are indicative of international prices – they are produced by the ACCC and quoted in Australian dollars. They are net of the estimated costs to convert from pipeline gas in Australia to LNG, hence the term “netback”)
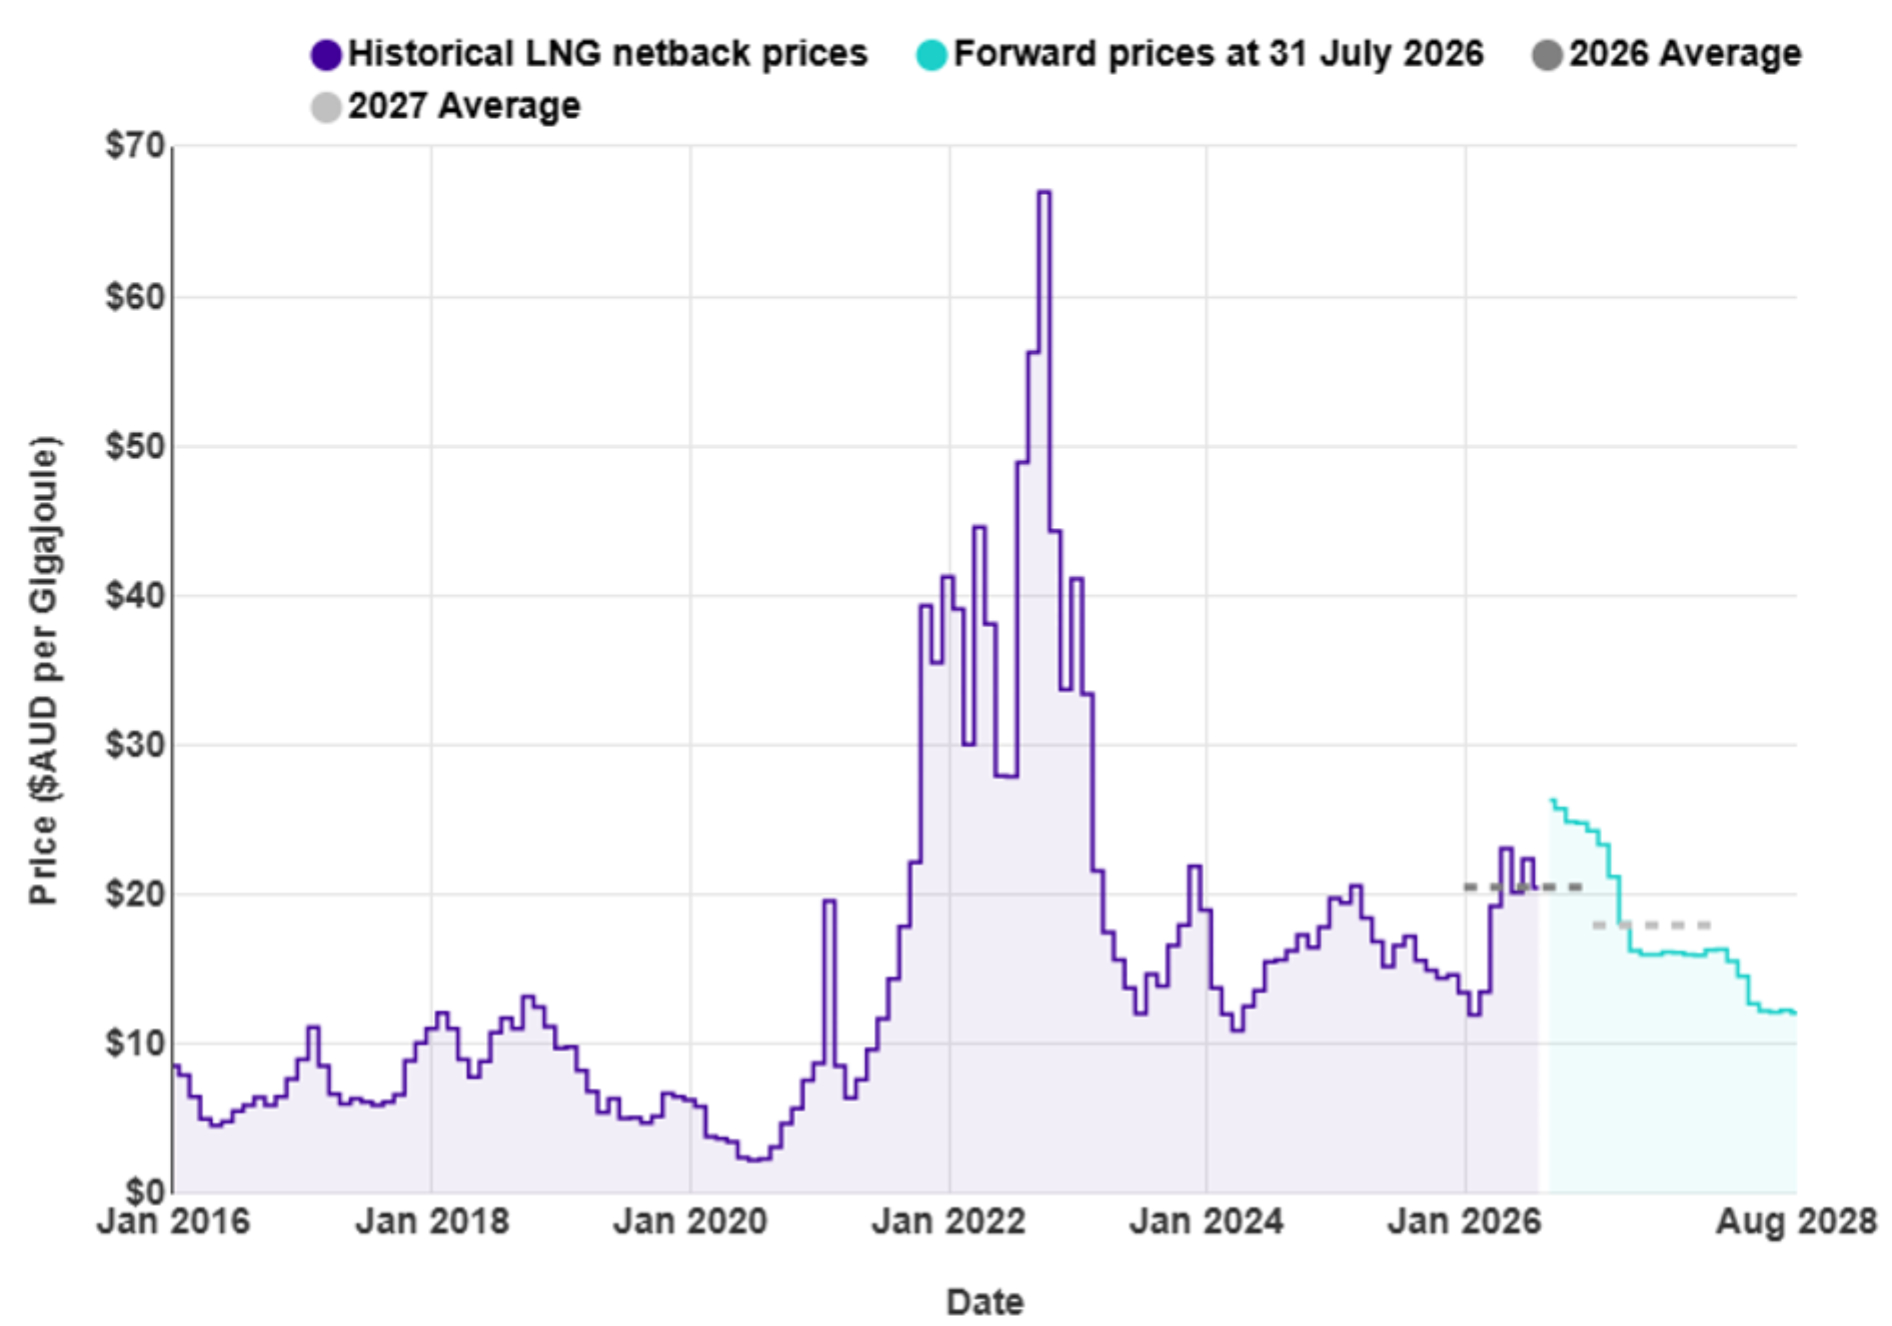
New Zealand does not (yet) have an LNG export/import market, so our domestic prices are not directly linked to global prices, though this may change with the Government announcing that an LNG import terminal will be built in the next few years.
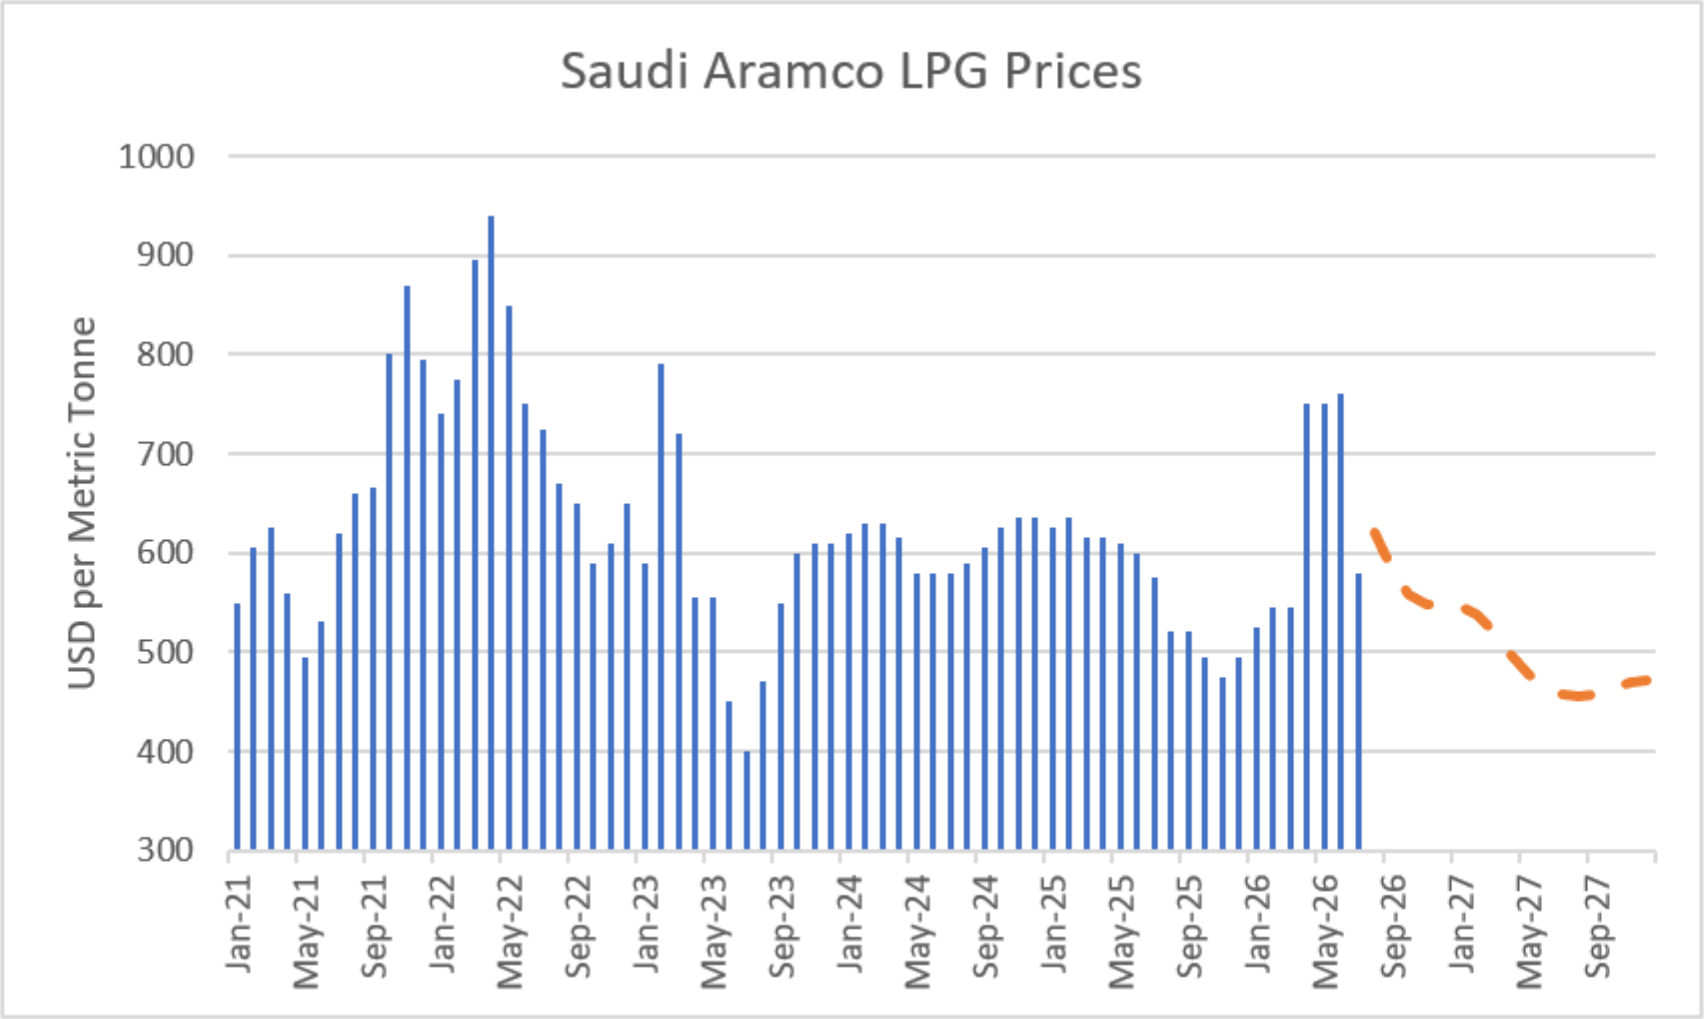
LPG is an important fuel for many large energy users, particularly in areas where reticulated natural gas is not available. The contract price of LPG is typically set by international benchmarks such as the Saudi Aramco LPG – normally quoted in US$ per metric tonne.
The following graph shows the Saudi Aramco LPG pricing for the last 5 years as well as forecast pricing for the year and a half ahead. The war in the middle east caused prices to spike in Apr – Jun but they fell steeply in July, and futures prices have dropped over the last couple of months.
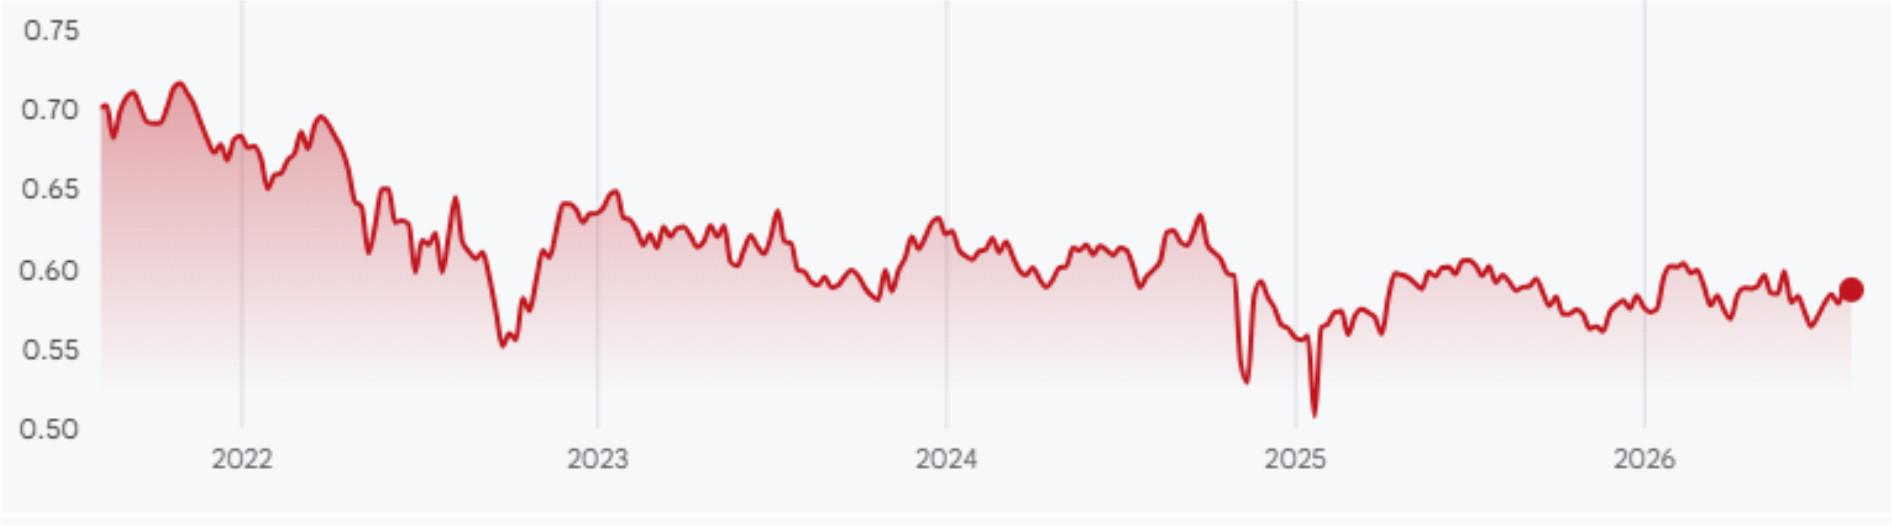
The other main contributing factor to LPG prices in New Zealand is the exchange rate against the USD. The exchange rate was around 0.57 at the start of the month, rising consistently to end the month at 0.59. This remains below the average levels seen in recent years. The recent increases would tend to push down LPG prices when quoted in NZD.
The Coal Market
The conflict in the middle east has resulted in coal prices increasing along with other international energy commodities. To date the impact has not been as great as that observed during the initial years of the Ukraine war. Prices in June were flat for most of the month, ending the month at $133/tonne – up 2% as shown in the following graph of prices over the last 10 years.
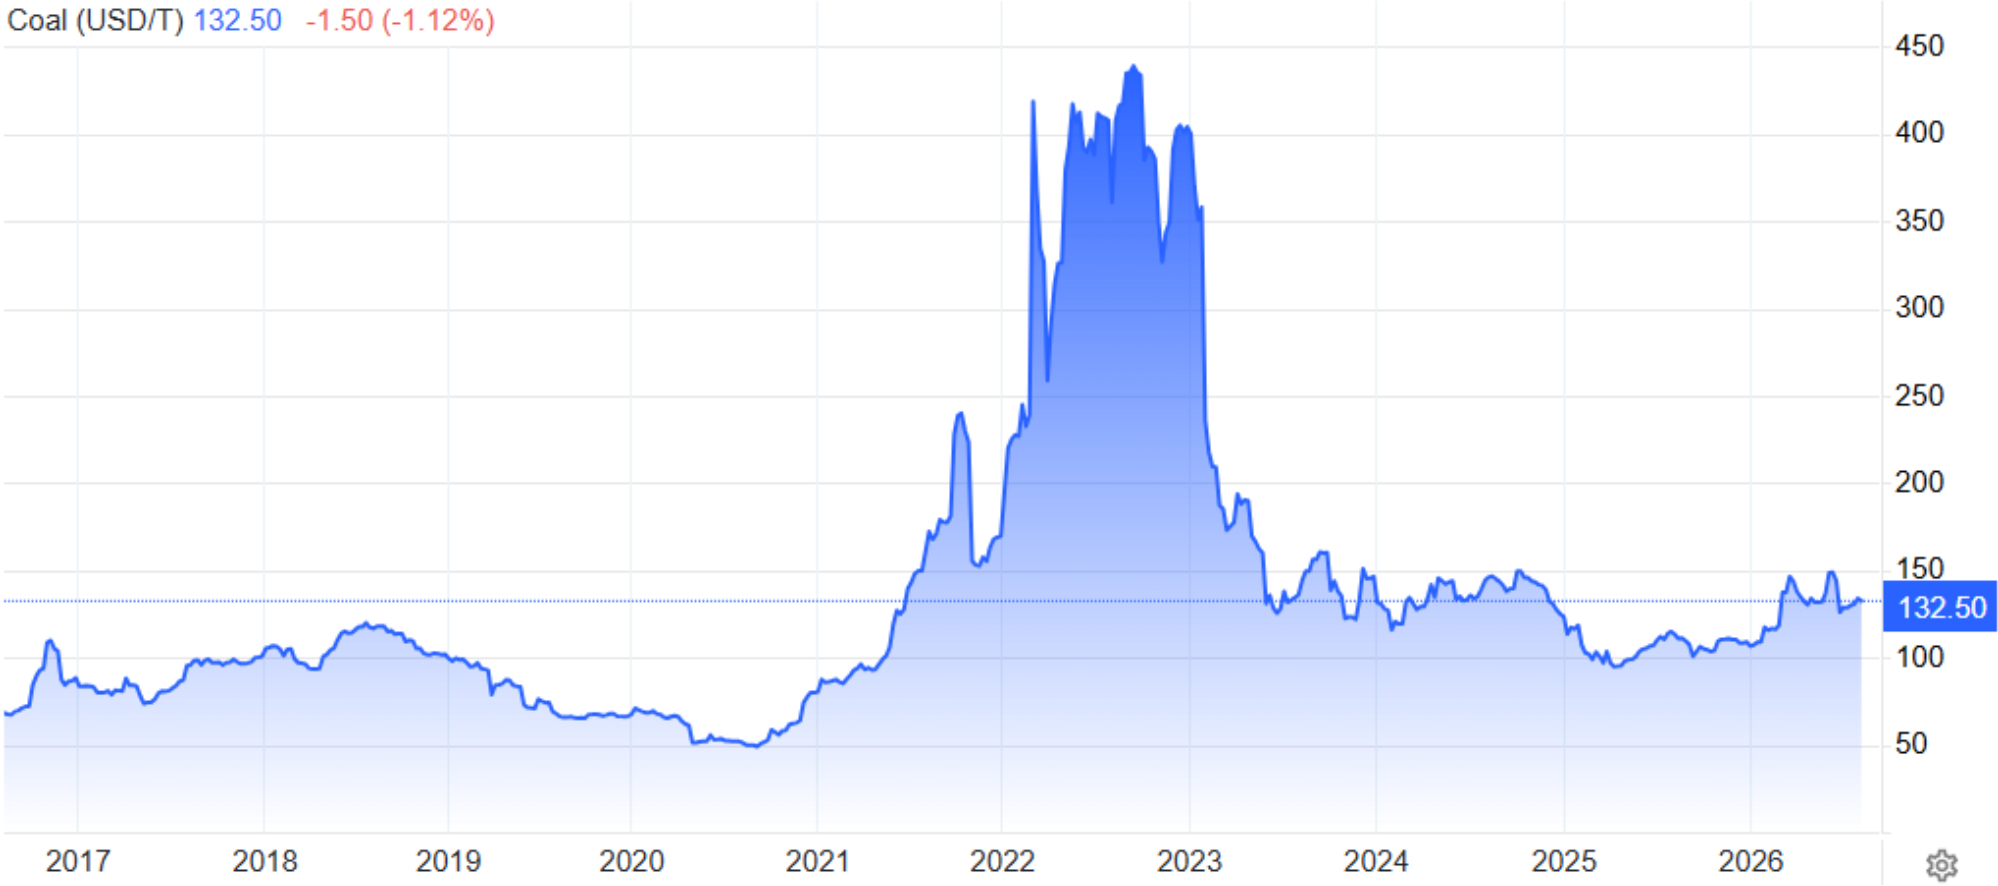
Like gas, the price of coal can flow through and have an impact on the electricity market.
Carbon Pricing
NZ has had an Emissions Trading Scheme (ETS) in place since 2008. It has been subsequently reviewed by several governments and is now an “uncapped” price scheme closely linked to international schemes. However, there are “upper and lower guard-rails” set up to prevent wild swings in carbon price that act as minimum and maximum prices. These increased in December 2023 to $173 and $64 respectively. Carbon prices increased in July, up 2% at $55.
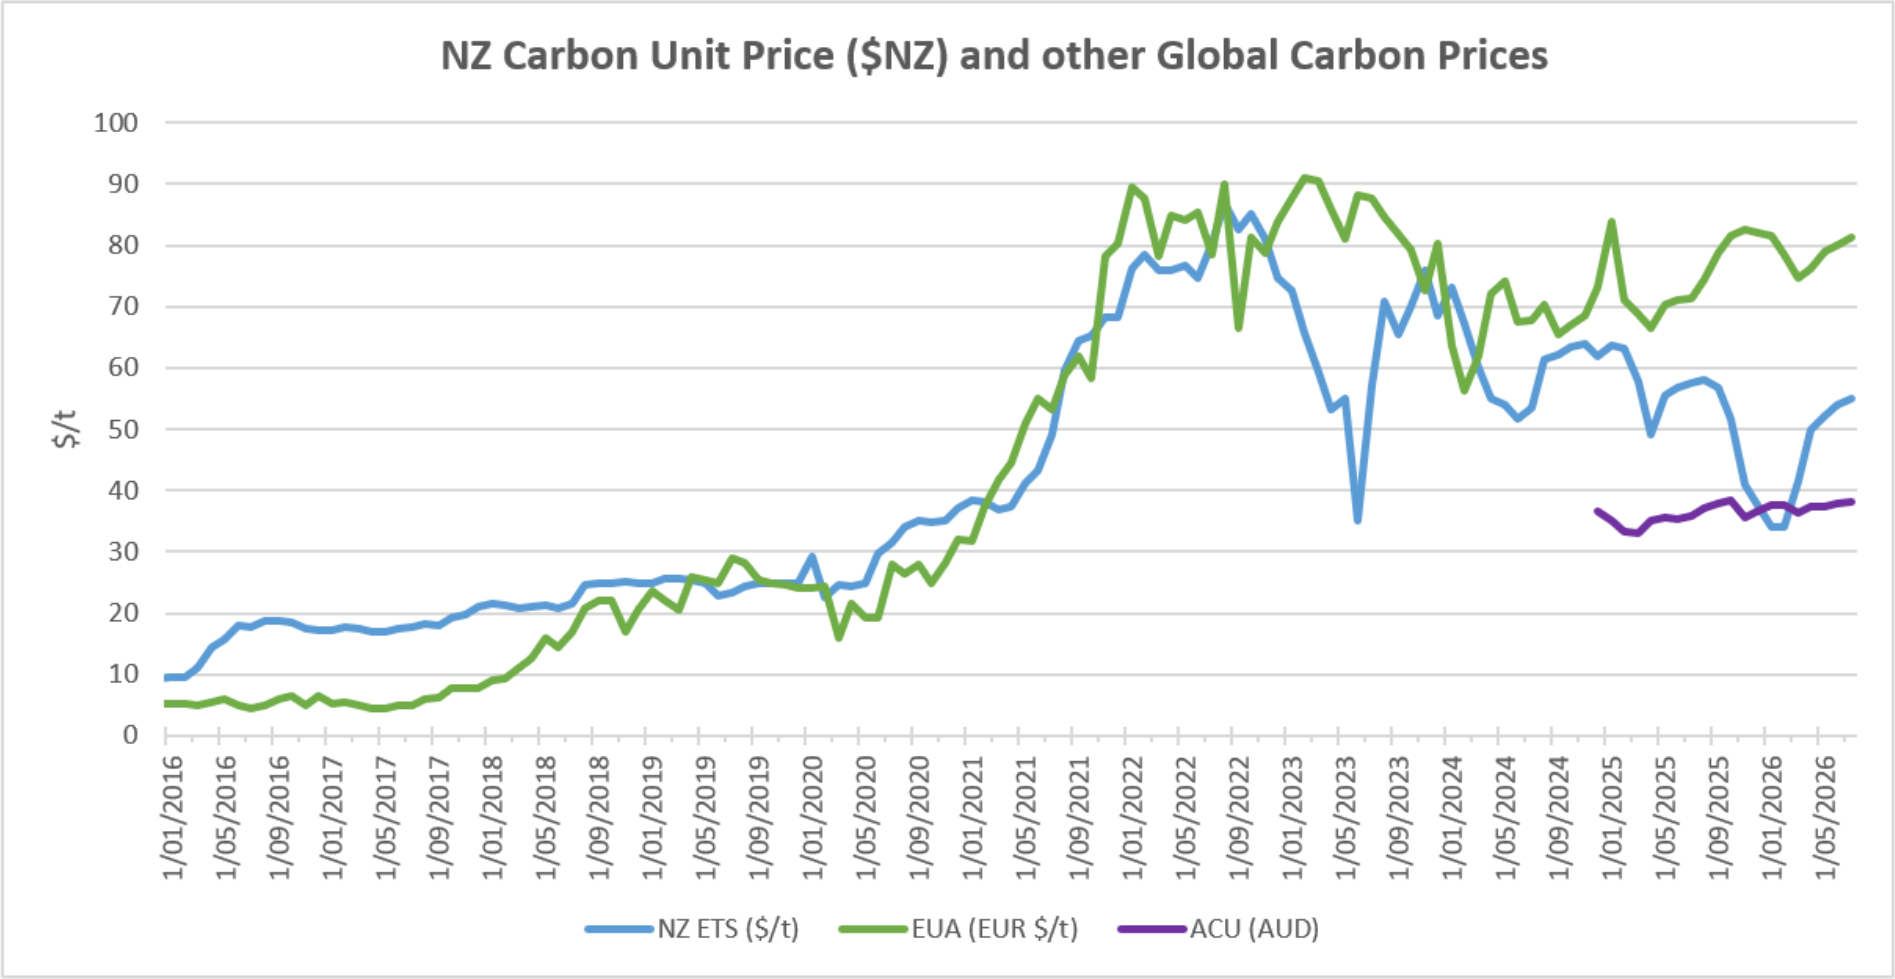
As the carbon price rises, the cost of coal, gas or other fossil fuels used in process heat applications will naturally also rise. Electricity prices are also affected by a rising carbon price. Electricity prices are set by the marginal producing unit – in NZ this is currently typically coal or gas or hydro generators, with the latter valuing the cost of its water against the former. An increase in carbon price can lead to an increase in electricity prices in the short to medium term (as the marginal units set the price). A carbon price of $50/t is estimated to currently add about $25/MWh (or ~2.5c/kWh) to electricity prices. In the long term the impact should reduce as money is invested in more low-cost renewables and there is less reliance on gas and coal fired generation.
EU Carbon units increased in July to 81.2 Euro/tonne. Australian Carbon Units also rose, up 1% at AUD$38.25
About this Report:
This energy market summary report provides information on wholesale price trends within the NZ Electricity Market. Please note that all electricity prices are presented as a $ per MWh price and all carbon prices as a $ per unit price. All spot prices are published by the Electricity Authority. Futures contract prices are sourced from ASX.
Further information can be found at the locations noted below.
- Transpower publishes a range of detailed information, which can be found here: https://www.transpower.co.nz/power-system-live-data
- The Electricity Authority publishes a range of detailed information, which can be found here: https://www.emi.ea.govt.nz/
- Weather and Climate data – The MetService publishes a range of weather-related information, which can be found here: https://www.metservice.com/
Disclaimer: This document has been prepared for informational and explanatory purposes only and is not intended to be relied upon by any person. This document does not form part of any existing or future contract or agreement between us. We make no representation, assurance, or guarantee as to the accuracy of the information provided. To the maximum extent permitted by law, none of Smart Power Ltd, its related companies, directors, employees or agents accepts any liability for any loss arising from the use of this document or its contents or otherwise arising out of or in connection with it. You must not provide this document or any information contained in it to any third party without our prior consent.
About Smart Power:
Smart Power is a full-service Energy Management consultancy. Apart from Energy Procurement, Smart Power can also provide:
- Technical advice on how to reduce your energy use & emissions
- Sustainability Reporting
- Invoice Management Services
We also offer boutique energy and water billing services for landlords/property developers.
Contact us here or call one of our offices to talk to our experienced staff about how we can assist you with achieving your energy goals.
© Copyright, 2026. Smart Power Ltd


