
The Wholesale Electricity Market
Spot prices in the wholesale electricity market fell during May from the very high levels seen in the last few months, however remained high. Average spot prices for the month ranged from $195 in the central North Island (down from $308 in April), up to $221 in the upper South Island ($350 in April).

The following chart shows average weekly spot prices over the last 2 years. The recent drop off in prices can be clearly seen.

Electricity Demand
Electricity demand in May was low compared to recent years for most of the month as shown below.

Electricity Generation Mix
Some reasonable inflows allowed for increased hydro generation through May. This along with higher wind and geothermal generation allowed thermal generation to back off.

HVDC Transfer
Power transfers on the HVDC link connecting the North and South Islands are important both in showing relative hydro positions and the reliance on thermal power to meet demand. High northward flow tends to indicate a good SI hydro position, whereas the reverse indicates a heavy reliance on thermal power to make up for hydro shortages.
Southward transfer remained strong at the start of May however increased South Island inflows later in the month saw higher northward transfer.

The Electricity Futures Market
The Futures Market provides an indication of where market participants see the spot market moving in the future. They are based on actual trades between participants looking to hedge their positions (as both buyers and sellers) into the future against potential spot market volatility. They are also a useful proxy for the direction of retail contracts.
The following graph shows Futures pricing for CY 2025, 2026, 2027 and 2028 at Otahuhu (Auckland) for the last 2 years.

Note that $100/MWh equates to 10c/kWh.
Forward prices were down for all years through May. CAL 2026 ended the month at $195/MWh – down 7% over the month. CY 2027 price was down 3% at $181 while CY 2028 decreased 1% at $184.
Known new generation projects are shown below (additions / removals / changes highlighted in bold).

Hydro Storage
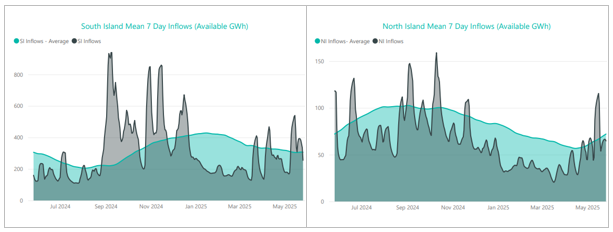
Inflows in the North Island were at or above average for most of May. The South Island started the month with below average inflows, but they picked up for the second half of the month as shown below.
These inflows resulted in energy storage levels increasing 268GWh through the month to end at 3,048GWh (68% full). Storage remains below the average level seen at this time of year. The following chart shows the latest breakdown of storage across the main hydro catchments.

Security of supply risks decreased through May with storage levels increasing as shown below.

Snowpack
Snowpack is an important way that hydro energy is stored over the winter months and released as hydro inflows in the spring. The following graph shows that the snowpack in the important Waitaki catchment increased during May but remains (on the 24th May) below the 25th percentile levels seen in the last 30 years for this time of year.

Climate Outlook Overview (from the MetService)
Climate Drivers — The El Niño-Southern Oscillation (ENSO) index continues firmly at neutral levels as sea surface temperatures around the eastern Equatorial Pacific sit near normal. However, atmospheric conditions still hold onto some La Niña-like traits, and this may allow northerly lows to continue to affect us in the near future.
Both the Tasman Sea Index (TSI) and Southern Annular Mode (SAM) are currently in negative territory, associated with an ongoing Southern Ocean outbreak. They are likely to remain negative for much of this week before recovering. At least one more dip into negative territory is possible throughout June.
Sea Surface Temperatures (SST) remain generally warmer than average. This helped boost rainfall totals during May, and could provide some moderation for any cold spells in June.
June 2025 Outlook — Expect some dynamic weather for the first week of June as a low from the north brings wet, windy and mild conditions for most of the country, then a dramatic shift later in the week as a surge of Antarctic air floods onto the country. This cold air hangs around throughout the weekend – ski fields will get a great boost from this system, and we may even see snow falling close to sea level in the South Island.
Next week starts with high pressure moving in and may remain stuck in place for several days, trapping the cold air and bringing frigid days and nights to inland regions. There’s a good shot at the full gamut of classic winter scenes – snow, freezing fog, black ice and possibly hoar frost. If you’re going to be out in the paddocks, now would be a good time to remember where you stashed your warmest socks.
Week two ends on a milder note, with a Tasman Sea low bringing bursts of rain and warming temperatures to much of the country, though the South Island basins will hang onto the cold air as long as they can. However, the cold will struggle to win out in the long run.
The second half of the month likely brings a north or northwest dominated pattern, with milder conditions and rain focussing on northern and western parts of the country, either from Tasman Sea fronts or lows from the north. Trailing behind these systems we could still see a few Southern Ocean cold snaps with tail-end snow events, especially for the South Island.
While the upcoming cold spell may live in the memory and the Camera Roll, it will probably struggle to put a serious dent in the overall temperature anomaly for the month: expected to come in near average for the South Island, and more likely on the milder side overall for the North Island.
Note that the Metservice has decided to discontinue this free climate outlook service. We will review what we are able to obtain for our report from next month.

The Wholesale Gas Market
Spot gas prices in May remained close to the very high levels seen last month. Prices for the month averaged $19.8/GJ – a 4% decrease compared to April. Average prices were 31% below what they were at the same time last year.

On the supply side there was a mixed bag of increases and decreases in output. Maui continued a gradual decline from around 50TJ/day down to close to 45TJ/day. Pohokura was static at around 34TJ/day until the end of the month when it increased to 46TJ/day. McKee / Mangahewa did the opposite, ramping down at the end of the month, from close to 60TJ down to around 47TJ/day. Turangi and Kowhai maintained the higher output seen since late January, averaging 66.5TJ/day before also dropping at the end of the month to the mid 50TJ/day.
The following graph shows production levels from major fields over the last 7 years.

Methanex gas usage maintained the reduced level seen in March and April, averaging close to 50TJ/day before shutting down completely in the middle of May. Methanex had arranged another fuel swap with Contact and Genesis, as they did last year, this time to run for 8 weeks. Huntly usage actually decreased slightly from last month to just over 50TJ/day. TCC utilised some of the gas obtained from Methanex for a couple of weeks consuming 30-35TJ per day before shutting off again late in the month.
The following graph shows trends in the major gas users over the last 7 years.

Gas storage is becoming increasingly important as falling production coincides with more variable demand particularly from gas fired electricity generation. The following chart shows how storage at Ahuroa increased through April. It remains above average levels seen at this time of year over the last few years.

Internationally, LNG netback prices ended the month at $15.21/GJ – down 10% from last month. Forecast prices for 2025 were up 3% at $17.25/GJ. Forward prices for 2026 were also up 7% at $15.7/GJ. (Note that netback prices are indicative of international prices – they are produced by the ACCC and quoted in Australian dollars. They are net of the estimated costs to convert from pipeline gas in Australia to LNG, hence the term “netback”).

New Zealand does not (yet) have an LNG export/import market, so our domestic prices are not directly linked to global prices. With recent gas supply issues, the Government is now talking about the possibility of facilitating the building of an LNG import facility.
LPG is an important fuel for many large energy users, particularly in areas where reticulated natural gas is not available. The contract price of LPG is typically set by international benchmarks such as the Saudi Aramco LPG – normally quoted in US$ per metric tonne.
The following graph shows the Saudi Aramco LPG pricing for the last 4 years as well as forecast pricing for the year ahead. Futures pricing were up over the last month but remain trending down through 2026.

The other main contributing factor to LPG prices in New Zealand is the exchange rate against the USD. The exchange rate hovered between 0.585 and 0.60 for most of May closing near its monthly high of 0.60. This remains near the lowest levels seen in recent years. This would tend to push up LPG prices when quoted in NZD.

The Coal Market
The global energy crisis has been as much about coal as it has gas. The war in the Ukraine has driven energy prices, including coal, up. Prices in May increased ending the month at US$103/T – a 5% rise over the month. These prices are finally returning to levels close to what we expect to see as shown in the following graph of prices over the last 10 years.

Like gas, the price of coal can flow through and have an impact on the electricity market. In March Genesis reported that it expects to import about 630,000 tonnes of coal between now and September. The company says it currently holds about 515,000 tonnes at Huntly and has plans in place to make a third dual-fuel Rankine unit there available this winter if gas supplies and lake storage remain tight. Genesis says that 500,000 tonnes is the equivalent of about 1,000GWh of electricity storage or 22% of maximum hydro storage in NZ.
Carbon Pricing
NZ has had an Emissions Trading Scheme (ETS) in place since 2008. It has been subsequently reviewed by several governments and is now an “uncapped” price scheme closely linked to international schemes. However, there are “upper and lower guard-rails” set up to prevent wild swings in carbon price that act as minimum and maximum prices. These increased in December 2023 to $173 and $64 respectively. Carbon prices increased 13% in May to $55.5.

As the carbon price rises, the cost of coal, gas or other fossil fuels used in process heat applications will naturally also rise. Electricity prices are also affected by a rising carbon price. Electricity prices are set by the marginal producing unit – in NZ this is currently typically coal or gas or hydro generators, with the latter valuing the cost of its water against the former. An increase in carbon price can lead to an increase in electricity prices in the short to medium term (as the marginal units set the price). A carbon price of $50/t is estimated to currently add about $25/MWh (or ~2.5c/kWh) to electricity prices. In the long term the impact should reduce as money is invested in more low-cost renewables and there is less reliance on gas and coal fired generation.
EU Carbon units increased in May to 70.4 Euro/tonne – up 6%.
About this Report:
This energy market summary report provides information on wholesale price trends within the NZ Electricity Market. Please note that all electricity prices are presented as a $ per MWh price and all carbon prices as a $ per unit price. All spot prices are published by the Electricity Authority. Futures contract prices are sourced from ASX.
Further information can be found at the locations noted below.
- Transpower publishes a range of detailed information, which can be found here: https://www.transpower.co.nz/power-system-live-data
- The Electricity Authority publishes a range of detailed information, which can be found here: https://www.emi.ea.govt.nz/
- Weather and Climate data – The MetService publishes a range of weather-related information, which can be found here: https://www.metservice.com/
Disclaimer: This document has been prepared for informational and explanatory purposes only and is not intended to be relied upon by any person. This document does not form part of any existing or future contract or agreement between us. We make no representation, assurance, or guarantee as to the accuracy of the information provided. To the maximum extent permitted by law, none of Smart Power Ltd, its related companies, directors, employees or agents accepts any liability for any loss arising from the use of this document or its contents or otherwise arising out of or in connection with it. You must not provide this document or any information contained in it to any third party without our prior consent.
About Smart Power:
Smart Power is a full-service Energy Management consultancy. Apart from Energy Procurement, Smart Power can also provide:
- Technical advice on how to reduce your energy use & emissions
- Sustainability Reporting
- Invoice Management Services
We also offer boutique energy and water billing services for landlords/property developers.
Contact us here or call one of our offices to talk to our experienced staff about how we can assist you with achieving your energy goals.
© Copyright, 2025. Smart Power Ltd


